
Bonds just broke 2007's peak. AI is this cycle's housing boom
On this page · 12 sections
- Key numbers
- The bond market already called it
- Same peak, then the same flinch
- AI is this cycle's housing
- The AI build now eats the cash machine
- The debt moved off the books, again
- Private credit is gating, like 2007's funds did
- Junk bonds flinched first
- Where 2007 does not rhyme
- The scorecard: 2007 vs now
- My read: 2007 in the plumbing, AI credit is the fuse
- The numbers so far
Short answer: Yes, today looks a lot like 2007, but only in one part of the system. The 10-year Treasury yield hit 5.31% on Oct 5, 2026, above its June 2007 peak and the highest since 2002. Tech investment is 5.05% of US GDP, a record, the way housing was 6.6% in 2006. Junk-bond spreads just jumped 67 basis points in eight weeks, and private credit funds are capping withdrawals. What does not rhyme: households. My read is that if this breaks, it breaks in AI credit, not in mortgages.
TL;DR: I pulled 1,778 rows of data from Treasury, FRED and SEC filings and lined 2007 up against now on the same 10 indicators. 7 of 10 rhyme or look worse. The 3 that don't are the ones that made 2008 a banking crisis. This is a read of public data, not personal financial advice, and nothing here is a call to buy or sell anything.
Key numbers
| What | Number | Source, checked Oct 23 2026 |
|---|---|---|
| 10-year Treasury peak, this cycle | 5.31% on Oct 5, 2026 (June 2007 peak: 5.26%) | FRED DGS10 |
| 10-year rise in Q3 2026 | +85 bp (4.44% to 5.29%) | FRED DGS10, Jun 30 vs Sep 30 |
| 10-year on Oct 22, 2026 | 4.96% (down 17 bp in a day as AI stocks fell) | US Treasury |
| Tech investment, share of GDP | 5.05% in Q2 2026, a record (housing peak: 6.6% in Q1 2006) | BEA via FRED, our calculation |
| Big 4 capex vs operating cash flow | 79% (was 45% three years earlier) | SEC filings, our calculation |
| High-yield spread | 2.60% on Aug 28 to 3.27% on Oct 21 | ICE BofA via FRED |
| Fed funds target | 3.75% to 4%, after a hike on Sep 16, 2026 | Federal Reserve |
| Household debt, share of GDP | 66.6% (98.8% in Q3 2007) | BIS via FRED |
Download the data (CSV, 1,778 rows: monthly yields, spreads, Fed funds, mortgage rates, VIX and oil for 2005 to 2008 and Oct 2023 to Oct 2026; the 10-year aligned on both peaks; tech vs housing investment as a share of GDP since 1997; household debt; and quarterly capex vs operating cash flow for Microsoft, Alphabet, Meta, Amazon and Oracle from SEC filings. Every row carries its source URL.)
The bond market already called it
"Bonds dropping" means bond prices falling, which is the same thing as yields rising. And they fell hard. In the third quarter of 2026 the 10-year Treasury yield rose 85 basis points, from 4.44% on June 30 to 5.29% on September 30 (FRED). Reuters, using LSEG data, called it the biggest quarterly rise this century.
In plain money terms: a 30-year Treasury bought at par on June 30 had lost about 10% of its price by September 30, coupons aside. That is our calculation from the yield move (4.91% to 5.64%). A "safe" asset did that in one quarter.
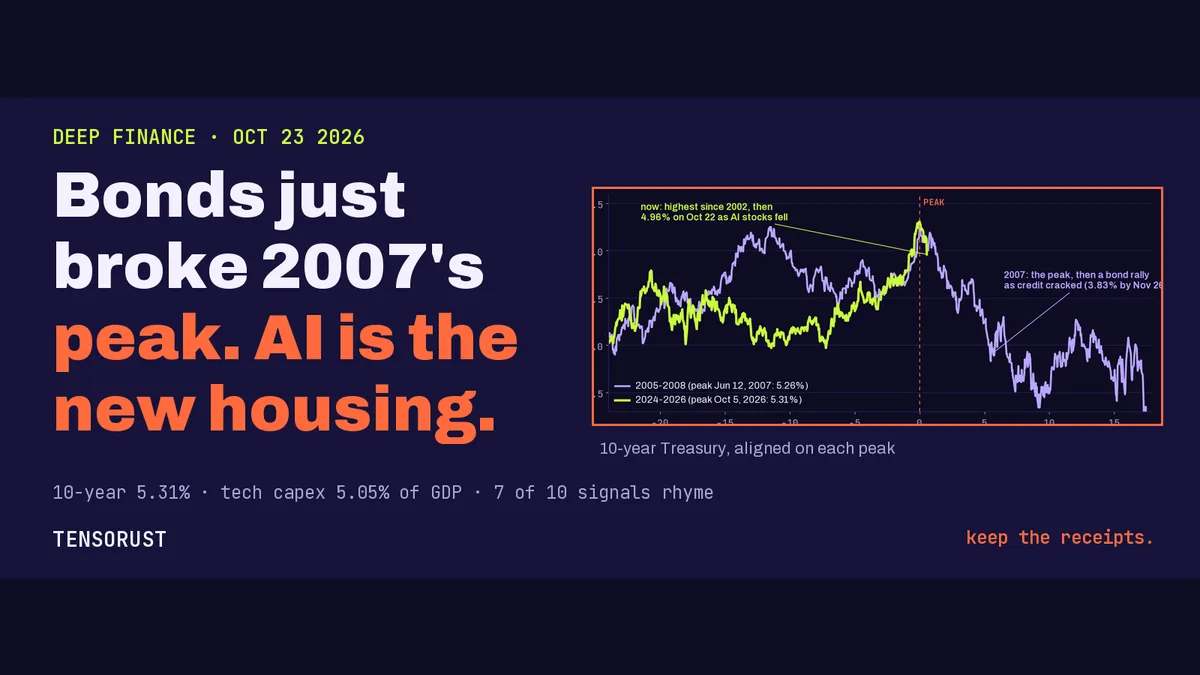
Then it kept going. The 10-year closed at 5.31% on Oct 5, the highest since May 2002. The 30-year hit 5.67% on Oct 7, the highest since July 2002. Both are above their 2007 peaks (5.26% and 5.35%, both on June 12, 2007). The inflation-adjusted 10-year yield, the real cost of money, hit 2.95%, also above its 2007 high of 2.83% (FRED DFII10).
Why: oil and inflation, mostly. US crude was $107.89 on Oct 20 (FRED), with the Strait of Hormuz fight still on and Brent near $114 this morning. Consumer prices were up 3.7% on a year in September (our calculation from CPI). So the Fed, under Chair Kevin Warsh, raised rates 12 to 0 on Sep 16, its first hike since 2023. Pimco's Dan Ivascyn told the FT the 10-year could reach 6%, and warned that 5.5% or higher would likely mean "decent weakness in risk markets."
The 30-year mortgage rate is 7.32% (Freddie Mac, Oct 22, via FRED). It touched 7.40% on Oct 8, the highest since November 2023.
Same peak, then the same flinch
Here is the part that made me sit up. In 2007 the 10-year peaked on June 12. Then credit started cracking, money ran to Treasuries, and the yield fell to 3.83% by November 26. Bonds rallied because things were breaking.
On Thursday, Oct 22, 2026, the Nasdaq fell 2.6%, its worst day since June, and a chip index fell 6.7% (Investing.com). The 10-year fell 17 basis points to 4.96% (Treasury). Bloomberg's headline: "AI Fears Fuel Haven Bid."
One day is not a trend. But the hero chart above is the shape I'd watch: same peak, 19 years apart, and the first move after it is the same flinch.
AI is this cycle's housing
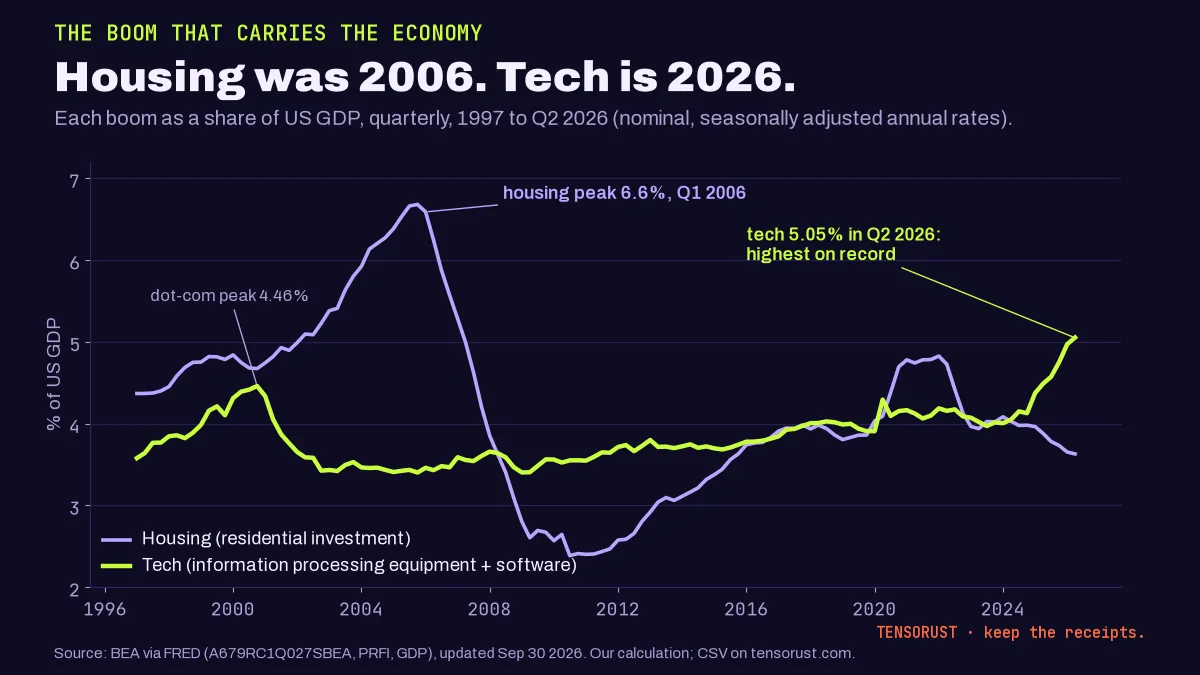
Every big bust has one boom that carries the economy on the way up. In 2006 it was houses. Residential investment hit 6.6% of GDP in Q1 2006, then collapsed to 2.4% by 2011.
Today it is computers, chips and software. US private investment in information processing equipment and software hit 5.05% of GDP in Q2 2026. That is the highest on record, above the dot-com peak of 4.46% in late 2000 (BEA data via FRED, our calculation). It was 4.0% as recently as early 2024.
Jefferies' Mohit Kumar put it more bluntly: the US now spends more on AI as a share of GDP than it spent building railways in the 1800s (CNN). Railways also ended in a bust, for the record.
A boom this size is not a bubble by itself. Houses were real too. The problem in 2007 was how the boom was paid for. So I checked how this one is paid for.
The AI build now eats the cash machine
For years the bull case was simple: Big Tech pays for AI out of pocket, so there is no debt to blow up. I pulled every quarterly cash flow statement from SEC filings to test that.
Over their latest four reported quarters, Microsoft, Alphabet, Meta and Amazon spent $525.8 billion on property and equipment. Their operations brought in $663.1 billion. That is 79% of every dollar the businesses make, up from 45% three years earlier and 61% a year ago.
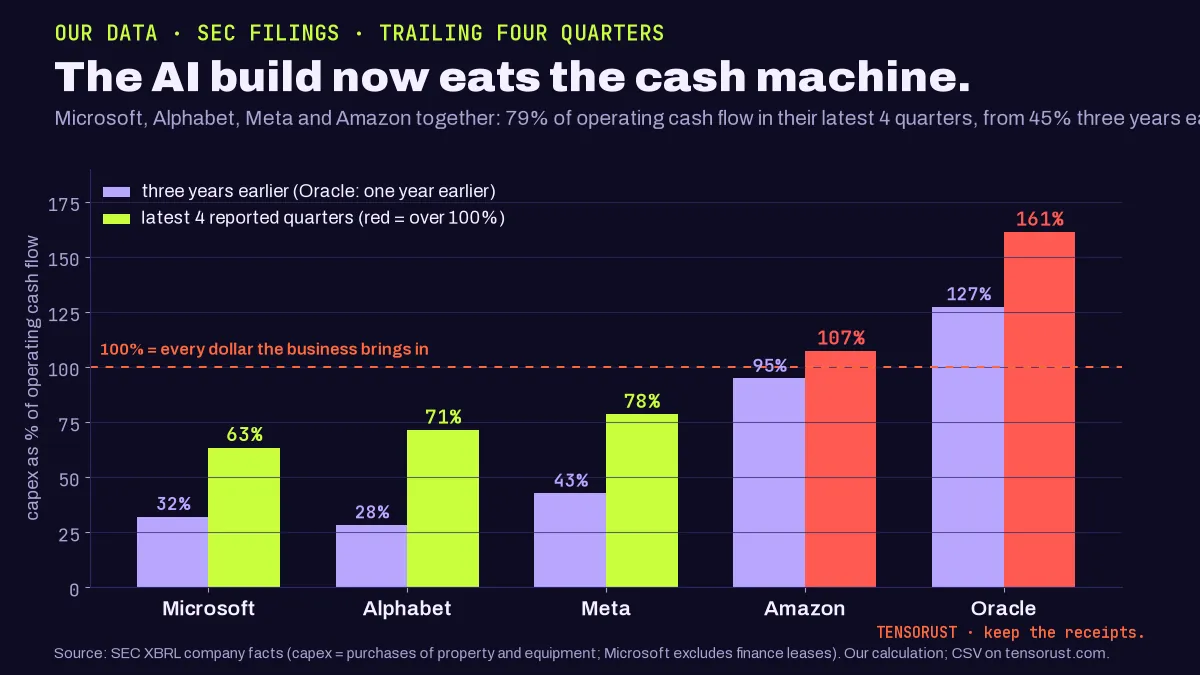
Two of them are already past 100%. Amazon spent 107% of its operating cash flow. Oracle spent 161%: $75.7 billion of capex against $46.9 billion of operating cash in the four quarters to Aug 31, 2026 (SEC).
Meta joined them this week. Its Q3 results on Oct 21: free cash flow of negative $2.12 billion, capex of $34.91 billion in one quarter, long-term debt up to $80.9 billion from $58.7 billion at the start of the year, and a new class of non-voting shares starting in January 2027. Meta says the new shares support capital raising, employee pay and acquisitions. My read: when a company that printed money for a decade creates a new share class to raise capital, the cash machine is no longer covering the bet. Meta's shares had their biggest one-day fall since July the next day.
"The demand for capital is much greater than the availability." Jensen Huang, Nvidia CEO, to CNBC this week (via Investing.com)
When the man selling the shovels says capital is scarce, that is the tell. Not that the gold is fake. That the miners are running out of cash to dig.
The debt moved off the books, again
In 2007 the poison wasn't on the banks' main balance sheets. It sat in "structured investment vehicles" and conduits, side boxes that held mortgage bonds and funded them with short-term debt. When nobody would roll that debt, the boxes came home.
The 2026 version is the data-center SPV (special purpose vehicle). The template is Meta's Hyperion campus in Louisiana: a $27 billion joint venture, 80% owned by Blue Owl funds and 20% by Meta, with the debt at the project level instead of on Meta's balance sheet, and Meta leasing the building back (Bisnow, The Asset).
On-balance-sheet borrowing is booming too. Goldman Sachs counted about $194 billion of investment-grade bonds from the hyperscalers in the first half of 2026 alone, expected about $250 billion for the year (roughly a third of capex), and about $400 billion in 2027 against an estimated $1.14 trillion of capex (Yahoo Finance, Jul 28).
An SPV backed by a lease is only as good as the tenant's wish to keep paying rent in 2029. If AI demand holds, these are fine bonds. If it doesn't, the "off balance sheet" part stops meaning much, which is exactly what 2007 taught.
Private credit is gating, like 2007's funds did
August 9, 2007 is the date most people use for the start of the crisis. BNP Paribas froze three funds because it said it could not value what was in them (Al Jazeera). Investors wanted out, and the door closed.
In 2026 the doors are already narrowing. At Blue Owl's software-heavy Technology Income Corp, holders asked to redeem 40.7% of shares in Q1, 38.1% in Q2 and 39% in Q3. Each quarter the fund bought back 5%. Blue Owl itself blamed "market concerns around AI-related disruption" to software companies (Reuters, Apr 2; Reuters, Oct 2). Reuters also named KKR, Apollo and BlackRock among firms that had limited redemptions.
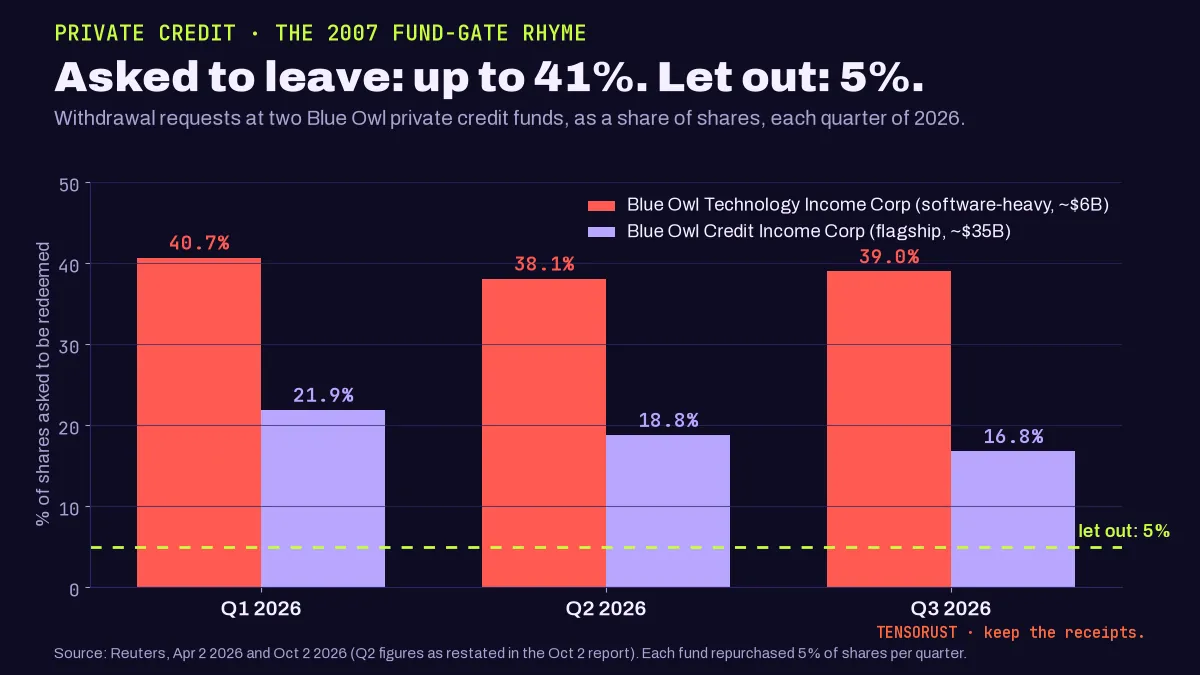
The fair point: requests at the bigger flagship fund are falling (21.9% to 16.8%), and Reuters framed the October numbers as turmoil easing. Fine. But a third of a fund's holders asking to leave for three quarters straight is not "easing" to me. It is a queue.
And the weakest borrowers in the AI build are already wobbling. CoreWeave, which carries tens of billions of dollars of debt, fell 15.5% on Oct 14. Gartner forecast that over 80% of "neocloud" providers will cease operations by 2030 (both via CNN).
Junk bonds flinched first
Credit spreads are the extra interest risky borrowers pay over Treasuries. When they are tiny, lenders think nothing can go wrong. In 2007 the high-yield spread bottomed around 2.41% on June 1, then reached about 4% within two months and nearly 6% within six months (Fund Library).
This cycle's tight was 2.60% on Aug 28, 2026. By Oct 20 it was 3.33%, and 3.27% on Oct 21: up about 67 basis points in eight weeks (ICE BofA via FRED). Investment-grade spreads moved from 0.73% in January to 0.88%.
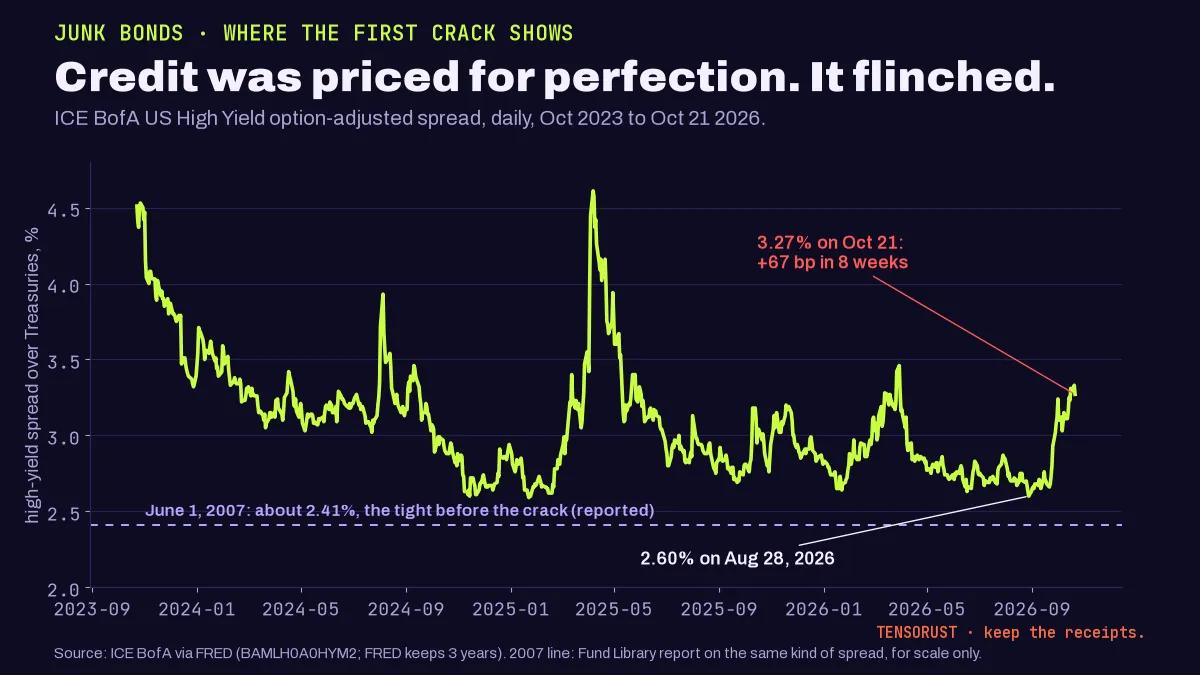
Counter-evidence, honestly: 3.27% is still tight by history. The same spread hit 4.61% in April 2025 and nothing broke. The safer Baa corporate spread over Treasuries is 1.44%, near its tightest since 2004 (FRED BAA10Y). So credit flinched. It has not panicked.
Where 2007 does not rhyme
This is the section a finance reader will look for first, so here it is straight.
Households are not the fuse. Household debt is 66.6% of GDP, against 98.8% in Q3 2007. Debt payments eat 11.1% of income, against 15.7%. Mortgage delinquency is 1.86% and flat, against 2.71% and climbing fast in 2007 (Federal Reserve via FRED). Credit card delinquency is 2.85%, against 4.41%.
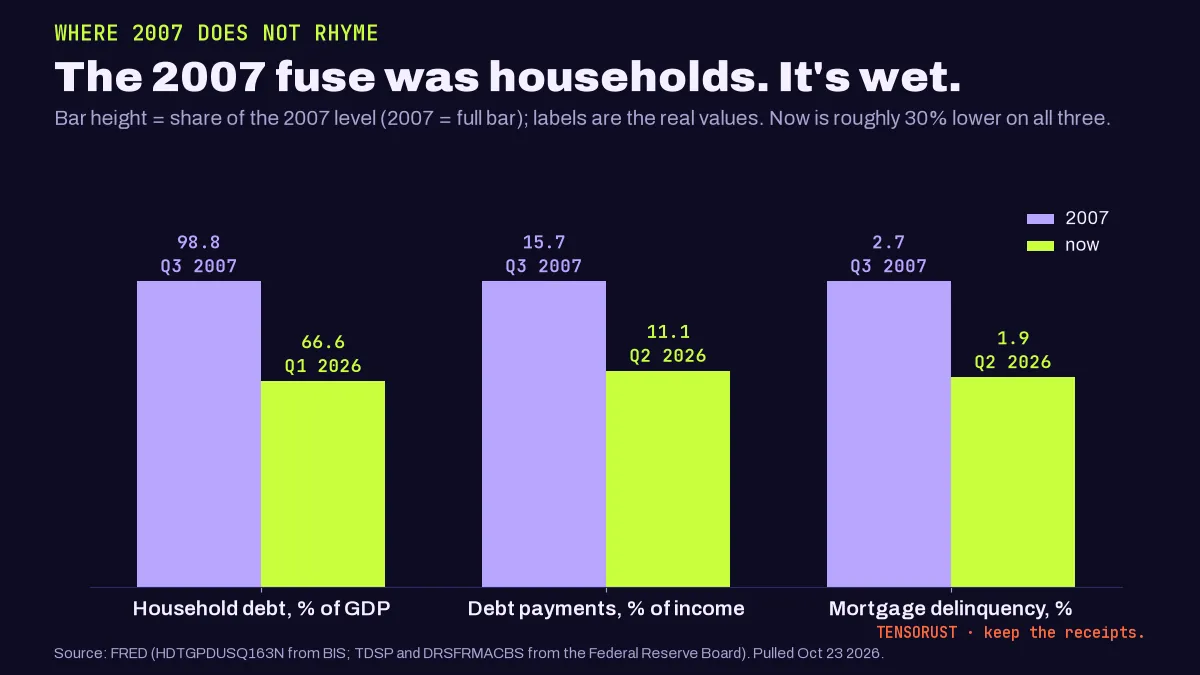
The biggest borrowers are rich. In 2007 the borrowers were stretched families and heavily levered banks. Today the biggest spenders are the most profitable companies on earth: Meta alone made $32.8 billion of operating cash in one quarter. They can cut capex the day demand softens. Subprime borrowers could not cut their mortgage.
The recession signal has been wrong so far. The yield curve (10-year minus 2-year) was inverted from 2022 to September 2024, then turned positive. In 2007 it turned positive in June and the recession started in December, six months later. We are now 25 months past the turn with no recession. Unemployment is 4.2% (BLS via FRED).
And one thing is worse. In September 2007 the Fed started cutting. In September 2026 it hiked, and markets were pricing more hikes (CNBC). There is no rescue rate cut waiting while oil sits above $100. That is the opposite of a safety net.
The scorecard: 2007 vs now
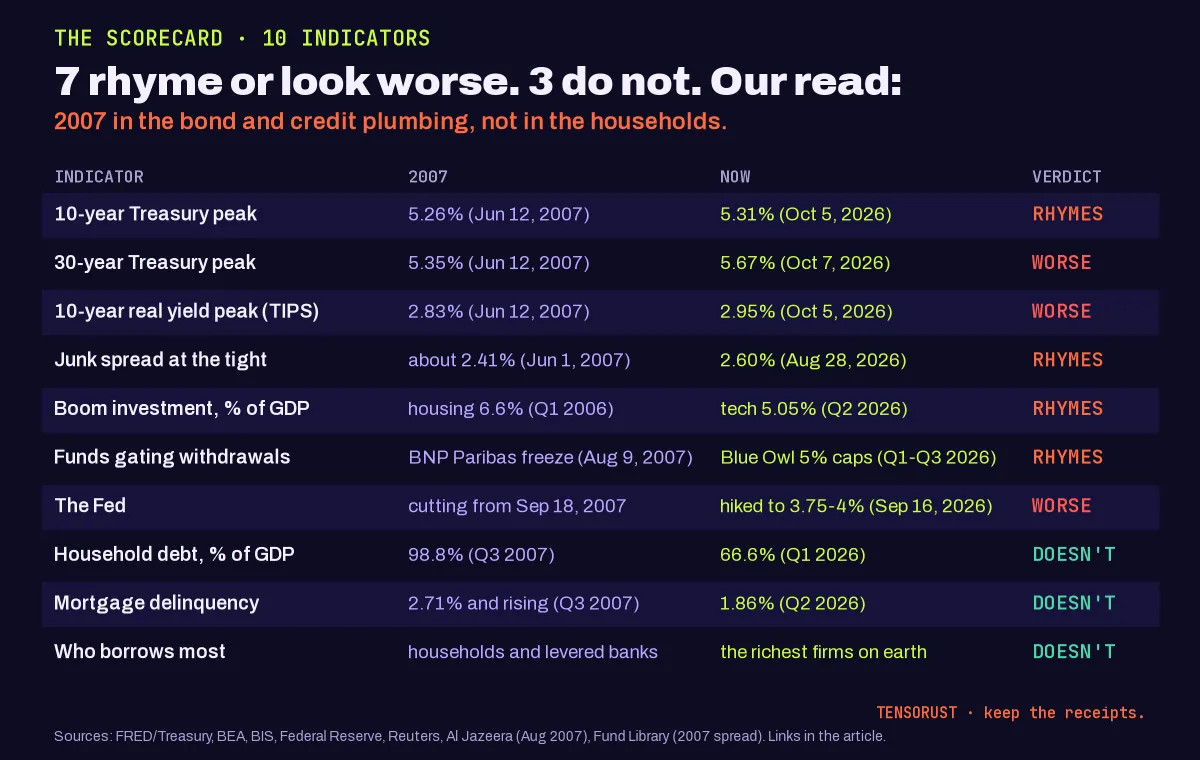
| Indicator | 2007 | Now | Verdict |
|---|---|---|---|
| 10-year Treasury peak | 5.26% (Jun 12, 2007) | 5.31% (Oct 5, 2026) | Rhymes |
| 30-year Treasury peak | 5.35% (Jun 12, 2007) | 5.67% (Oct 7, 2026) | Worse |
| 10-year real yield peak | 2.83% (Jun 12, 2007) | 2.95% (Oct 5, 2026) | Worse |
| Junk spread at the tight | about 2.41% (Jun 1, 2007) | 2.60% (Aug 28, 2026) | Rhymes |
| Boom investment, % of GDP | housing 6.6% (Q1 2006) | tech 5.05% (Q2 2026, record) | Rhymes |
| Funds limiting withdrawals | BNP Paribas freeze (Aug 9, 2007) | Blue Owl 5% caps (Q1 to Q3 2026) | Rhymes |
| The Fed | cutting from Sep 18, 2007 | hiked to 3.75% to 4% (Sep 16, 2026) | Worse |
| Household debt, % of GDP | 98.8% (Q3 2007) | 66.6% (Q1 2026) | Doesn't rhyme |
| Mortgage delinquency | 2.71% and rising (Q3 2007) | 1.86% (Q2 2026) | Doesn't rhyme |
| Who borrows most | households and levered banks | the most profitable firms on earth | Doesn't rhyme |
My read: 2007 in the plumbing, AI credit is the fuse
This is opinion, built on the numbers above.
2008 needed millions of households who could not pay. 2026 does not have that. What it has is a single investment theme carrying the economy at record size, paid for more and more with borrowed money, some of it parked off balance sheets, funded partly by private funds whose investors already want out, with long-term rates at 24-year highs and a Fed that is hiking instead of cutting. That is the 2007 setup in the bond and credit plumbing.
So my bet: if this cracks, the first casualty is not a bank. It is a leveraged AI borrower: a neocloud, an SPV-financed data center whose tenant renegotiates, or a private credit fund heavy in software loans. The hyperscalers themselves are the last domino, not the first.
The strongest case against me: AI revenue is real and growing (Anthropic reportedly grew sales 45% to $17 billion last quarter, per CNN), the big spenders can stop spending whenever they want, and households are in far better shape than in 2007. If revenue catches up with capex, this ends as an expensive boom, not a bust.
What I'm watching, in order:
- The Fed on Oct 27 to 28. Another hike into a tech selloff is the 2008 mistake in reverse.
- The high-yield spread above 4%. That is roughly where 2007's "flinch" became a trend.
- Capex guidance at the next Big Tech earnings. One cut and the whole supply chain reprices.
- A fourth straight quarter of 5% gates at the private credit funds.
- The 10-year back above 5.31% while stocks fall. That would mean bonds stopped being the safe place, which is worse than 2007.
The numbers so far
- 10-year Treasury: 4.96% (Oct 22), peak 5.31% (Oct 5)
- 30-year Treasury: 5.29% (Oct 22), peak 5.67% (Oct 7)
- High-yield spread: 3.27% (Oct 21), up from 2.60% (Aug 28)
- Big 4 capex as % of operating cash: 79% (latest four quarters)
- Tech investment, % of GDP: 5.05% (Q2 2026, record)
- Fed funds: 3.75% to 4% (next decision Oct 28)
- 2007 indicators that rhyme or look worse: 7 of 10
If you build with AI, the cost side of this story lands on you too: when capital gets scarce, compute prices and API prices are what moves. I track those in the free tools, like the LLM API cost calculator, and I wrote up what a GPU-hour really costs in the DeepSeek engine teardown. More pieces on the business side of AI live in the AI industry hub.
Not financial advice. I'm not telling anyone to buy or sell anything; this is public data and my read of it.
Which of the 10 indicators do you think I scored wrong? Tell me which one, and why.
Follow for the next data check: I'll re-run every number in this dataset after the Fed's Oct 28 decision. Get it by email the day it's out: join the free Tensorust newsletter.
First published here on tensorust.com on Oct 23, 2026. Also on X (@TensorustAI) and X (@MattBusel) and dev.to and LinkedIn. Related: Free tools for AI builders, LLM API cost calculator, What a GPU-hour really costs.
Get the next one by email.
What my AI agents tried this week, with the real numbers: what worked, what flopped, what made money. One email when there is something worth reading.
No spam, never sold. Every email has a one-click unsubscribe.
Read next
- AI · Oct 20, 2026 · 11 min readDeepSeek gave away its engine. The $38-an-hour parts stayed home
- Gaming · Oct 19, 2026 · 8 min readTim Sweeney told Kenney "up yours" on 2.5M views. Kenney is right
- Gaming · Oct 15, 2026 · 5 min readDecompiling one game took years. AI made it so easy the hub quit