
Exponential backoff with jitter: 64 of 100 LLM calls still failed
On this page · 10 sections
- The setup: 100 calls, one token bucket
- Three tries is not a policy for a burst
- Why it comes in waves: plus or minus 10% is not jitter
- Full jitter fixed the tail, not the total
- Retry-After: the provider already told you when
- The real fix for a known limit: pace on your side
- What to retry (and what llm-retry got wrong)
- The circuit breaker's half-open door
- Do this in your project
- The data, and how to rerun it
TL;DR: I fired 100 LLM calls at once into a rate limiter that refills 10 requests a second, using the default retry policy of my own C++ library, llm-retry: exponential backoff, 3 tries, plus or minus 10% jitter. 64 of the 100 calls still failed, and the provider had to turn away 255 requests to serve 36. Raising it to 8 tries got every call through, but in 16.6 seconds instead of the 8.0 the limit allows. A client-side rate limiter did it in 8.0 seconds with zero 429s. Along the way the probes found three more bugs in the library: it never retries Anthropic's 529 overloaded_error, it retries your own exceptions, and its circuit breaker's half-open state let 50 of 50 calls hit a provider that was still down.
Short answer for the search. Exponential backoff with jitter means: after the n-th failure, wait a random time between 0 and min(cap, base * 2^n) before trying again. The doubling stops you hammering a struggling server; the randomness stops every client that failed at the same moment from retrying at the same moment. That second part is the one most code gets wrong. A "jitter" of plus or minus 10% around a fixed delay is not enough; it just moves the stampede by 50 milliseconds. And if the server tells you when to come back (the retry-after header), that beats any formula.
The numbers below are from a fresh run on October 18, 2026, against the real header from github.com/Mattbusel/llm-retry (commit abd6a3e). Every chart has its raw CSV behind it.
The setup: 100 calls, one token bucket
llm-retry is a single-header C++ library I wrote in March for retrying LLM API calls: a with_retry wrapper, a with_failover to a second model, and a CircuitBreaker. It has 2 stars and green CI, and until today I had only ever tested it with one call that fails twice and then works. That test passes. It also tells you nothing about what happens when a whole app hits a rate limit at once, which is when retries actually matter.
So the experiment copies how real LLM APIs limit you. Anthropic's rate limit docs say the API uses the token bucket algorithm: your capacity refills continuously up to a maximum, instead of resetting every minute. Each request takes a token; no token, you get a 429. My fake provider is exactly that, with a burst of 20 and a refill of 10 per second, and it answers 429s with a retry-after in whole seconds, the way the HTTP header works (RFC 9110):
// herd.cpp: the "provider", a token bucket
int request(int client, int attempt) {
    std::lock_guard<std::mutex> lk(m);
    double t = now_ms();
    tokens = std::min(capacity, tokens + (t - last) / 1000.0 * refill_per_s);
    last = t;
    bool ok = tokens >= 1.0;
    if (ok) tokens -= 1.0;
    log.push_back({t, client, attempt, ok});
    if (ok) return 0;
    double wait_s = (1.0 - tokens) / refill_per_s;
    return (int)std::ceil(wait_s);  // HTTP Retry-After is whole seconds
}
Then 100 threads, each wanting one completion, all start on the same instant. That is a batch job kicking off, a deploy restarting every worker, or an agent fanning out 100 tool calls. The best any client can possibly do here is 8.0 seconds: 20 answers from the burst at time zero, then 80 more at 10 a second. Every policy below is measured against that floor. Each one ran 3 times; the numbers are the means, and the run-to-run spread was small (the outcome counts were identical in all 3 runs for every 3-try policy).
Three tries is not a policy for a burst
Here is what each policy got out of the same 100 calls and the same limit:
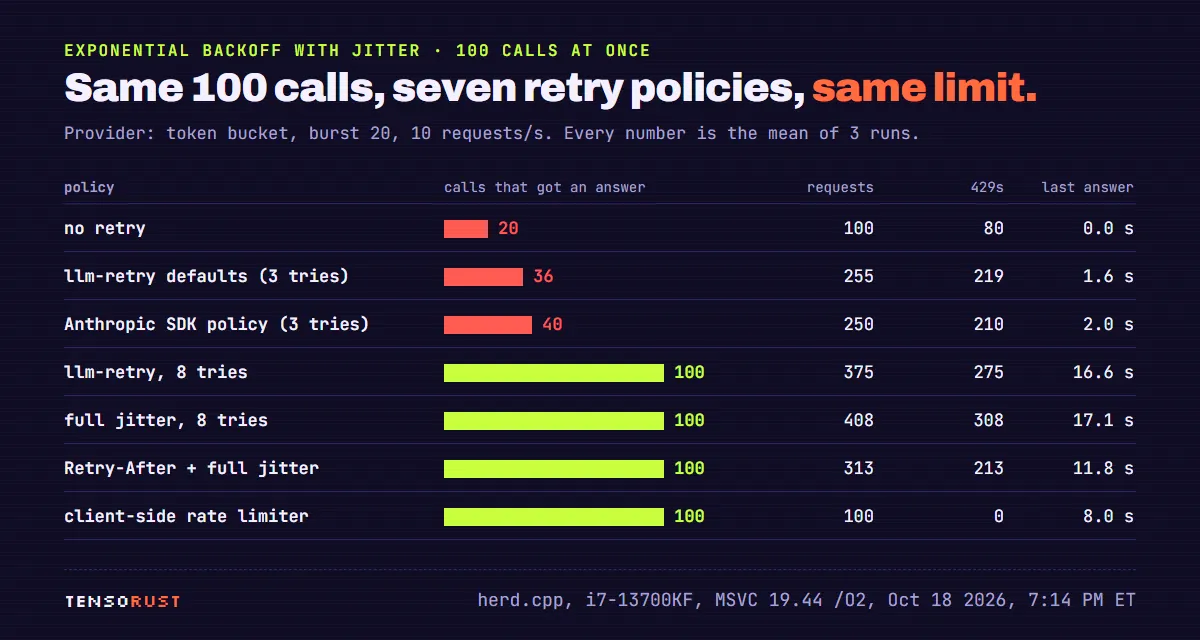
With no retry at all, 20 calls get the burst and 80 fail instantly. With llm-retry's defaults, 36 succeed: the retries buy 16 more answers and cost the provider 155 extra requests. That is 2.55 requests per call, close to the "just below 3x" amplification Google's SRE book measured for a three-attempt budget in its chapter on handling overload.
For comparison I ported the retry logic of Anthropic's official Python SDK into the same harness (from _base_client.py: 2 retries by default, 0.5 s doubling to a max of 8 s, 75 to 100% jitter, and it obeys retry-after when the server sends one). It got 40 of 100. That is not a bug in the SDK. Two retries are meant for a blip, and the SDK lets you raise max_retries. It is a reminder that every default retry policy I have seen is built for a flaky call, not for a hundred calls that all need the same scarce resource.
The obvious fix is more tries. With max_attempts = 8, llm-retry gets all 100 calls through. It also takes 16.6 seconds, more than twice the 8.0 floor, and sends 375 requests. To see why, look at what the provider receives.
Why it comes in waves: plus or minus 10% is not jitter
This is the delay code in llm_retry.hpp, unchanged:
// include/llm_retry.hpp @ abd6a3e
struct RetryConfig {
    int max_attempts          = 3;
    double base_delay_ms      = 500.0;
    double max_delay_ms       = 30000.0;
    double backoff_multiplier = 2.0;
    double jitter_factor      = 0.1;
    std::vector<int> retry_on_http_codes = {429, 500, 502, 503, 504};
};
// ...inside with_retry, after a retryable failure:
double delay = detail::compute_delay_ms(attempt, config);   // 500, 1000, 2000, ...
std::uniform_real_distribution<double> jitter_dist(
    1.0 - config.jitter_factor, 1.0 + config.jitter_factor);
delay *= jitter_dist(rng);
Every client that failed at time zero waits 450 to 550 ms. So 80 retries land inside the same 100 ms window, while the bucket has refilled about 5 tokens. 5 succeed, 75 fail again, and all 75 now wait 0.9 to 1.1 seconds. Then about 2 s, then 4, then 8. Between the waves the bucket refills and nobody is asking, so the capacity in those gaps is simply wasted. Once it is full (20 tokens) every extra token it would have added is lost.
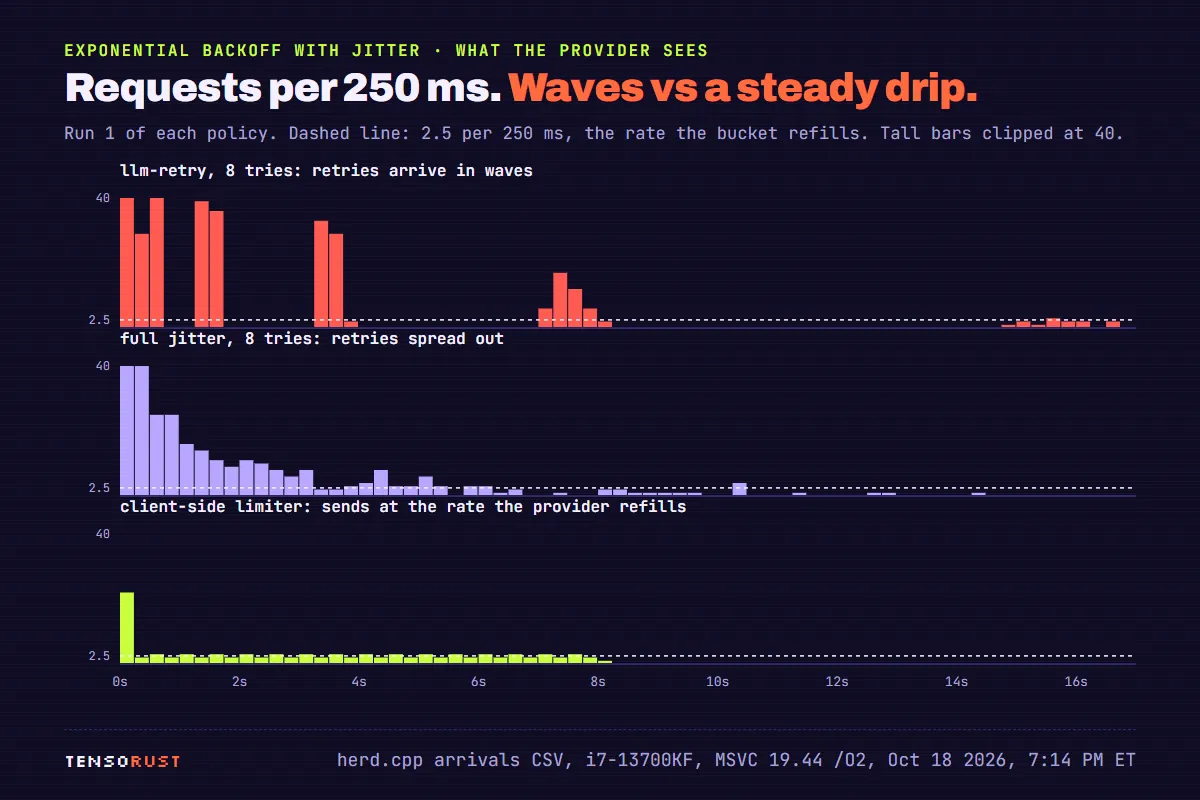
The top panel is the herd, run 1: four tall red spikes, then a long silence, then a trickle at 15 to 17 seconds. That silence between 8 and 15 seconds is capacity the limit would have given you for free. This is the pattern AWS's Marc Brooker described in "Exponential Backoff And Jitter": backoff alone keeps the clients clustered, it just spaces the clusters out.
Full jitter fixed the tail, not the total
The textbook fix is "full jitter": pick the delay uniformly between 0 and the exponential ceiling, so the herd smears out instead of moving as one block.
// herd.cpp: full jitter (the same 500 ms base, 30 s cap, 8 tries)
for (int a = 1; a <= max_attempts; ++a) {
    attempts = a;
    int ra = call(a);
    if (ra == 0) return true;
    if (a == max_attempts) return false;
    double ceiling = std::min(cap, base * std::pow(2.0, a - 1));
    double d = std::uniform_real_distribution<double>(0.0, ceiling)(rng);
    if (honor_ra) d += ra * 1000.0;     // the Retry-After variant, below
    sleep_ms(d);
}
I expected this to win outright. It did not, and this was the most useful surprise of the run. Full jitter cut the 95th percentile from 16.1 s to 10.5 s: most calls finished much sooner, and you can see it in the replay at the top, where it has 80 answers at the 6.4 second mark against 57 for the herd. But the last call landed at 17.1 s (the herd: 16.6), and it sent 408 requests, 9% more. With a random delay every retry comes back sooner than the fixed one would (half of them in less than half the time), finds an empty bucket and burns a request. Against a token bucket, a smarter guess still spends most of its requests guessing.
Brooker's post measured clients competing for one contended resource, where full jitter cut both the work and the time. A rate limiter is a slightly different animal: it tells you the answer if you listen.
Retry-After: the provider already told you when
A 429 from a real API usually says how long to wait. Anthropic's docs: "When the response has a retry-after header, wait that many seconds before retrying" (rate limits). MDN's page on 429 says the same for HTTP in general. llm-retry's LLMError has no field for it, so the header is read by nobody.
Honoring it, with full jitter added on top so the clients do not all come back on the same whole second: 11.8 s to the last answer (10.2 to 14.5 across the 3 runs), 313 requests, p95 9.1 s. Better on every number than both backoff formulas. Still 213 wasted requests, because retry-after is in whole seconds and 80 clients cannot all have the next token.
The real fix for a known limit: pace on your side
If you know your limit (and for an LLM API you do: it is on your console's limits page), the cheapest 429 is the one you never send. A client-side limiter hands out send slots at the rate the provider refills, before the request leaves your process:
// herd.cpp: shared by all 100 clients, paced at the provider's 10/s
struct ClientLimiter {
    double rate, next = 100; std::mutex m;  // first paced send at 100 ms
    explicit ClientLimiter(double r) : rate(r) {}
    double reserve(double burst_until) {    // returns ms to wait
        std::lock_guard<std::mutex> lk(m);
        double t = now_ms();
        if (next < t) next = t;
        double slot = next;
        next += 1000.0 / rate;
        (void)burst_until;
        return slot - t;
    }
};
Result, all three runs: 100 of 100, 100 requests, 0 429s, last answer at 8.0 s. That is the floor. The bottom panel of the waves chart is what that looks like from the provider's side: one burst, then a steady drip exactly on the refill line. The retry loop is still there behind it, for the 429s you did not predict (another process on the same key, a limit change), but here it never fired.
In a real app the limiter goes wherever all your calls already pass through: one per API key, shared across threads or workers. If you run a proxy for LLM traffic, that is the natural home. My Rust one, tokio-prompt-orchestrator, does dedup and a circuit breaker there; in the LLM proxy benchmark it turned 200 duplicate calls into 1, which is the other cheap way to avoid a 429: do not send the same call twice.
What to retry (and what llm-retry got wrong)
Retry policy is half "how long to wait" and half "is this even worth retrying". I ran one failing call per error type through llm-retry's defaults:
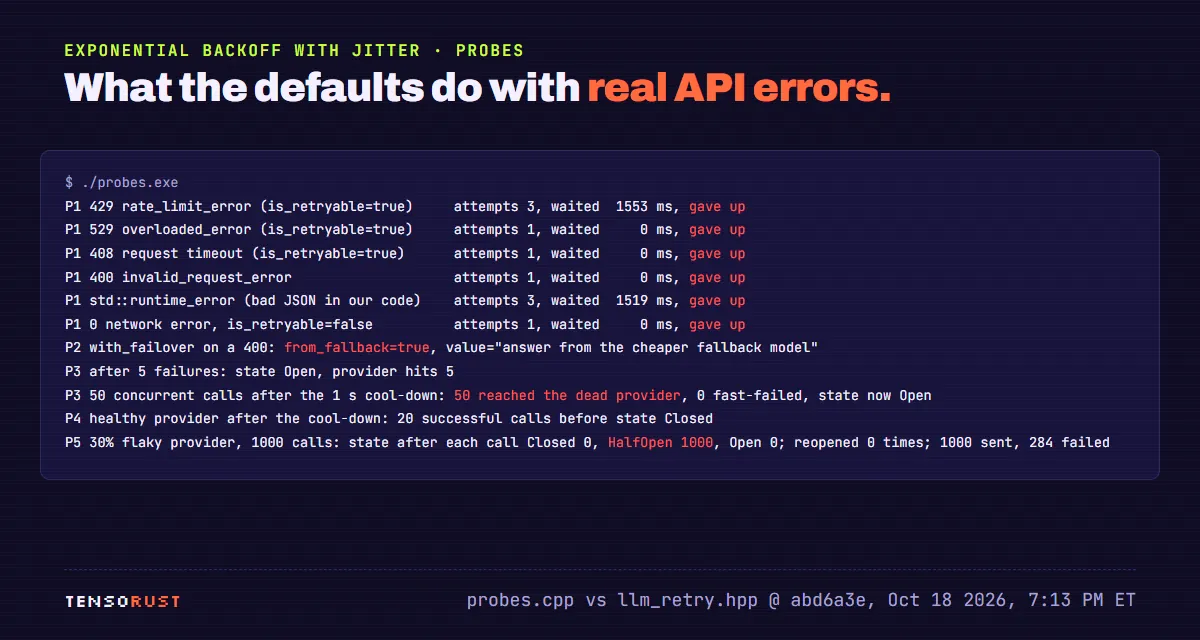
Three of those lines are bugs, and one of them matters a lot for anyone calling Claude:
- 529 is never retried. Anthropic's errors page lists
529 overloaded_error: "The API is temporarily overloaded", which happens under high traffic across all users. It is exactly the error backoff exists for, and it is not in the defaultretry_on_http_codeslist, so llm-retry gives up on the first one. Same for 408 (request timeout), which the official SDK retries along with 409, 429 and every 5xx (_should_retry). - Your own exceptions are retried. A
std::runtime_errorfrom, say, a JSON parse in your own callback falls into acatch (...)that retries it 3 times with no jitter, 1.5 seconds of waiting for a bug that will fail the same way every time. Malformed model output is a real cause of this one; the LLM JSON output piece measured how often it happens. with_failoverhides broken requests. A400(your prompt is too long, your JSON is wrong) silently returns the fallback model's answer withfrom_fallback=true. The bug in your request becomes a quality drop nobody notices.
And one 429 you should not retry at all. Anthropic's errors page says a 429 caused by your tier's monthly spend cap "has no retry-after header and keeps failing until access resumes". So "429 without a retry-after" is a different situation from "429 with one", and a policy that treats them the same just spends its attempts and its users' time. Here is the whole table:
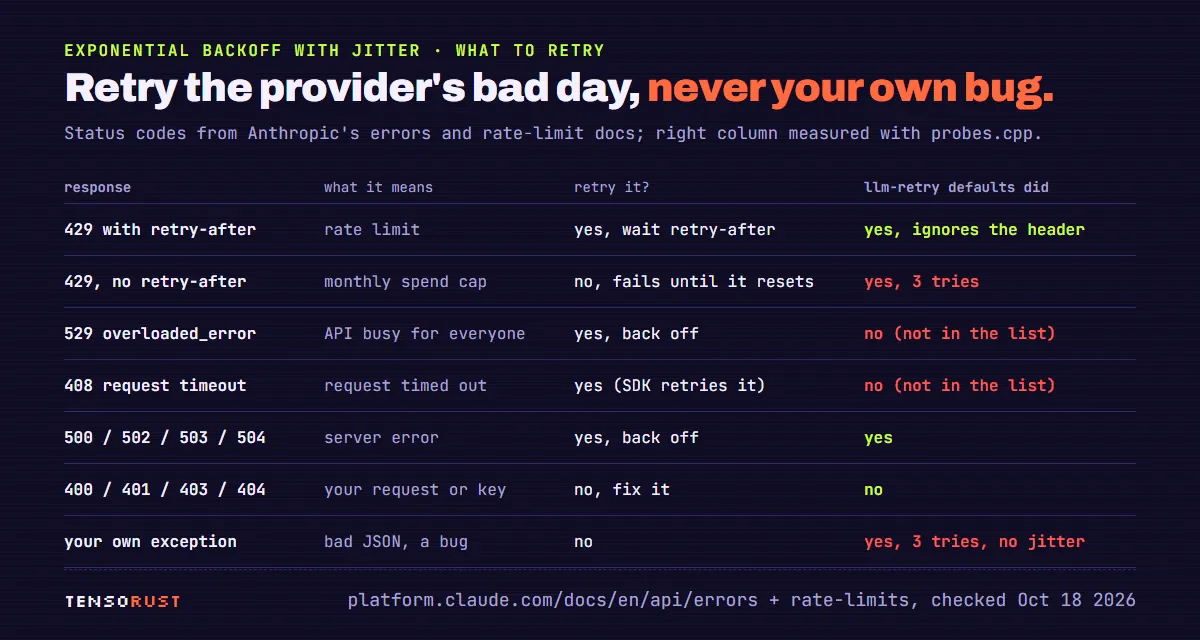
The circuit breaker's half-open door
A circuit breaker (Martin Fowler's write-up is the classic) stops calling a provider that keeps failing. After N failures it "opens" and fails fast; after a cool-down it goes "half-open" and lets one test call through; that call decides whether to close again or reopen. llm-retry's version:
// include/llm_retry.hpp @ abd6a3e, CircuitBreaker::call
if (state_ == CircuitState::Open) {
    auto now = std::chrono::steady_clock::now();
    double secs = std::chrono::duration<double>(
        now - last_failure_time_).count();
    if (secs >= config_.timeout_seconds) {
        state_ = CircuitState::HalfOpen;     // ...and nothing stops the next caller
    } else {
        throw std::runtime_error(
            "CircuitBreaker[" + name_ + "]: circuit is Open");
    }
}
Nothing limits half-open to one call, and closing again needs the success rate since the last reset to reach 80%, with the old failures still counted. I pushed on it three ways:
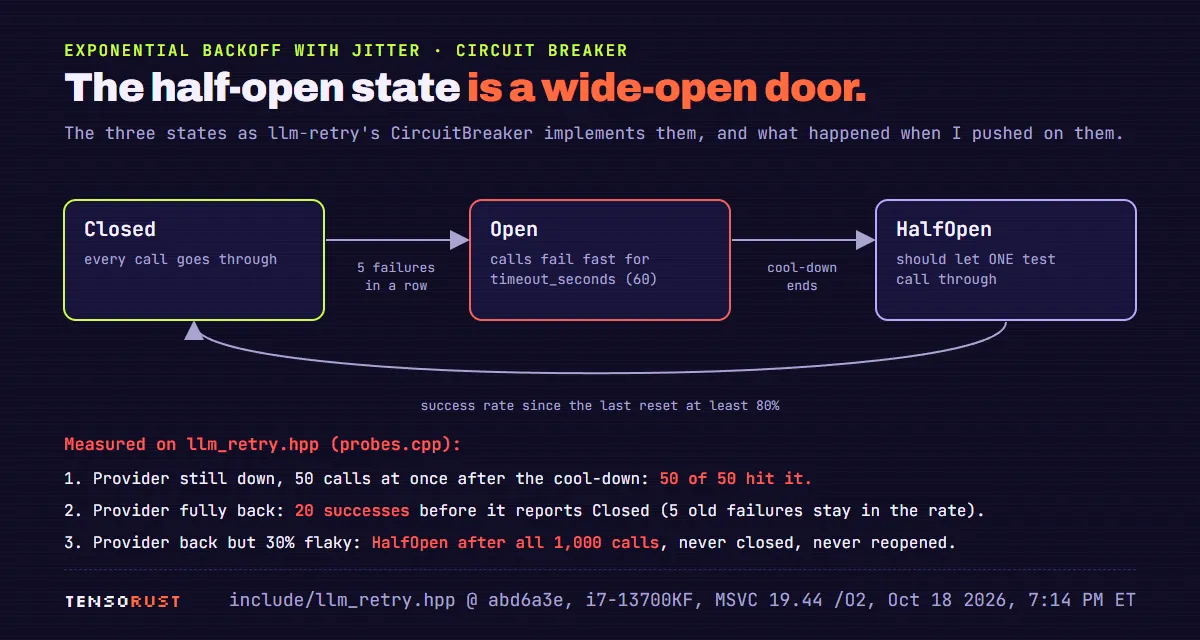
When the cool-down ended with the provider still down, 50 concurrent calls all went through to it, each waiting out its own failure. When the provider was fully back, the breaker needed 20 straight successes before it admitted it (5 old failures, so 25 calls to reach 80%). And against a provider that came back 30% flaky, it sat in HalfOpen for all 1,000 calls: never closed, never reopened, so its state stopped meaning anything.
The fix is small: allow one trial call at a time in half-open, close on its success and clear the counters, reopen on its failure.
// probes2.cpp: patched half-open
if (state_ == State::HalfOpen) {
    if (trial_in_flight_) throw std::runtime_error("circuit half-open, trial in flight");
    trial_in_flight_ = trial = true;
}
// on success:  if (trial) { state_ = State::Closed; trial_in_flight_ = false; }
// on failure:  if (trial || consecutive_ >= threshold_) { state_ = State::Open; ... }
Same three probes on the patched version: 1 of 50 calls reached the dead provider (49 failed fast), 1 success closed it, and the 30% flaky provider kept it Closed for all 1,000 calls (284 failures, never 5 in a row), which is honest: a provider that answers 72% of the time is up, and that is a job for retries, not the breaker. These fixes are not in the public repo yet as of October 18; they ship there next.
Do this in your project
- Use full jitter, not plus or minus 10%.
delay = random(0, min(cap, base * 2^attempt)). In this test it cut the p95 from 16.1 s to 10.5 s for free. - Read
retry-afterand obey it, plus a little random spread so your clients do not come back on the same whole second. It beat both formulas here: 11.8 s against 16.6 and 17.1. - A 429 without
retry-aftermay be a spend cap. On Anthropic's API it fails until the cap resets. Alert, do not loop. - Retry 408, 409, 429, 5xx and 529. Never retry 4xx you caused, and never retry your own exceptions. If your retry wrapper has a
catch (...), it is retrying bugs. - If you know the limit, pace before you send. One limiter per API key, shared by every worker. It was the only policy that hit the 8.0 s floor, with 0 wasted requests.
- Cap the retries per client too. Google's SRE book uses a per-client retry budget of 10% on top of 3 attempts per request, which it says brings the load growth from just under 3x down to 1.1x. Our 3-try default was 2.55x.
- Half-open means one trial call. Test your breaker with 50 concurrent calls after the cool-down. If more than one reaches the provider, it is not a breaker.
- Test the burst, not the blip. My library's own example (one call that fails twice) passed for seven months while the 100-call case failed 64% of the time.
For the dollar side of a fan-out like this (what 100 parallel calls cost per model before any retry), the LLM API cost calculator does the per-call math.
The data, and how to rerun it
Everything is three small C++ files, built with MSVC 19.44 (cl /std:c++17 /O2 /EHsc) on an i7-13700KF and run on October 18, 2026, between 7:13 and 7:19 PM Eastern. herd.cpp (the provider, the 100 clients, all seven policies; one arrivals CSV and one results CSV per run, 21 runs), probes.cpp (the error-type and breaker probes against the unmodified llm_retry.hpp), and probes2.cpp (the patched breaker). Wall-clock sleeps are real, so a run takes as long as it says: the 8-try policies take about 17 seconds each, the whole set about 3 minutes. Change the bucket to your own limits (Anthropic's per-tier numbers are on the rate limits page) and you will get your own floor to measure against.
One caveat: the provider here is a simulation of the documented algorithm, not a real API, and real latency would stretch every number a little. My bet is that the shape holds: fixed-delay retries come in waves, the waves waste capacity, and the provider's own hint beats your guess.
What I would like to know: does anyone run a shared client-side limiter in front of their LLM calls in production, and how do you keep it in sync when the provider changes your limits? That is the part I have not solved.
If you are adding AI to an app and want the boring parts done right (timeouts, retries, rate limits, budgets, evals), that is what I build at a fixed price.
First published here on tensorust.com on Oct 18, 2026. Also on dev.to. Related: LLM API cost calculator, LLM proxy benchmark, Open-source Rust crates.
Get the next one by email.
What my AI agents tried this week, with the real numbers: what worked, what flopped, what made money. One email when there is something worth reading.
No spam, never sold. Every email has a one-click unsubscribe.
Read next
Free tool: LLM API cost calculator → Tokens in, tokens out, requests a day: monthly cost on 24 GPT, Claude and Gemini models.
- Dev · Oct 18, 2026 · 16 min readLLM proxy benchmark: 200 duplicate calls became 1 (and a 30 s bug)
- AI · Oct 17, 2026 · 12 min readLLM JSON output: one setting dropped valid JSON from 75% to 4%
- AI · Oct 17, 2026 · 14 min readRun an LLM in the browser: WebGPU did 63 tokens/s, WASM did 1.6