
crates.io download count: 80% of ours arrived with a new version
On this page · 10 sections
- Where the 69 crates came from
- Pull the numbers yourself in 40 lines
- What the crates.io page shows you
- The three kinds of download day
- A new version gets about 13 downloads, then nothing
- Sweep days: when every crate gets hit at once
- Workspaces multiply the count
- The quiet baseline: the only number that means people
- Do this with your own crates
- The numbers, all of them
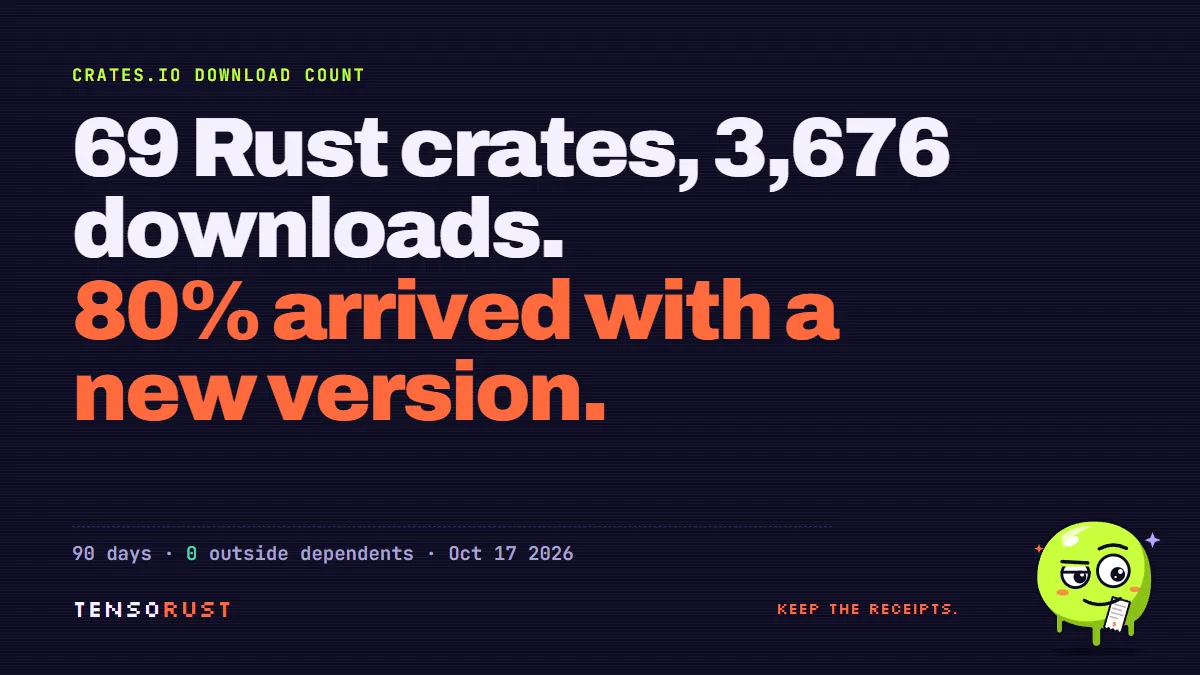
TL;DR: On October 17, 2026 I pulled every daily download number crates.io has for my 69 Rust crates. Over 89 days they logged 3,676 downloads, and 80.1% of them landed on the day a new version went up or the day after. A new version collects about 13 downloads in its first 24 hours no matter what is in it, then flatlines. Outside crates that depend on any of the 69: zero. The number that actually tells you whether people use your crate is the quiet-day baseline, and for us it was 339 downloads, about 3.8 a day.
Short answer for the search. The crates.io download count is the number of times the crate's .crate file was fetched from the crates.io CDN, counted from the CDN's request logs (crates.io moved to log-based counting in March 2024). Since October 29, 2025 only requests that look like they came from cargo (or send no user agent at all) are counted. It is not a count of users, installs or projects. One developer's CI that runs cargo build on a clean machine 30 times a day adds 30 downloads a day; one person who installs your crate once and keeps it in their local cache adds one, ever.
So what is actually inside a small crate's number? Below is a fresh measurement on a real portfolio, the script that pulls it (copy it and run it on your own crates), and how to read your own chart without lying to yourself in either direction.
Where the 69 crates came from
Some context, because the shape of the data comes straight from how these crates were published. I maintain a pile of Rust libraries and tools: fin-primitives (trading building blocks), tokio-prompt-orchestrator (an LLM proxy with dedup and a circuit breaker), proof-engine (an OpenGL game engine), and CoreScout, an MCP server split into a workspace of 33 crates.
They went out in three bursts: 51 versions in March 2026, 116 in September and 68 in October, 235 versions in total. The October burst was one big release run on October 4, after a pass where AI coding agents upgraded every crate and I published everything at the end in one go. That single day matters a lot later.
All-time total when I pulled it at 7:10 AM ET on October 17: 4,815 downloads. The crates.io "recent downloads" figure (last 90 days) was 3,677. My goal for these crates is 100,000, so the honest question is how much of the 4,815 is people.
Pull the numbers yourself in 40 lines
crates.io has a public JSON API. It isn't formally versioned, but it's what the website itself calls, and the data access policy asks for two things: at most one request per second, and a User-Agent that says who you are. Three endpoints give you everything:
/api/v1/crates?user_id=N: every crate a user owns, with all-time and 90-day totals./api/v1/crates/<name>/downloads: daily downloads for the last 90 days, split by version (older versions are lumped intoextra_downloads)./api/v1/crates/<name>/reverse_dependencies: which published crates depend on this one.
This is the script I ran this morning (pull.py, trimmed only of the JSON field picking). It stops dead on a 429 instead of retrying, because a polite scraper doesn't argue with a rate limit:
UA = "tensorust-deepdive-research (contact: hello@tensorust.com)"
last = [0.0]

def get(path):
    wait = 1.05 - (time.time() - last[0])   # stay under 1 request/second
    if wait > 0:
        time.sleep(wait)
    last[0] = time.time()
    req = urllib.request.Request("https://crates.io" + path, headers={"User-Agent": UA})
    try:
        with urllib.request.urlopen(req, timeout=30) as r:
            return json.load(r)
    except urllib.error.HTTPError as e:
        if e.code == 429:
            print("429 - stopping"); sys.exit(2)
        raise

user = get("/api/v1/users/mattbusel")["user"]
crates = get(f"/api/v1/crates?user_id={user['id']}&per_page=100")["crates"]
for c in crates:
    n = c["name"]
    dl = get(f"/api/v1/crates/{n}/downloads")
    vers = get(f"/api/v1/crates/{n}/versions?per_page=100")
    rev = get(f"/api/v1/crates/{n}/reverse_dependencies?per_page=100")
    # ... store dl["version_downloads"], dl["meta"]["extra_downloads"], versions, rev
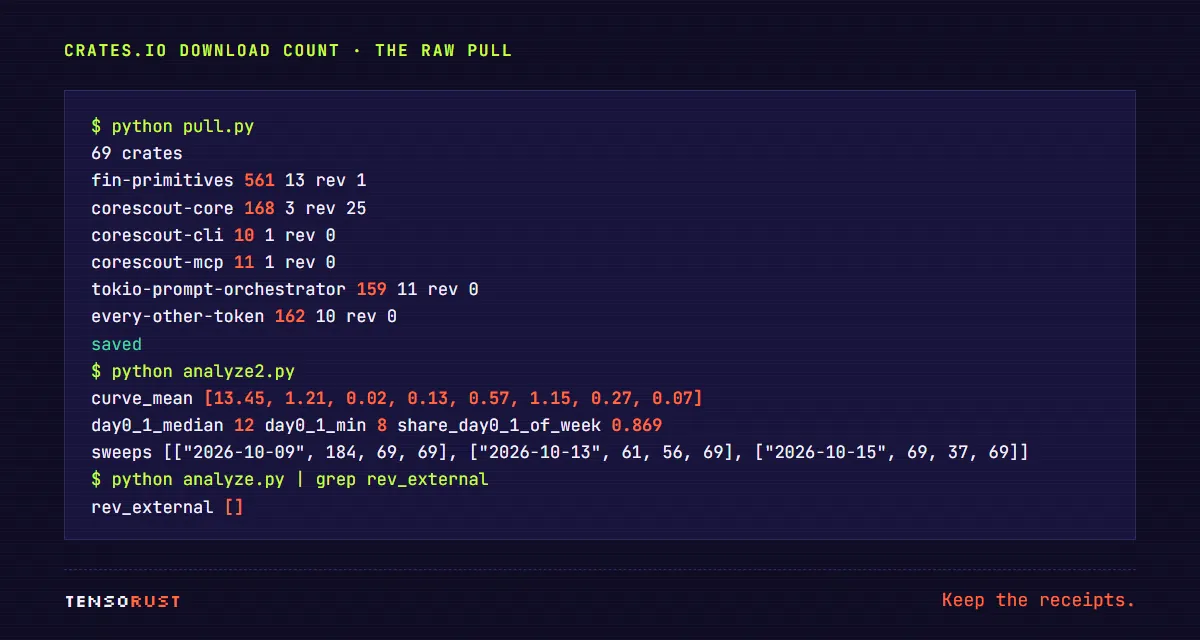
69 crates times three calls, one per second, took about three and a half minutes. Then a second pass of 69 calls to map version ids to version numbers and publish times, because the downloads endpoint labels each row with a numeric version id, not "2.15.0".
If you have more than a few hundred crates (or you want every crate on the registry), don't hammer the API: crates.io publishes a database dump every 24 hours (static.crates.io/db-dump.tar.gz) that includes the per-day, per-version download table for the last 90 days.
What the crates.io page shows you
Here's the bottom of the fin-primitives page, which is my most-downloaded crate. Look at the chart before reading the numbers: a low wiggle of 0 to 3 a day through the summer, then tall spikes in the last week of September and the first week of October, each spike a different color. Each color is a version.
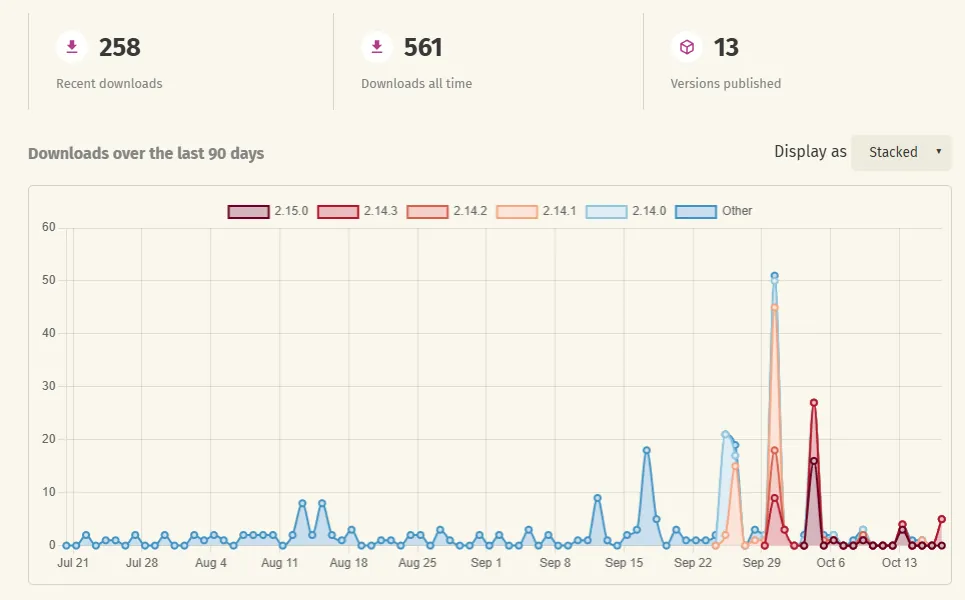
That chart is honest, but it's per crate. With 69 crates you can't eyeball 69 charts, so I classified every crate-day in the 90-day window into three buckets.
The three kinds of download day
The rule is simple and fully mechanical:
- Publish window: that crate published a version on this UTC day or the day before.
- Sweep day: no publish, but at least half of all my crates that existed got downloaded on the same day.
- Quiet: everything else.
The core of the classifier, from analyze.py:
for n, c in C.items():
    for v in c['downloads']['version_downloads'] + c['downloads']['meta']['extra_downloads']:
        d = dt.date.fromisoformat(v['date'])
        if any(0 <= (d - p).days <= 1 for p in pub[n]):
            cat[v['date']][0] += v['downloads']      # publish window
        elif v['date'] in sweeps:
            cat[v['date']][1] += v['downloads']      # sweep day
        else:
            cat[v['date']][2] += v['downloads']      # quiet

And the result over July 20 to October 16, 2026 (89 full UTC days, 3,676 downloads):
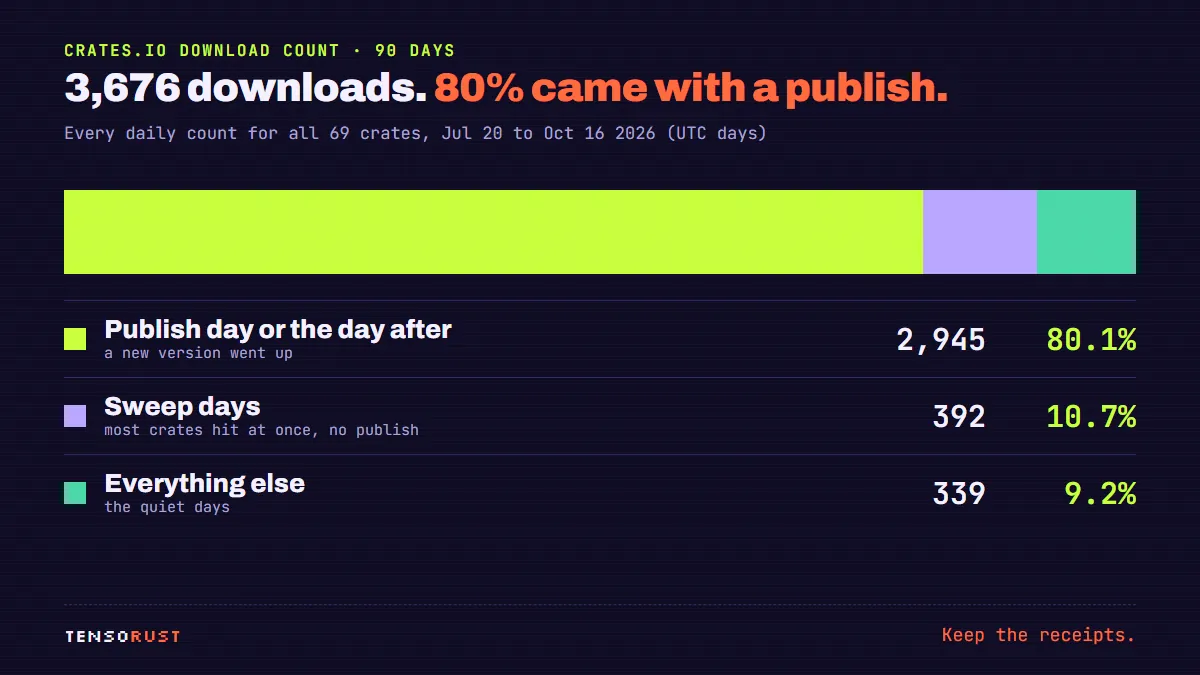
2,945 downloads (80.1%) came in a publish window. 392 (10.7%) came on six sweep days. 339 (9.2%) were quiet-day downloads. The biggest single day was October 4, the release run: 68 versions published, 1,195 downloads.
Put another way: if I had never published those September and October versions, the 90-day number would have been somewhere around 730, not 3,676.
A new version gets about 13 downloads, then nothing
To see what a publish is worth on its own, I took every version published inside the window with at least a week of data after it (181 versions) and lined up its downloads by days since publish.
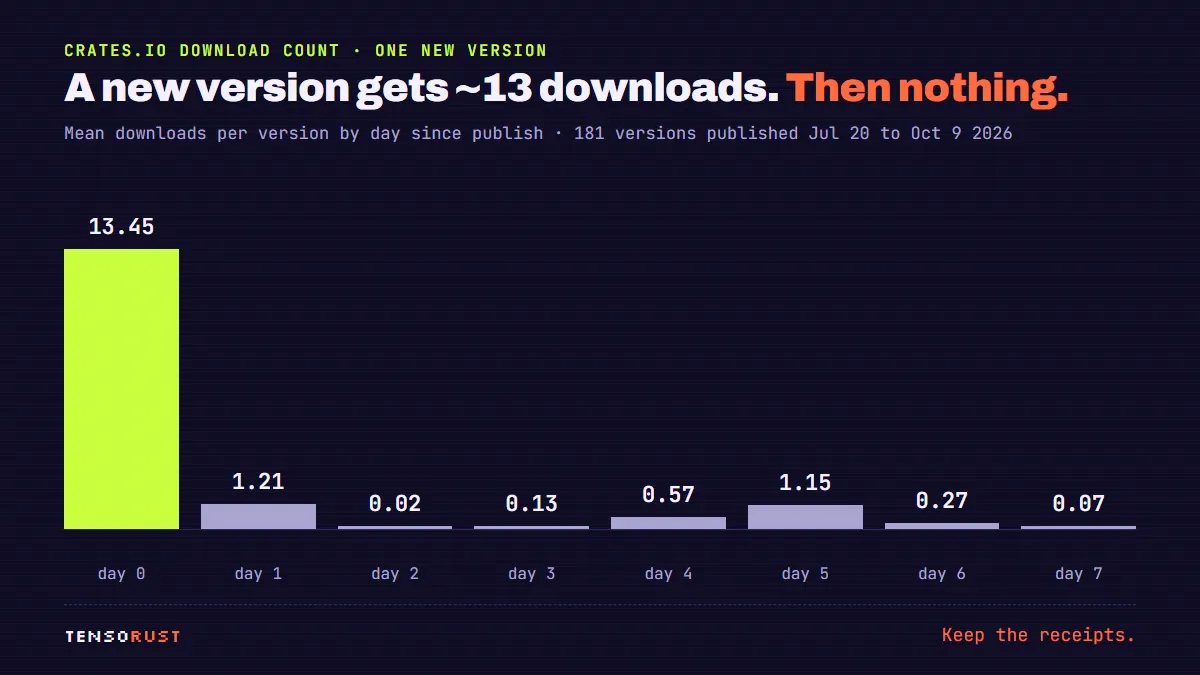
Mean downloads on day 0: 13.45 (median 10). Day 1: 1.21. Day 2: 0.02. 86.9% of a version's first-week downloads arrive on day 0 or day 1. The smallest day-0-plus-day-1 total for any version was 8, the largest 66, the median 12.
The floor is the tell. Across all 235 versions ever published, the lowest all-time count for a single version is 9. The median is 18. I have 19 crates that have only ever had one version, including internal plumbing crates like corescout-cli and corescout-lineage that nobody outside this project has a reason to know about. Their all-time totals run from 10 to 28, median 15. Something fetches every new version within hours of publish, whether or not a human ever reads the README.
What is that something? The data can't say. My guess, and it's a guess: registry mirrors and build farms that follow the crates.io index and fetch new versions as they appear, plus security and license scanners. The 2025 user-agent filter was written to drop mirrors, so whatever survives it is either cargo itself or a client that sends no user agent. docs.rs also builds documentation for every new version automatically; I couldn't confirm from public docs whether its fetch is counted, so I'm not claiming it is.
The consequence is very practical: on crates.io, the number of versions you publish predicts your downloads better than anything about the code. Across my 69 crates, the correlation between version count and all-time downloads is 0.82. That's why fin-primitives (13 versions) leads and my genuinely more interesting crates trail it.
Sweep days: when every crate gets hit at once
The second bucket surprised me more. On October 9 nothing was published, yet all 69 crates got downloaded on the same day, 184 downloads in total. October 13: 56 of 69 crates, mostly one download each. That's not a person. A person installs one tool and its dependency tree, not a stats crate, a trading crate, a game engine and a TFT advisor in the same afternoon.
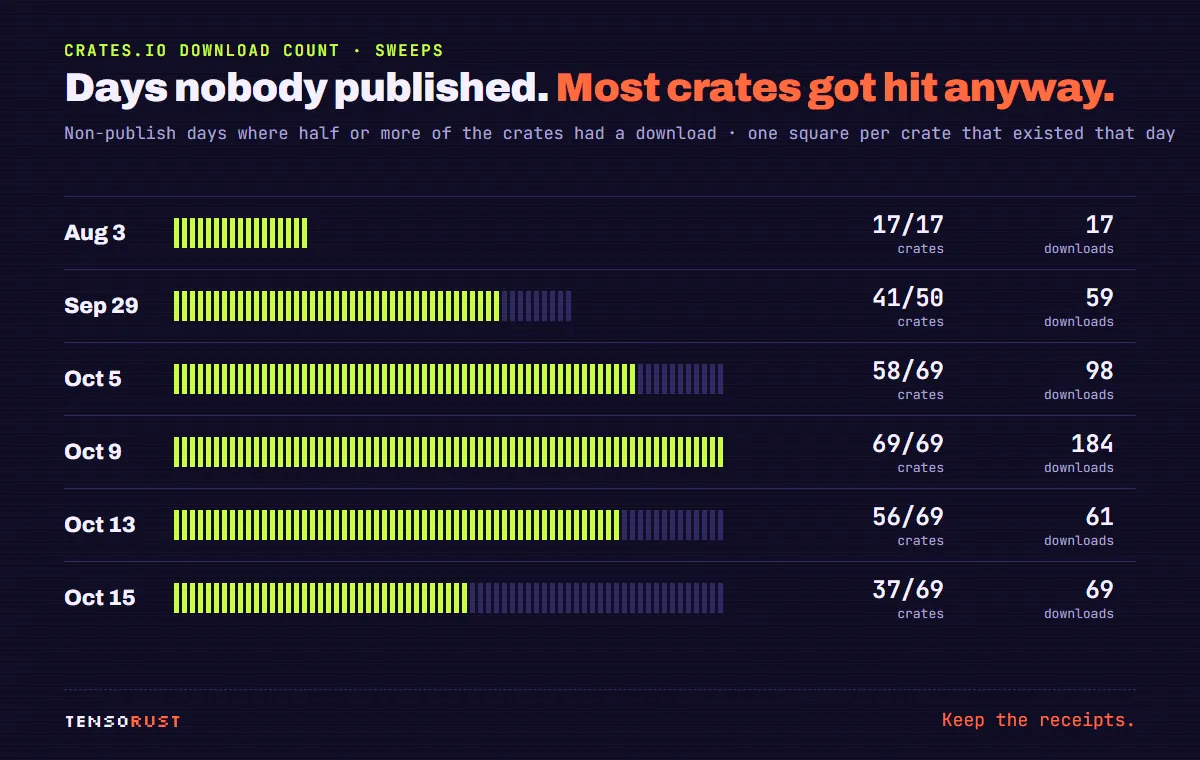
Six days in the window match the pattern: August 3 (17 of 17 crates that existed then), September 29, October 5, 9, 13 and 15. Some of the later ones lean toward the CoreScout family: on October 6 and 15 the top crates were corescout-core, corescout-mirror and corescout-memory, which is exactly what you'd see if something resolved the dependency tree of a CoreScout binary. That brings up the multiplier nobody mentions.
Workspaces multiply the count
CoreScout is a Cargo workspace, and when you publish a workspace to crates.io, every member becomes its own crate. Here's the real root Cargo.toml (excerpt):
corescout-core = { version = "1.2.0", path = "crates/core" }
corescout-mirror = { version = "1.2.0", path = "crates/mirror" }
corescout-substrate = { version = "1.2.0", path = "crates/substrate" }
corescout-memory = { version = "1.2.0", path = "crates/memory" }
corescout-represent = { version = "1.2.0", path = "crates/represent" }
corescout-science = { version = "1.2.0", path = "crates/science" }
corescout-core has 25 dependents, all of them its own siblings. By the reverse-dependency data, corescout-mcp has 16 of my other crates somewhere in its dependency tree, so one cargo install corescout-mcp on a clean machine should show up as up to 17 downloads spread over 17 crate pages. Across all 69 crates, the reverse-dependency API lists 178 dependent versions, and every one of them is mine.
That's the cruel bit. The crates with the most dependents look the most "used" (11 crates with five or more dependents had a median of 6 quiet downloads; the 25 crates with no dependents had a median of zero in 89 days) and it's entirely my own wiring.
The quiet baseline: the only number that means people
Strip the publish windows and the sweeps and you're left with 339 downloads in 89 days, about 3.8 a day across all 69 crates. That's the closest thing to "someone, somewhere, built with my code today." It isn't zero, and it's been rising: the portfolio averaged 1.7 quiet downloads a day in late July, 3.4 in August, 2.8 in September and 8.1 in the first half of October (with far more crates, so treat October with care).
One crate does most of the work. fin-primitives alone is 128 of the 339 quiet downloads (38%), one or two on most days since July, long before this autumn's release pile. My bet is that a handful of people or one CI pipeline builds against it regularly. That's a real signal, and it's exactly what a "publish-day bots" dismissal would throw away along with the noise.
And the number that settles every argument: external reverse dependencies, 0. No published crate outside my own uses any of the 69. The ecosyste.ms crates.io index is a good second source for this, since it also tracks repositories that depend on a crate without publishing one.
Do this with your own crates
- Read your number as three numbers. Publish-window, sweep and quiet. Run the classifier above (or just look at the per-version colors on your crate page); only the quiet line is about users.
- Expect about 10 to 15 downloads per version for free. If a brand-new crate shows 12 downloads on day one, nobody has found it yet, and that's fine. If it shows 12 on a random Tuesday three weeks later, somebody probably has.
- Don't release to pump the count. It works (we just measured it working), which is exactly why the count can't be trusted as a popularity number, and why anyone evaluating your crate will look at dependents and recent activity instead.
- Count dependents, not downloads. crates.io's Dependents tab, the reverse-dependency API and GitHub's "Used by" are where real adoption shows. One crate in someone else's dependency tree is worth more than a thousand publish-day fetches, because every one of their CI runs downloads yours too, forever.
- Know that a workspace inflates by its width. Splitting one tool into 30 crates makes every install look like 30 downloads. Report the binary crate's number if you want an honest headline.
- Re-pull on a schedule. The API only keeps 90 days of daily data per crate. If you want a trend, save the JSON every month; once a day falls out of the window, the per-day split is gone for good.
The numbers, all of them
| Measure (crates.io API, pulled Oct 17 2026, 7:10 AM ET) | Value |
|---|---|
| Crates / versions | 69 / 235 |
| All-time downloads | 4,815 |
| Downloads Jul 20 to Oct 16 (89 days) | 3,676 |
| In a publish window | 2,945 (80.1%) |
| On sweep days | 392 (10.7%) |
| Quiet | 339 (9.2%), 3.8/day |
| Downloads per new version, day 0 (mean / median) | 13.45 / 10 |
| Share of first-week downloads on day 0 or 1 | 86.9% |
| Lowest all-time count of any version | 9 |
| Correlation, versions vs downloads | 0.82 |
| External reverse dependencies | 0 |
For the record, this isn't a "downloads are fake" post. The counting rules are public and reasonable, and the quiet baseline is real and growing. It's a "know which part of the number you're looking at" post. The next milestone I care about isn't 10,000 downloads, it's the first crate with an outside dependent. I'll pull this again in 30 days and publish the diff.
If you maintain crates: what does your quiet-day baseline look like next to your total? I'd genuinely like to know whether 80% publish-window is normal for small crates or whether my release habits made it worse.
More from the same projects: the semantic cache inside tokio-prompt-orchestrator, running 20 coding agents on one PC (the agents that upgraded these crates), and Bevy instancing at 639,000 units.
First published here on tensorust.com on Oct 17, 2026. Also on dev.to. Related: All 69 crates on crates.io, Tools for running coding agents, The semantic cache in tokio-prompt-orchestrator.
Get the next one by email.
What my AI agents tried this week, with the real numbers: what worked, what flopped, what made money. One email when there is something worth reading.
No spam, never sold. Every email has a one-click unsubscribe.
Read next
- Dev · Oct 16, 2026 · 12 min readBevy instancing: drawing 639,000 units with one draw call per mesh
- Dev · Oct 10, 2026 · 1 min readMy Windows wallpaper solves the geodesic equation, live
- AI · Oct 10, 2026 · 2 min readI ran 20 AI coding agents on one PC. The bottleneck was the compiler.