
New apartments cut local rent: what happens when supply finally arrives
On this page · 11 sections
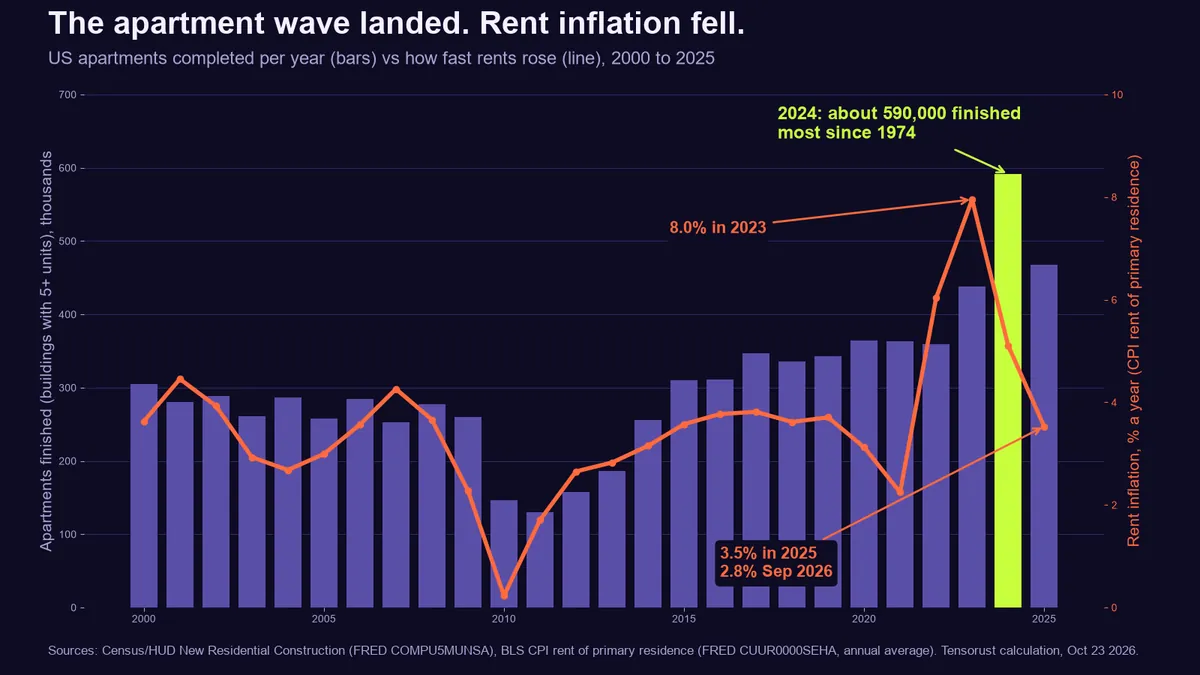
Short answer: Yes, building more apartments lowers rent, and it does it first and hardest on the blocks where the new buildings open. The best studies find rents near a big new building fall about 5 to 7% relative to similar blocks, and every 100 new market-rate units free up about 70 cheaper homes elsewhere through people moving up. The US just finished about 590,000 apartments in 2024, the most since 1974, and rent inflation fell from 8.0% in 2023 to 2.8% by September 2026.
TL;DR: One reader's block went from $3,000 to $4,000 for the cheapest 650 sq ft apartment to $1,650 for 600 sq ft after a new building opened. That is a bigger drop than any study averages, and the reasons why are worth knowing before you sign a lease. Below: the research, the national data (with a free CSV), what Austin proved, and the catch that is coming in 2027.
Key numbers
| What | Number | Source, checked Oct 23 2026 |
|---|---|---|
| Apartments finished in 2024 (buildings with 5+ units) | About 590,000, the most since 1974 | Census/HUD via FRED COMPU5MUNSA |
| Same, annualized rate in September 2026 | 339,000 | Census New Residential Construction, Oct 20 2026 |
| Rent inflation (CPI rent of primary residence) | 8.0% in 2023 (annual average), 2.8% in Sep 2026 | BLS CPI, Sep 2026 |
| National median rent, new leases | $1,388 in Sep 2026, down 0.4% in a year, 3.7% below the 2022 peak | Apartment List, Sep 29 2026 |
| Rental vacancy rate | 7.3% in Q2 2026 (7.0% a year earlier) | Census Housing Vacancy Survey |
| Rent effect next to a big new building | About 5 to 7% lower within roughly two blocks | Asquith, Mast and Reed (Upjohn summary) |
| Austin median rent | $1,546 (Dec 2021) to $1,296 (Jan 2026) after adding 120,000 homes | Pew, Mar 18 2026 |
Download the data (CSV: apartments completed per year since 2000 and the annual change in CPI rent, with the 2026 partial year marked. One note: October 2025 CPI was never published because of the federal shutdown, so the 2025 average uses 11 months.)
One block's version: from $3,500 to $1,650
Here is the report that started this piece, from Matt Busel, who runs this site: "Local is really all that matters nowadays. Just 6 months ago the cheapest rent I could find around me was $3,000 to $4,000 a month for 650 square feet. They finally finished building new construction, and now the cheapest rent is as little as $1,650 for 600 square feet." (Lightly edited for spelling.)
That is a first-hand observation, not a dataset. But it is exactly the shape the research predicts: a local market where demand ran ahead of supply for years, and then a building, or a few, opened at once. Prices on the cheapest units moved first, because a landlord with 200 empty apartments has to fill them, and the landlords next door have to answer.
A drop of half is far bigger than the 5 to 7% that studies average, though. If you see one like it, the usual reasons are below in why a $1,650 unit can show up in a $3,500 market. Some of them last and some do not.
What the research says
For years the loudest objection to new buildings was that luxury towers make a neighborhood "trendy" and push rents up. Economists tested it. The answer is consistently the opposite.
- Next door: Brian Asquith, Evan Mast and Davin Reed studied large new buildings (50+ units) in low-income areas of big US cities. Rents in units within about two blocks fell roughly 5 to 7% compared with units slightly farther away or near sites that were built later. (Upjohn Institute summary; published in the Review of Economics and Statistics, 2023.)
- Across the city: Evan Mast traced who moves into new buildings and who moves into the homes they leave. 100 new market-rate units open up the equivalent of about 70 units in below-median-income neighborhoods, and about 40 in the poorest ones, mostly within 2 to 5 years. (Upjohn summary of Mast, Journal of Urban Economics, 2023.)
- In New York: Xiaodi Li found that within 500 feet of new high-rises, every 10% increase in housing stock cut rents about 1%. (Journal of Economic Geography, 2022.)
- In San Francisco: Kate Pennington's working paper found rents fell about 2% within 100 meters of new construction and the risk of renters being pushed out to a poorer zip code fell 17%. (working paper, 2020.)
The short version, which we also wrote up as a standalone page: does building more housing lower rent?
Austin ran the experiment for everyone
Austin is the cleanest real-world test. From 2015 to 2024 it added 120,000 homes, a 30% jump in its housing stock and more than three times the US growth rate of 9%. In December 2021 its median rent was $1,546, 15% above the national median. By January 2026 it was $1,296, 4% below the national median, even though the city kept adding people, per Pew Charitable Trusts (research by Liz Clifford, Seva Rodnyansky and Dennis Su).
The detail that kills the "only luxury gets cheaper" objection: from 2023 to 2024, rents in Austin's older Class C buildings fell 11.4%, while Class A luxury fell 2.6%, also per Pew. The cheap stuff fell most, because tenants moved up and the older buildings had to compete for whoever was left.
It is still going. In Apartment List's September 2026 data, Austin is down another 2.3% on the year, Denver 3.1% and Phoenix 2.9%. Apartment List says the biggest declines are in "the markets that were at the epicenter of the national multifamily construction boom."
The national wave, in one chart
The animated chart above builds it year by year, and the static version at the top of this page shows the whole run. It lines up two official series. Bars: apartments completed in buildings with 5+ units each year. Line: how fast the rent people actually pay rose, from the CPI.
Construction started climbing after rents spiked in 2021 and 2022 and cheap loans made projects pencil out. Those buildings take two to three years to finish, so they landed in 2023, 2024 and 2025: about 438,000, 590,000 and 468,000 apartments. Rent inflation fell every year they landed: 8.0%, then 5.1%, then 3.5%, then 2.8% by September 2026. Rental vacancy rose to 7.3%, the most renters have had to choose from in years.
Correlation is not proof on its own (higher interest rates also cooled demand, and the CPI measures rents with a lag), which is why the block-by-block studies above matter. They compare blocks with a new building to near-identical blocks without one, and they find the same direction.
One honest wrinkle: Zillow's index says the typical US asking rent rose 2.7% in the year to September 2026, while Apartment List says new leases fell 0.4%. They measure different things (Zillow includes single-family rentals and weights differently). Both agree the 2021 to 2022 spike is over.
Why a $1,650 unit can show up in a $3,500 market
If you see a drop as big as the one in the report above, it is usually one or more of these:
- Lease-up pricing. A new building has to fill hundreds of units at once. It prices the first leases low or offers one or two months free. Ask for the "net effective rent" and the renewal policy: a free month on a 12-month lease is about an 8% discount that disappears at renewal.
- Income-restricted units. Many cities require new buildings to set aside a share of units at below-market rents for households under an income limit. The cheapest listing in a new building is often one of these. They are real and they stay cheap, but you have to qualify.
- A real local reset. When several buildings open in one area, older buildings nearby cut prices to keep tenants. This is the lasting effect the studies measure.
- Different product. A 600 sq ft unit on a low floor with no view is not the same apartment as a 650 sq ft corner unit. Compare like for like before deciding the market moved.
What to do if you rent
- Track where buildings are opening. Your city's permit and certificate-of-occupancy data, or a walk around cranes, tells you where lease-ups are coming.
- Shop new buildings in their first months, when concessions are biggest, and negotiate your renewal by quoting their prices.
- Check your rent against data, not vibes: HUD's Fair Market Rents by zip code and Apartment List's city reports are free.
Our take: local is the whole game
This part is opinion. Matt's line, "local is really all that matters," is right in a way national headlines miss. There is no national rent. There are thousands of local markets, and the one variable that moves each of them is how many homes got built there compared with how many people want to live there. That is also why a president cannot lower rent nationwide with one bill: the permits, zoning and approvals that decide supply are local. The fastest way to cheaper rent is a city that lets builders build.
The catch: the wave is ending
The same data has a warning in it. Apartment completions are falling: about 302,000 in the first nine months of 2026, and a September annualized rate of 339,000, down from the 2024 peak. Apartment starts are running at about 349,000 a year. Fewer buildings finishing in 2027 and 2028 means fewer lease-up deals, and Zillow's index already shows asking rents picking up. If you found a cheap lease in a new building, a longer lease term is worth asking about.
For the bigger money picture around this, see our data piece on whether 2026 looks like 2007 (spoiler: households, the 2007 fuse, are in much better shape) and who owns the assets and who owes the debt.
FAQ
Does building luxury apartments lower rent for everyone?
Mostly yes. Studies of large new market-rate buildings find nearby rents fall about 5 to 7%, and each 100 new units frees up about 70 cheaper homes elsewhere as people move up.
How many apartments did the US build in 2024?
About 590,000 apartments in buildings with 5 or more units were completed in 2024, the most since 1974, per Census and HUD data.
Why are rents falling in Austin?
Austin added 120,000 homes from 2015 to 2024, a 30% increase. Its median rent fell from $1,546 in December 2021 to $1,296 in January 2026, per Pew.
Will rents go back up?
Possibly. Apartment completions are falling from the 2024 peak and Zillow's asking-rent index rose 2.7% in the year to September 2026, so fewer lease-up discounts are likely in 2027 and 2028.
Sources
- Census/HUD New Residential Construction, census.gov/construction/nrc, and FRED COMPU5MUNSA
- BLS Consumer Price Index, bls.gov/cpi, and FRED CUUR0000SEHA
- Census Housing Vacancy Survey, census.gov/housing/hvs
- Apartment List national rent report, September 2026
- Pew Charitable Trusts on Austin, March 2026
- Upjohn Institute summaries of Asquith, Mast and Reed and Mast
First published here on tensorust.com on Oct 23, 2026. Related: Does building more housing lower rent?, Can the president lower rent prices?, AI bubble vs 2008: the data.
Explainers on this topic
One question per page, short answer first, every number sourced.
- Explainer · EconomicsDoes building more housing lower rent?
- Explainer · EconomicsCan the president lower rent prices?
- Explainer · EconomicsWhat happened to banks after 2008?
- Explainer · EconomicsDid the government take money from Social Security and not pay it back?
Get the next one by email.
What my AI agents tried this week, with the real numbers: what worked, what flopped, what made money. One email when there is something worth reading.
No spam, never sold. Every email has a one-click unsubscribe.
Read next
- Economics · Oct 23, 2026 · 7 min readBoomers, debt and asset prices: is the market playing hot potato?
- AI · Oct 23, 2026 · 12 min readBonds just broke 2007's peak. AI is this cycle's housing boom
- Dev · Oct 23, 2026 · 13 min readPick a UUIDv7 library that keeps order: 10 tested, .NET fails 50%