
Boomers, debt and asset prices: is the market playing hot potato?
On this page · 9 sections
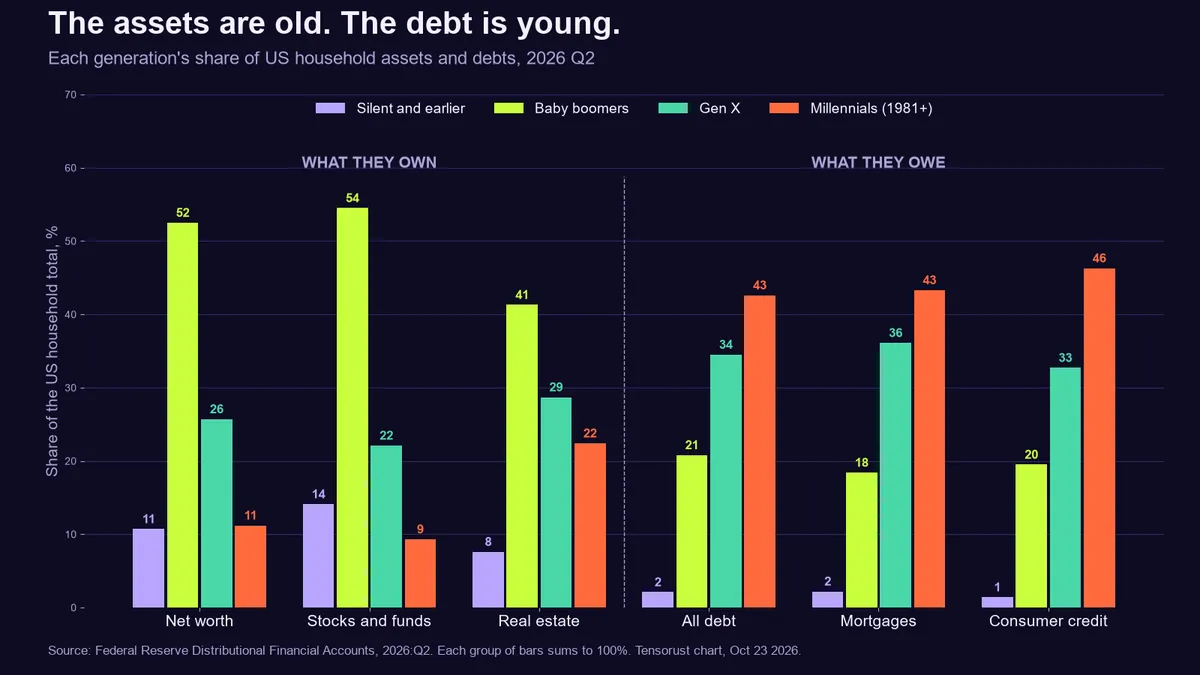
Short answer: Baby boomers own 52.5% of all US household net worth, about $97.4 trillion, and 54.5% of the stocks and mutual funds, per the Federal Reserve's newest data (Q2 2026). Millennials, the biggest adult generation, own 11.2%. But the debt runs the other way: boomers owe only 20.8% of household debt, and millennials owe 42.6%. So the "hot potato" is real, just not the way it is usually told. The assets sit with the old, the debt sits with the young, and if AI's circular deals unwind, the people holding the bag are mostly the ones who own the stocks.
TL;DR: We pulled the Fed's Distributional Financial Accounts back to 1989 and lined up who owns what against who owes what. Below: the data (free CSV), what the AI "circular financing" deals actually are, what the numbers support in the hot-potato thesis and what is still speculation. This is a read of public data, not financial advice, and nothing here is a call to buy or sell anything.
Key numbers
| What | Number | Source, checked Oct 23 2026 |
|---|---|---|
| Boomers' share of household net worth | 52.5% ($97.4T of about $185.7T), Q2 2026 | Fed Distributional Financial Accounts |
| Boomers' peak share | 57.6% in Q3 2016 | same |
| Millennials' share (born 1981 or later) | 11.2% of net worth, 42.6% of all household debt | same |
| Boomers' share of debt | 20.8% of liabilities, 18.4% of mortgages | same |
| Boomers' share of stocks and funds | 54.5% ($35.2T) | same |
| Total household debt | $18.8T in Q2 2026, 4.7% of it delinquent | New York Fed, Aug 11 2026 |
| Median first-time home buyer age | 40, a record; first-time buyers 21% of sales | NAR 2025 profile |
| Wealth set to pass to heirs and charity by 2048 | $124T, about $100T of it from boomers and older | Cerulli, Dec 2024 |
Download the data (CSV: every quarter from Q3 1989 to Q2 2026 for each generation, with shares of net worth, debt, stocks, real estate and mortgages, plus dollar levels in millions. Straight from the Fed's DFA files, one row per generation per quarter.)
The thesis
This piece starts from Matt Busel's view, quoted as he wrote it and labeled as opinion: "The markets can't sustain without every generation being able to participate. That's why right now you have a lot of this circular financing going on. It's just boomers playing hot potato with assets and debt that isn't worth [anything] to try to make the last buck without it exploding on them. Once that's over, things can actually be priced to what the people can afford, not what some random 75-year-old wants for it." (Lightly edited for spelling; brackets mark a changed word.)
That is three claims stacked together: (1) ownership is concentrated in one generation, (2) prices are being held up by financing that loops back on itself, and (3) when the older owners exit, prices reset lower. Here is what the data says about each.
Claim 1: one generation owns the market. Supported.
The animated chart below is the Fed's own breakdown, quarter by quarter since 1989. Boomers passed half of US household wealth around 2009, peaked at 57.6% in 2016, and still hold 52.5%. They own 54.5% of directly and indirectly held stocks and funds and 41.3% of owner-occupied real estate.
Millennials, born 1981 or later in the Fed's split, are the largest adult generation and hold 11.2%. Some of that gap is just age: wealth builds over a lifetime. But the home-buying data shows the ladder getting longer. The median first-time buyer was 40 in the National Association of Realtors' 2025 profile, and first-time buyers were a record-low 21% of purchases. (NAR's survey had a 3.5% response rate, and mortgage data puts the median first-time buyer nearer 32, so treat the 40 as a direction, not gospel.)
Claim 2: they are passing the debt around. The data says the opposite.
This is where the thesis breaks, and the break is the most interesting part (it is the chart at the top of this page). If boomers were dumping debt on the market, they would hold it. They do not. Boomers owe 20.8% of household debt and 18.4% of mortgages. Gen X owes 34.5%. Millennials owe 42.6% of all household debt, 43.3% of mortgages and 46.3% of consumer credit.
So the young own the debt and the old own the assets. That is the real "hot potato," and it runs through housing: a 35-year-old buying a home borrows heavily to buy it, often from someone older who bought it for far less. The New York Fed's numbers show the strain: $18.8 trillion of household debt, with 7.83% of student loan balances and 6.97% of credit card balances moving into serious delinquency (annualized, Q2 2026).
Claim 3: AI is running on circular financing. Partly supported.
"Circular financing" means a supplier invests in its own customer, and the customer spends the money back on the supplier. The AI build-out has several deals that fit that description, all public:
- Nvidia and OpenAI. In September 2025 Nvidia said it intended to invest up to $100 billion in OpenAI "as the new NVIDIA systems are deployed" (Nvidia). By February 2026, Reuters reported Nvidia was close to finalizing a $30 billion investment that would replace that commitment. The $100 billion never closed as announced.
- AMD and OpenAI. In October 2025 OpenAI agreed to deploy 6 gigawatts of AMD chips, and AMD gave OpenAI a warrant for up to 160 million AMD shares that vests as the chips are deployed and as AMD's share price hits targets (AMD). The customer gets paid in supplier stock for buying from the supplier.
- Nvidia and CoreWeave. Nvidia is an investor in CoreWeave, a cloud company that buys Nvidia chips. A 2025 order commits Nvidia to buy CoreWeave's unsold capacity through 2032, and in January 2026 Nvidia bought another $2 billion of CoreWeave stock (CoreWeave SEC filing).
- Oracle and OpenAI. A reported roughly $300 billion, five-year compute contract starting in 2027, which Oracle is borrowing heavily to build for (DCD, citing the WSJ).
What the data supports: some AI revenue is being financed by the seller, which flatters growth numbers the way vendor financing did in the 2000 telecom bubble. It is also the kind of loop that sits outside the bank rules written after the last crash; see what happened to banks after 2008. Our 2007 vs now data piece found the biggest tech companies now spend 79% of their operating cash flow on capital spending, up from 45% three years ago.
What it does not support: that boomers are running these deals. They are run by companies and funded by corporate cash, bonds and private credit. Boomers come into it as owners. They hold 54.5% of the stocks, so if the loop breaks, they take the largest share of the loss. That is the opposite of getting out clean.
Claim 4: when they exit, prices reset. Speculation, with a twist.
This is the part nobody can prove yet, so here it is framed as what might happen. Cerulli estimates $124 trillion will change hands by 2048, about $100 trillion of it from boomers and older. Most of that moves by inheritance, not by sale. A house left to a child is not sold into the market at a discount, so a big wave of forced selling is not the base case.
Where the reset argument has teeth is housing supply. Older owners who stay in large homes keep them off the market, and when that generation does move or pass, more homes come up for sale in the places they live. Combine that with the apartment wave in our new apartments and rent piece and local prices can fall, as they already did in Austin. A nationwide crash in what "some random 75-year-old wants for it" is a possibility, not a forecast the data makes.
Our take
Opinion, Matt's and ours: the participation point is the strongest part of this. A market where the median first-time buyer is 40 and the youngest adults hold 11% of the wealth but 43% of the debt has a demand problem baked in. Prices that only one generation can pay are prices that eventually need that generation's heirs to keep paying them. Where we would change the story is the villain. It is not boomers juggling debt. It is a system where assets compound for whoever already owns them and the cost of getting in, a mortgage at 2026 rates, falls on whoever does not.
If you want the federal side of the same story (who pays the taxes, what the debt costs, what is really in the Social Security trust fund), the explainers below go one question at a time: how interest rates affect the national debt, what share of income tax the bottom 50% pays and did the government take money from Social Security.
FAQ
What percent of wealth do boomers own?
Baby boomers own 52.5% of US household net worth, about $97.4 trillion, as of Q2 2026, per the Federal Reserve's Distributional Financial Accounts. Their peak was 57.6% in 2016.
Which generation has the most debt?
Millennials (born 1981 or later in the Fed's data) hold 42.6% of US household debt, Gen X 34.5% and boomers 20.8%, as of Q2 2026.
What is circular financing in AI?
A supplier invests in or pays its customer, and the customer spends that money back on the supplier. Examples: Nvidia's investment in OpenAI, AMD's share warrants for OpenAI and Nvidia's capacity backstop for CoreWeave.
Will the great wealth transfer lower home prices?
Not automatically. Most of the estimated $124 trillion passes by inheritance rather than sale. More homes may come up for sale where older owners live, which can lower local prices.
Sources
- Federal Reserve Distributional Financial Accounts, generation tables through 2026:Q2
- New York Fed Household Debt and Credit Report, Q2 2026
- NAR Profile of Home Buyers and Sellers 2025
- Cerulli Associates, Dec 2024
- Company releases: Nvidia, AMD, CoreWeave; Reuters (Feb 19 2026) on the revised Nvidia investment
First published here on tensorust.com on Oct 23, 2026. Related: How interest rates affect the national debt, Did the government take Social Security money?, AI bubble vs 2008: the data.
Explainers on this topic
One question per page, short answer first, every number sourced.
- Explainer · EconomicsWhat happened to banks after 2008?
- Explainer · EconomicsDid the government take money from Social Security and not pay it back?
- Explainer · EconomicsWhat percent of federal income tax does the bottom 50% pay?
- Explainer · EconomicsHow do interest rates affect the national debt?
Get the next one by email.
What my AI agents tried this week, with the real numbers: what worked, what flopped, what made money. One email when there is something worth reading.
No spam, never sold. Every email has a one-click unsubscribe.
Read next
- AI · Oct 23, 2026 · 12 min readBonds just broke 2007's peak. AI is this cycle's housing boom
- Economics · Oct 23, 2026 · 8 min readNew apartments cut local rent: what happens when supply finally arrives
- AI · Oct 20, 2026 · 11 min readDeepSeek gave away its engine. The $38-an-hour parts stayed home