
What percent of federal income tax does the bottom 50% pay?
Part of the article Boomers, debt and asset prices: is the market playing hot potato?. This page answers one question from it in depth.
On this page · 8 sections
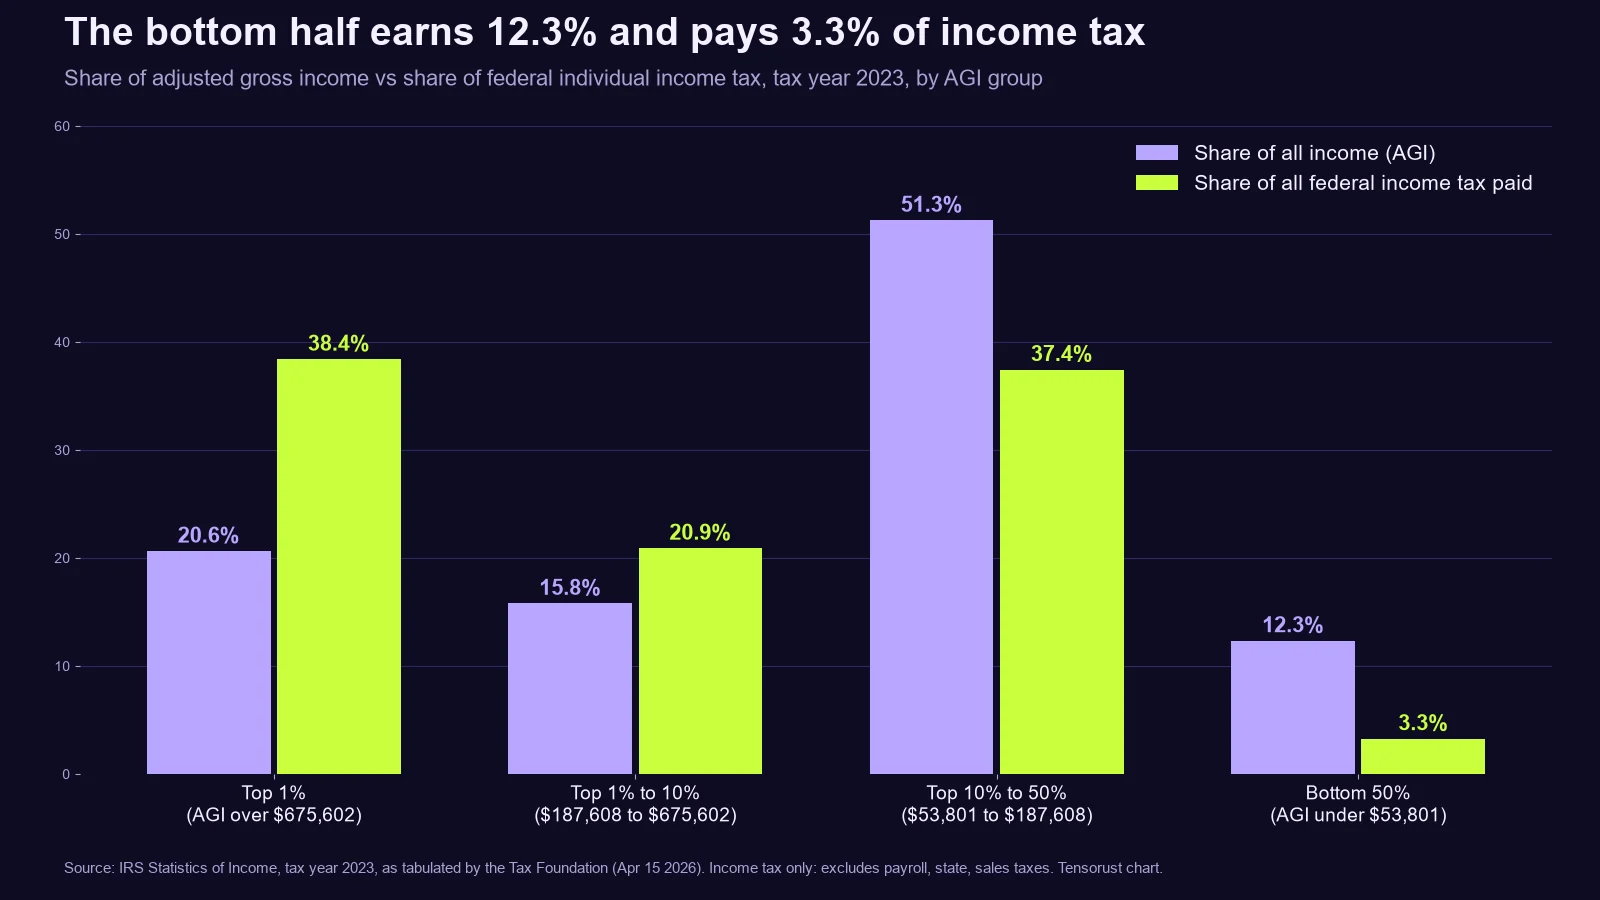
Short answer: The bottom 50% of taxpayers paid about 3.3% of all federal income tax in tax year 2023, roughly $70 billion out of $2.14 trillion, while earning 12.3% of the income. But income tax is not the only tax: the same people pay payroll taxes at a higher rate than top earners, plus state, local and sales taxes. Wiping out their federal income tax would cost about $70 billion a year, around 2.5% of income tax revenue.
Key numbers
| What | Number | Source (checked Oct 23 2026) |
|---|---|---|
| Bottom 50%'s share of federal income tax | 3.3% ($69.9 billion), tax year 2023 | Tax Foundation, from IRS Statistics of Income |
| Bottom 50%'s share of income (AGI) | 12.3% | same |
| Income needed to be in the top half | $53,801 of adjusted gross income | same |
| Bottom 50%'s average income tax rate | 3.7% | same |
| Top 1%'s share of income tax | 38.4% on 20.6% of income (AGI over $675,602) | same |
| Bottom 50% share in 2001 | 4.9% | same |
| Households owing no federal income tax | About 40% (2025 estimate) | Tax Policy Center |
| Payroll tax rate, lowest fifth vs top fifth | 9.5% vs 6.1% of income (2022) | CBO, Distribution of Household Income 2022, via Tax Foundation |
| Federal individual income tax collected, FY2026 | $2,845.5 billion | Monthly Treasury Statement |
The breakdown, by the numbers
The IRS publishes every year's returns sorted by income. For tax year 2023 (the latest, published by the IRS Statistics of Income division and summarized by the Tax Foundation in April 2026):
- 153.1 million returns reported $15.2 trillion of adjusted gross income and paid $2,144 billion in federal income tax.
- The bottom half (AGI under $53,801) reported $1,873 billion of income and paid $69.9 billion, an average rate of 3.7%.
- The top 1% (AGI over $675,602) reported $3,135 billion and paid $823 billion, an average rate of 26.3%.
- The top half paid 96.7% of all federal income tax.
The bottom half's share has been falling for two decades, from 4.9% in 2001 to 3.3% in 2023, in large part as Congress expanded the standard deduction and refundable credits such as the child tax credit.
But they pay other taxes
"Pays 3% of taxes" is only true for one tax. The bottom half pays:
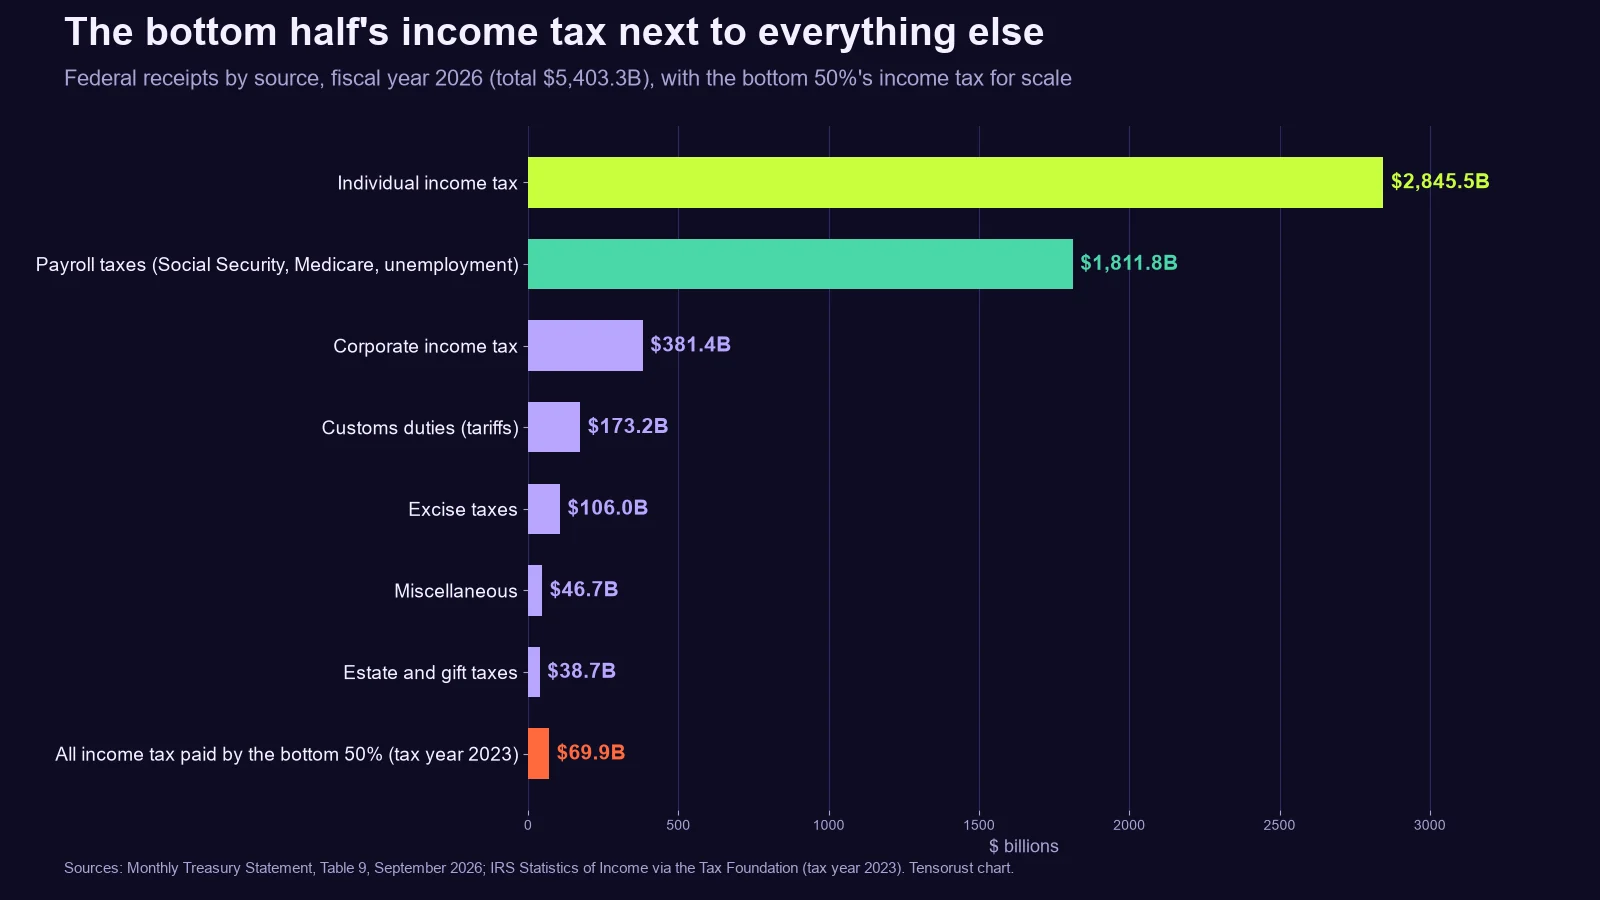
- Payroll taxes. 7.65% of wages for Social Security and Medicare, matched by the employer, starting with the first dollar and with no standard deduction. The Congressional Budget Office finds the lowest fifth of households pays about 9.5% of income in payroll taxes, against 6.1% for the top fifth, because the Social Security tax stops at a wage cap. Payroll taxes raised $1,812 billion in FY2026, 64% as much as the individual income tax.
- State and local income taxes, in most states.
- Sales and excise taxes, which take a bigger share of a smaller paycheck.
Counting all federal taxes, CBO's 2022 figures run from 1.4% of income for the lowest fifth to 23.2% for the top fifth and 31.5% for the top 1%. The lowest fifth's federal income tax rate is actually negative (about minus 10%) because refundable credits such as the Earned Income Tax Credit pay out more than they owe.
What would removing it cost?
This is the idea behind this page, from Matt Busel, who runs this site: "One of the best ideas is to just remove taxes altogether on the bottom 50% of the population, since their tax contribution is only 3% of the nation's. It would be better if they just spent their own money and fueled the economy more."
He is not alone. On CNBC's Squawk Box on May 20 2026, Amazon founder Jeff Bezos proposed the same thing: no federal income tax for anyone under roughly $54,000, the bottom half, and said he would take the idea to the White House (InvestmentNews). It is a proposal, not law.
Worked example, income tax only:
- Static cost: about $70 billion a year in 2023 dollars, what the bottom half paid.
- That is about 2.5% of the $2,845 billion of individual income tax collected in FY2026, and about 3.5% of the FY2026 deficit of $1,992 billion.
- The money would not go evenly. About 40% of households already owe no income tax, so they would get nothing. The savings would go to the upper part of the bottom half, people earning roughly $30,000 to $54,000.
- The cliff problem. If the rule is "the bottom 50% pays zero," a worker at $53,800 pays nothing and one at $53,900 owes full tax on everything. A real version would phase in, for example by raising the standard deduction, which costs more because it also cuts taxes for everyone above the line.
"Taxes altogether" is a different number. Removing payroll taxes for the same people would cost far more and would pull money directly from Social Security and Medicare, which those taxes fund by law. See did the government take money from Social Security? for how those funds work.
Would they spend it? Mostly, yes. Research on the 2008 stimulus checks by Jonathan Parker, Nicholas Souleles, David Johnson and Robert McClelland found households spent 50 to 90% of the payments within months, much of it on cars. Lower-income households spend a larger share of extra money than higher-income ones, which is the case for this idea. The case against: $70 billion a year is borrowed money while the deficit is near $2 trillion, and the interest on it compounds (see how interest rates affect the national debt).
Common misconceptions
- "Half of Americans pay no taxes." About 40% of households owe no federal income tax, but nearly every worker pays payroll tax, and most pay state and sales taxes.
- "The rich pay a lower rate." On federal income tax, no: the top 1%'s average rate was 26.3% in 2023 against 3.7% for the bottom half. Some very wealthy people pay low rates on unrealized gains, which are not income until sold, and that debate is separate.
- "Cutting the bottom half's tax would balance out with growth." No serious estimate finds a $70 billion cut pays for itself; at best part of it comes back as spending and sales tax.
Our take
Opinion: the number Matt cited is right, 3% then and 3.3% now, and the cost is smaller than most people guess. The honest pitch is "a $70 billion middle-class income tax cut," not "the bottom half pays nothing," because they pay plenty in payroll tax. If the goal is putting money in lower earners' pockets, cutting the payroll tax on the first few thousand dollars of wages reaches more of them, but it has to be paid back to the Social Security trust funds. For the asset side of the same story, see our article Boomers, debt and asset prices.
FAQ
What percent of federal income taxes do the bottom 50% pay?
About 3.3% in tax year 2023, or $69.9 billion of $2.14 trillion, while earning 12.3% of adjusted gross income, per IRS Statistics of Income data compiled by the Tax Foundation.
How much do you need to earn to be in the top 50%?
An adjusted gross income of $53,801 or more in tax year 2023.
Do the bottom 50% pay other taxes?
Yes. Nearly all workers pay 7.65% payroll tax from the first dollar of wages, and the lowest fifth of households pays a higher payroll tax rate (about 9.5% of income) than the top fifth (6.1%), per CBO.
What would it cost to remove income tax for the bottom 50%?
About $70 billion a year in static terms, roughly 2.5% of federal individual income tax revenue in FY2026. A phased design without a cliff would cost more.
Sources
- IRS Statistics of Income, individual statistical tables by tax rate and income percentile (Tables 4.1 to 4.3, tax year 2023)
- Tax Foundation, Summary of the Latest Federal Income Tax Data, tax year 2023, Apr 15 2026
- Congressional Budget Office, The Distribution of Household Income, 2022, Jan 2026
- Tax Policy Center, Who Will Pay No Federal Individual Income Tax in 2025?
- U.S. Treasury, Monthly Treasury Statement, September 2026 (Tables 1 and 9)
- InvestmentNews, Bezos calls for zero income tax on bottom half of earners, May 2026
- Parker, Souleles, Johnson and McClelland, "Consumer Spending and the Economic Stimulus Payments of 2008," American Economic Review, 2013
Every number on this page links to its source and was checked on Oct 23, 2026. Spot an error or a newer figure? Email matt@tensorust.com and we fix it.
Read next
- Article · Oct 23, 2026Boomers, debt and asset prices: is the market playing hot potato?
- Article · Oct 23, 2026Bonds just broke 2007's peak. AI is this cycle's housing boom
- Explainer · Oct 23, 2026What happened to banks after 2008?
- Explainer · Oct 23, 2026Did the government take money from Social Security and not pay it back?
- Explainer · Oct 23, 2026How do interest rates affect the national debt?
- Explainer · Oct 23, 2026Does building more housing lower rent?
Get the next one by email.
What my AI agents tried this week, with the real numbers: what worked, what flopped, what made money. One email when there is something worth reading.
No spam, never sold. Every email has a one-click unsubscribe.