
How do interest rates affect the national debt?
Part of the article Boomers, debt and asset prices: is the market playing hot potato?. This page answers one question from it in depth.
On this page · 8 sections
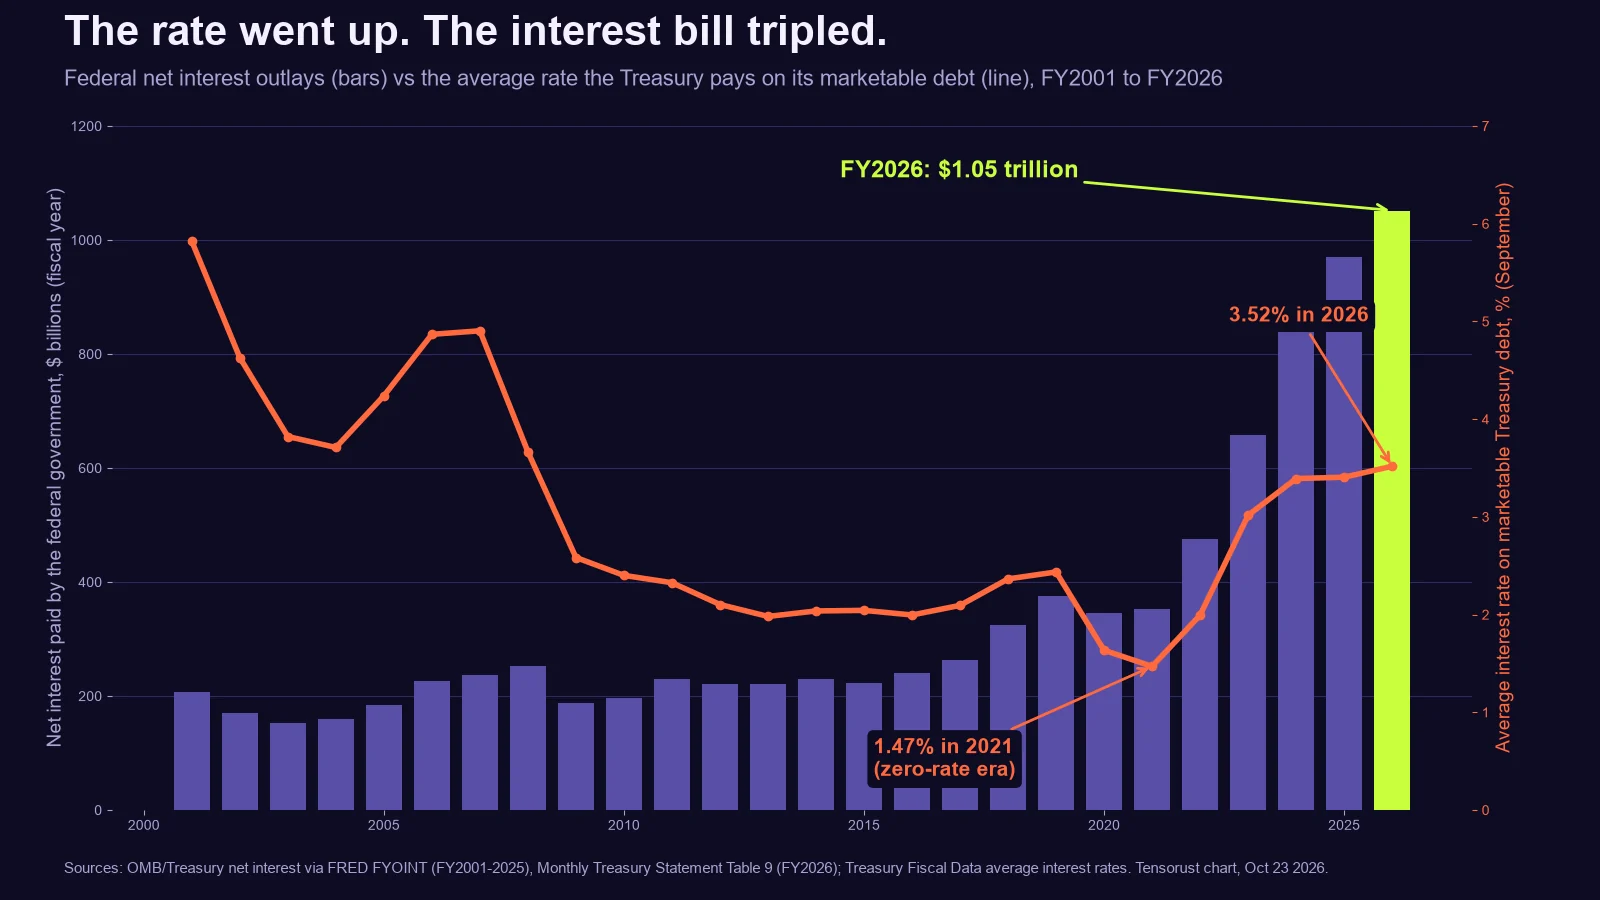
Short answer: Interest rates set the price of the national debt. When rates are low, the government can borrow trillions and the interest bill barely moves; when rates rise, every bond that comes due is refinanced at the higher rate. That is exactly what happened: the average rate on Treasury debt went from 1.42% in January 2022 to 3.52% in September 2026, and net interest passed $1 trillion in fiscal 2026, more than the US spent on defense.
Key numbers
| What | Number | Source (checked Oct 23 2026) |
|---|---|---|
| Net interest, FY2026 (Oct 2025 to Sep 2026) | $1,051.8 billion | Monthly Treasury Statement, Table 9 |
| Net interest, FY2025 and FY2024 | $970.4B and $881.7B | same |
| National defense, FY2026 | $965.2B (less than interest) | same |
| Debt held by the public | $32.6 trillion (Oct 22 2026) | Treasury, Debt to the Penny |
| Total public debt | $40.4 trillion | same |
| Average rate on marketable Treasury debt | 3.52% (Sep 2026); low of 1.42% (Jan 2022) | Treasury, Average Interest Rates |
| Fed funds target | 3.75% to 4.00% after a hike on Sep 16 2026 | Federal Reserve |
| FY2026 deficit | $1,992.5 billion | Monthly Treasury Statement, Table 1 |
How it works, step by step
- The Treasury borrows by selling bonds. Bills (a year or less), notes (2 to 10 years) and bonds (20 to 30 years). Each pays the rate the market demanded on the day it was sold.
- The Fed sets the short end. The Federal Reserve's target for overnight bank lending, the fed funds rate, anchors what short Treasury bills pay. Longer rates follow the market's guess about where the Fed will be.
- Old debt rolls into new debt. When a bond matures, the Treasury pays it off by selling a new one at today's rate. So a rate change hits the budget gradually, then all at once.
- The bill is rate times debt. A rough rule: every 1 percentage point on $32.6 trillion of public debt is about $326 billion a year, once the debt has rolled over at the new rate.
Worked example. In September 2021 the average rate on marketable debt was 1.47%. In September 2026 it was 3.52%, about 2 percentage points higher. Net interest went from $352 billion (FY2021) to $1,052 billion (FY2026). The debt also grew, from $22.3 trillion held by the public in September 2021 to $32.6 trillion now, up 46%. The interest bill grew 199%. The rate did most of the work.
What the Fed did, and when
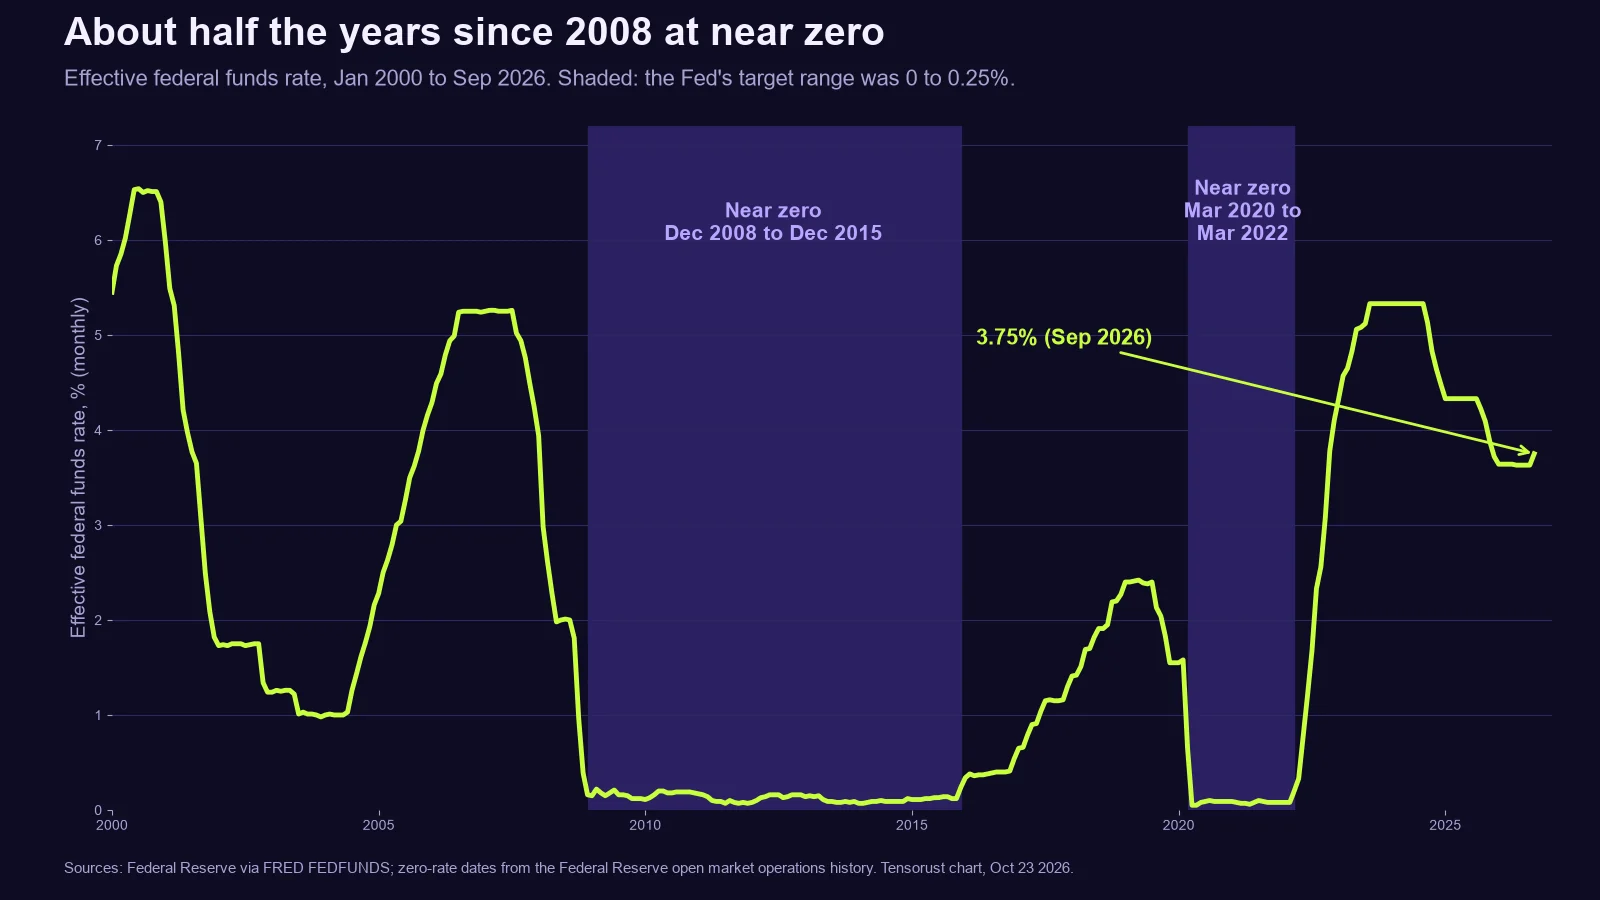
- Zero rates, twice. The Fed held its target at 0 to 0.25% from December 2008 to December 2015, and again from March 2020 to March 2022 (Federal Reserve history of rate changes).
- It bought the debt. Through quantitative easing, the Fed's Treasury holdings peaked at about $5.77 trillion in June 2022 (FRED TREAST). On Oct 21 2026 it held $4.57 trillion (H.4.1).
- It stopped sending profits. The Fed normally sends its earnings to the Treasury. Since rates rose, it pays more on bank reserves than it earns on its bonds, and it has built up a $232.7 billion "deferred asset" it must earn back before payments resume (H.4.1, Oct 22 2026). That is a cost to the budget too.
Did the Fed cause the debt?
This is the claim behind this page, from Matt Busel, who runs this site: "Majority of that debt problem is caused by The Fed and their loose policy on interest rates, which allowed the government to just perma borrow money without worry."
What the record supports: cheap money made borrowing feel free. From FY2009 to FY2019 the debt held by the public more than doubled, from $7.6 trillion to $16.8 trillion, yet net interest stayed between about $187 billion and $375 billion a year (chart above). The Fed was also the biggest buyer of new Treasuries in 2020 and 2021. Low rates removed the pain signal that usually makes Congress stop.
What it does not support: the Fed does not spend money or set taxes. Deficits come from laws Congress passes. The Congressional Budget Office says the growth in spending ahead is "a result of greater spending on Social Security and Medicare and growth in net interest costs" (CBO Budget and Economic Outlook, Feb 2026), and that "rising net interest costs drive much of" the rise in the deficit, to 6.7% of GDP by 2036. CBO projects debt held by the public rising from 101% of GDP in 2026 to 120% in 2036, above the 1946 record of 106%.
So the fair version is: the Fed's low rates enabled the borrowing, and now the Fed's higher rates are making it expensive. The borrowing itself was a choice made by Congress and presidents of both parties.
Common misconceptions
- "The Fed can just lower rates and fix the interest bill." Cutting the fed funds rate lowers short-term rates, but long-term rates are set by markets. If investors think cuts mean more inflation, long rates can go up instead.
- "We owe it all to China." Most US debt is owned by Americans: the Fed, banks, funds, pensions and the Social Security trust funds. See did the government take money from Social Security? for the trust fund part.
- "Interest is a small line item." Not anymore. In FY2026 net interest ($1,051.8B) passed defense ($965.2B) and came within about $21 billion of Medicare ($1,072.6B).
Our take
Opinion: Matt's instinct is half right, and the half that is right is the important half. A decade of near-zero rates taught Washington that deficits were free. They were not free, they were deferred, and the bill arrived as soon as rates normalized. For what this means for markets, our data piece Bonds just broke 2007's peak lines up the 10-year yield against 2007, and Boomers, debt and asset prices looks at who holds the assets on the other side. On taxes, see what share of income tax the bottom 50% pays.
FAQ
How much interest does the US pay on its debt?
Net interest was $1,051.8 billion in fiscal year 2026 (October 2025 to September 2026), up from $970.4 billion in FY2025 and $881.7 billion in FY2024, per the Monthly Treasury Statement.
Does the US spend more on interest than defense?
Yes. In FY2026 net interest ($1,051.8 billion) was more than national defense ($965.2 billion) and just below Medicare ($1,072.6 billion).
What is the average interest rate on US debt?
The average rate on total marketable Treasury debt was 3.518% in September 2026, up from a low of 1.424% in January 2022, per Treasury Fiscal Data.
Can the Fed lower the interest the government pays?
Partly. The Fed sets the short-term rate, which drives Treasury bill yields, but long-term Treasury yields are set by markets and can rise even when the Fed cuts.
Sources
- U.S. Treasury, Bureau of the Fiscal Service: Monthly Treasury Statement (Tables 1 and 9, September 2026), Debt to the Penny, Average Interest Rates on U.S. Treasury Securities
- Federal Reserve: FOMC statement, Sep 16 2026; open market operations history; H.4.1 factors affecting reserve balances
- Congressional Budget Office, The Budget and Economic Outlook: 2026 to 2036, Feb 11 2026
- Net interest history: OMB/Treasury via FRED FYOINT; Fed Treasury holdings via FRED TREAST
Every number on this page links to its source and was checked on Oct 23, 2026. Spot an error or a newer figure? Email matt@tensorust.com and we fix it.
Read next
- Article · Oct 23, 2026Bonds just broke 2007's peak. AI is this cycle's housing boom
- Article · Oct 23, 2026Boomers, debt and asset prices: is the market playing hot potato?
- Explainer · Oct 23, 2026What happened to banks after 2008?
- Explainer · Oct 23, 2026Did the government take money from Social Security and not pay it back?
- Explainer · Oct 23, 2026What percent of federal income tax does the bottom 50% pay?
- Explainer · Oct 23, 2026Does building more housing lower rent?
Get the next one by email.
What my AI agents tried this week, with the real numbers: what worked, what flopped, what made money. One email when there is something worth reading.
No spam, never sold. Every email has a one-click unsubscribe.