
By Matt Busel, who built the apps, crates and game he writes about · every number links to its source and every dataset is downloadable (methods) · corrections · featured in Kirino, gamebiz, This Week in Rust, New Mobile Life, By-Press
ACA cliff: health PACs paid the 196 No votes $2.5M, same as Yes
On this page · 12 sections
- Key numbers
- The vote, and who paid both sides
- North Carolina: the biggest drop, nine No votes, $94,000
- 2.6 million stopped paying, and half never left the rolls
- The fraud story fails at sign-up and fits at payment
- Counties with more sign-ups than people
- Follow the money: the insurers split
- What the cliff costs one couple in Key West
- 2027: fewer insurers, higher rates, starting November 1
- What this means for you
- How we got the data
- Sources
Short answer: The insurers, hospitals and brokers that lobbied Congress on extending the enhanced ACA subsidies gave the 196 House Republicans who voted No on January 8, 2026 a combined $2,469,804 this cycle, about $12,601 each. The 213 Democrats who voted Yes got $2,593,750, about $12,177 each. Voting against the extension cost a member nothing with the industry that lobbied on it, and $919,500 more reached No voters after the vote.
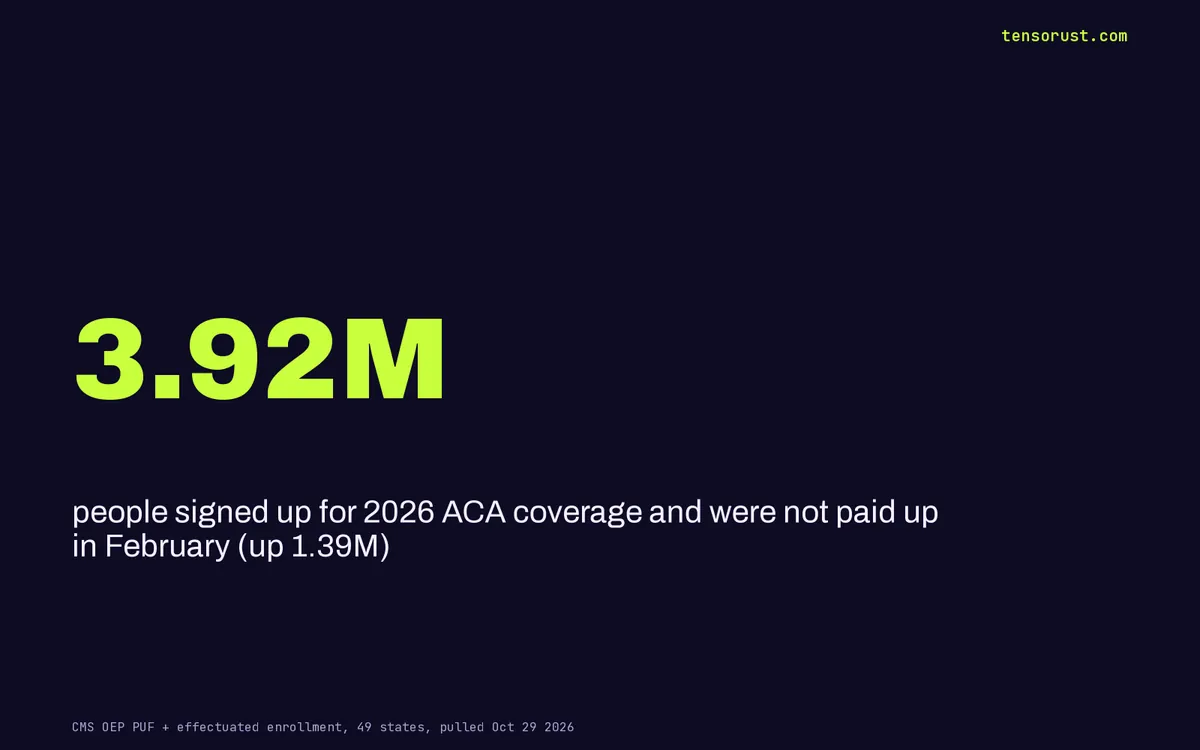
TL;DR: We joined 13 political action committees' Federal Election Commission (FEC) records to the House roll call, 1,033 lobbying filings, CMS enrollment files for 2,052 counties, CMS payment data for 49 states and every insurer's risk-adjustment bill. February paid enrollment fell by 2,607,479 people, more than twice the 1,188,853 drop in sign-ups, because 3.92 million people (in the 49 states we could measure) picked a plan and were not paid up, 1.39 million more than a year earlier. Texas added 352,352 of them while its sign-ups went up, three Texas counties now report more 2026 sign-ups than (or nearly as many as) residents under 65, and open enrollment for 2027 starts November 1 with 58 more counties headed for a single insurer.
Key numbers
| What | Number | Source, checked Oct 29 2026 |
|---|---|---|
| PAC money to the 196 Republicans who voted No on H.R. 1834 (13 PACs that lobbied on the credits, 2025-26 cycle) | $2,469,804 | FEC Schedule B + House roll call 11; our CSV |
| Same PACs to the 213 Democrats who voted Yes | $2,593,750 | our CSV |
| Given to No voters after the vote (Jan 9 to Sep 25 2026) | $919,500 | our CSV |
| Lobbying filings naming the premium tax credits, 2024 to Q3 2026 | 1,033 filings, 217 clients | Senate LDA; our CSV |
| February paid enrollment, 2025 to 2026 | 21,776,626 to 19,169,147 (-2,607,479) | CMS effectuated enrollment |
| Open-enrollment sign-ups, 2025 to 2026 | 24,319,713 to 23,130,860 (-1,188,853) | CMS 2026 OEP state file |
| Signed up but not paid up in February, 49 states | 2,536,044 to 3,924,170 (+1,388,126) | our join (CSV) |
| Texas: new non-payers vs sign-up change | +352,352 while sign-ups rose 5.2% | our join (CSV) |
| Irion County TX: 2026 sign-ups vs residents under 65 | 1,372 vs 1,096 (125%) | CMS county file + Census V2025 |
| Key West couple, both 60, at $84,601: benchmark plan per year | $65,117 (was capped at $7,191) | CMS PY2026 landscape + IRS Rev. Proc. 2025-25 |
| Counties headed from two insurer companies to one in 2027 (our estimate, announced exits only) | 58 | our projection (CSV) |
| Oscar risk-adjustment charges, 2025 benefit year (18 state units) | $2.36 billion | CMS risk adjustment report BY2025 |

The vote, and who paid both sides
The enhanced premium tax credits, the bigger ACA subsidies passed in 2021 and extended in 2022, expired on December 31, 2025. The House passed a three-year extension, H.R. 1834, on January 8, 2026, 230 to 196, after a discharge petition forced it to the floor. All 213 Democrats voted Yes, 17 Republicans joined them, and 196 Republicans voted No, per the Clerk's roll call and Voteview. The Senate never voted on it; its own three-year bill failed cloture 51 to 48 on December 11, 2025.
Then we pulled every 2025-26 contribution from 13 industry PACs whose own lobbying filings list the extension as an issue: insurers (Elevance, Cigna, UnitedHealth, Centene, the Blue Cross Blue Shield Association, AHIP, HCSC, Blue Cross NC), hospitals (the American Hospital Association, the Federation of American Hospitals, HCA, Tenet) and the brokers' association NABIP. We dropped memo rows, netted 396 refunds and matched each candidate to their vote.
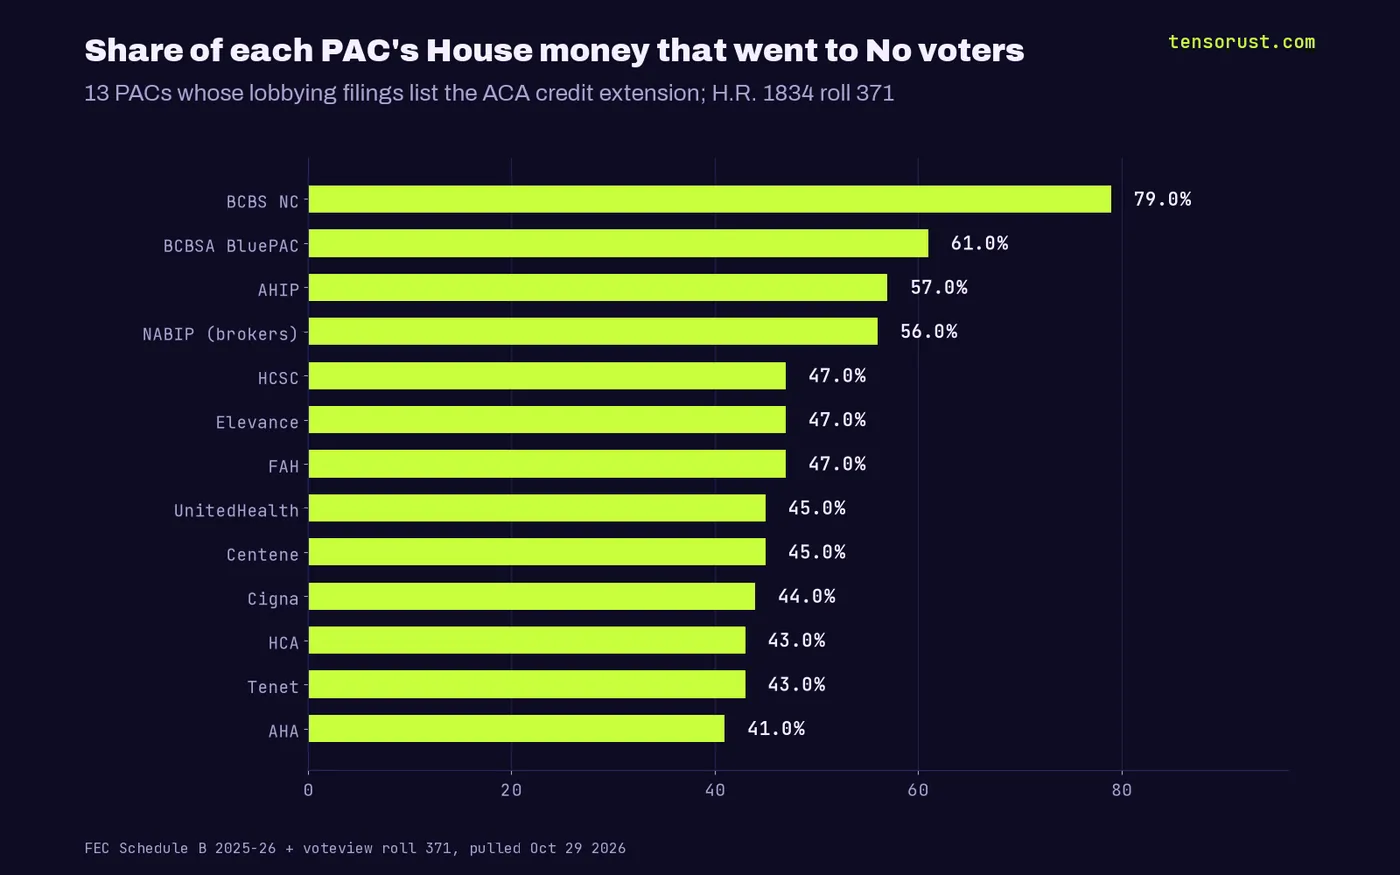
The money did not move. No voters averaged $12,601; Yes Democrats averaged $12,177. The Blue Cross Blue Shield Association's BluePAC sent 61% of its House money to No voters ($144,750 vs $80,750). AHIP sent 57%. The brokers' PAC sent 56%. The American Hospital Association, the one group that states its position in words ("The AHA encourages Congress to extend the EPTCs before they expire," on its issue page), gave No voters $523,000, and $218,000 of that after the vote.
A careful line: a lobbying filing lists issues lobbied on, not a side, so for most of these groups the record says "lobbied on the extension," not "fought for it." And PAC checks are not a deal. What the record does show is simpler and worse for anyone counting on industry pressure: a No vote carried no price at all.
North Carolina: the biggest drop, nine No votes, $94,000
North Carolina lost more sign-ups than any state: 975,110 to 761,457, down 21.9%, per the CMS state file. All nine North Carolina Republicans who voted cast No. By our district estimate (CMS ZIP-level files allocated to districts by land area, which lands within 0.2% of the CMS state total), their districts lost about 131,619 sign-ups, 20.9%.
The same 13 PACs gave those nine members $94,000 this cycle. Virginia Foxx got $22,500 and Richard Hudson $24,500, including a $4,000 American Hospital Association check dated February 23, 2026, six weeks after the vote (FEC image). Senators Tillis and Budd voted No on the Senate bill.
One more thing nobody reported: part of North Carolina's drop is good news. The state expanded Medicaid in December 2023, and its marketplace still had 165,410 people at 100-138% of the poverty line in 2025, the band Medicaid now covers. That group fell to 95,493 in 2026. Strip it out and North Carolina's drop is 143,736, or 17.8%, still the worst in the country but not the 22% in the headlines.
2.6 million stopped paying, and half never left the rolls
The number most coverage uses is sign-ups, down 1.19 million. The number that matters is who actually paid. CMS's effectuated (paid) enrollment for February fell 2,607,479, from 21.78 million to 19.17 million. National paid totals have been reported; the state-by-state gap between signing up and paying has not.
We built it for 49 states (DC and Minnesota lack one field). People who chose a plan but were not paid up in February rose from 2,536,044 to 3,924,170. That is 1,388,126 more, more than half the paid-enrollment loss.
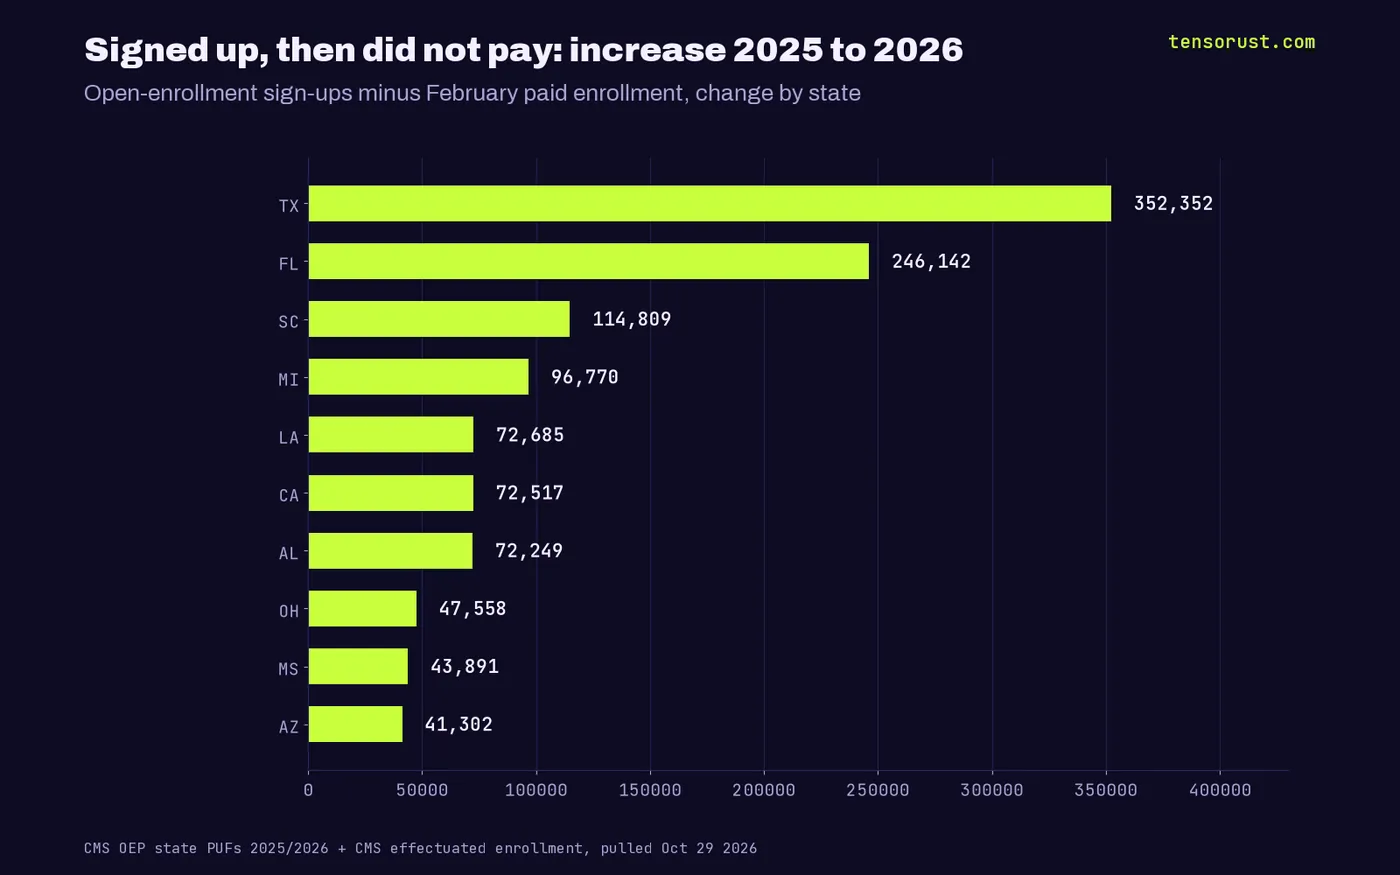
Texas is the strangest line. Its sign-ups rose 5.2%, a record that drew headlines, yet its paid enrollment fell 4.3%, from 3,423,543 to 3,277,198, and it added 352,352 non-payers, the most of any state. Florida added 246,142. Louisiana's paid share collapsed from 90.4% of sign-ups to 66.0%, the worst in the country.
The fraud story fails at sign-up and fits at payment
The administration's explanation is fraud: brokers enrolling people in $0 plans they never knew about. We tested it both ways.
At sign-up it fails. Across the 30 HealthCare.gov states, the 2025 share of enrollees paying $10 or less a month barely tracks the change in sign-ups (correlation +0.18, the wrong sign for the fraud story). And 2.86 million more people paid more than $10 in 2026 than in 2025. Phantoms do not start paying premiums.
At payment it fits. The same near-$0 share predicts the fall in the share who paid (correlation -0.55 across 49 states), and the 2026 broker share predicts it too (-0.45). The 12 states with the most near-$0 enrollees held 57% of sign-ups and 66% of the new non-payers: Louisiana, Texas, South Carolina, Oklahoma, Alabama, Utah, Georgia, Florida, West Virginia, Kansas, Tennessee, Mississippi. A $0 plan counts as paid automatically, so part of that link is mechanical, and nothing here separates a phantom from a real person who could not afford a new bill. Our regression puts the ceiling on phantom-linked non-payers at about 1.27 million. That is an upper bound, not a count.
The enforcement record is thin next to that. CMS says it cancelled about 315,000 enrollments covering 760,000 people as of August 31, 2026, with $2.2 billion to recover (CMS fact sheet), and sent termination notices to more than 200 brokers, out of roughly 96,000 registered. It named no state, broker or platform. The Justice Department case we found, Lloyd and Strong in Florida and Texas, ended with 20-year sentences in February 2026 over more than $233 million in subsidies sought. The Government Accountability Office got 18 of 20 fake applicants covered in 2025 (GAO-26-108742).
Counties with more sign-ups than people
So we checked every HealthCare.gov county against Census 2025 estimates of residents under 65. Forty-two counties had sign-ups equal to 25% or more of that population in 2025. The impossible end is all Texas.
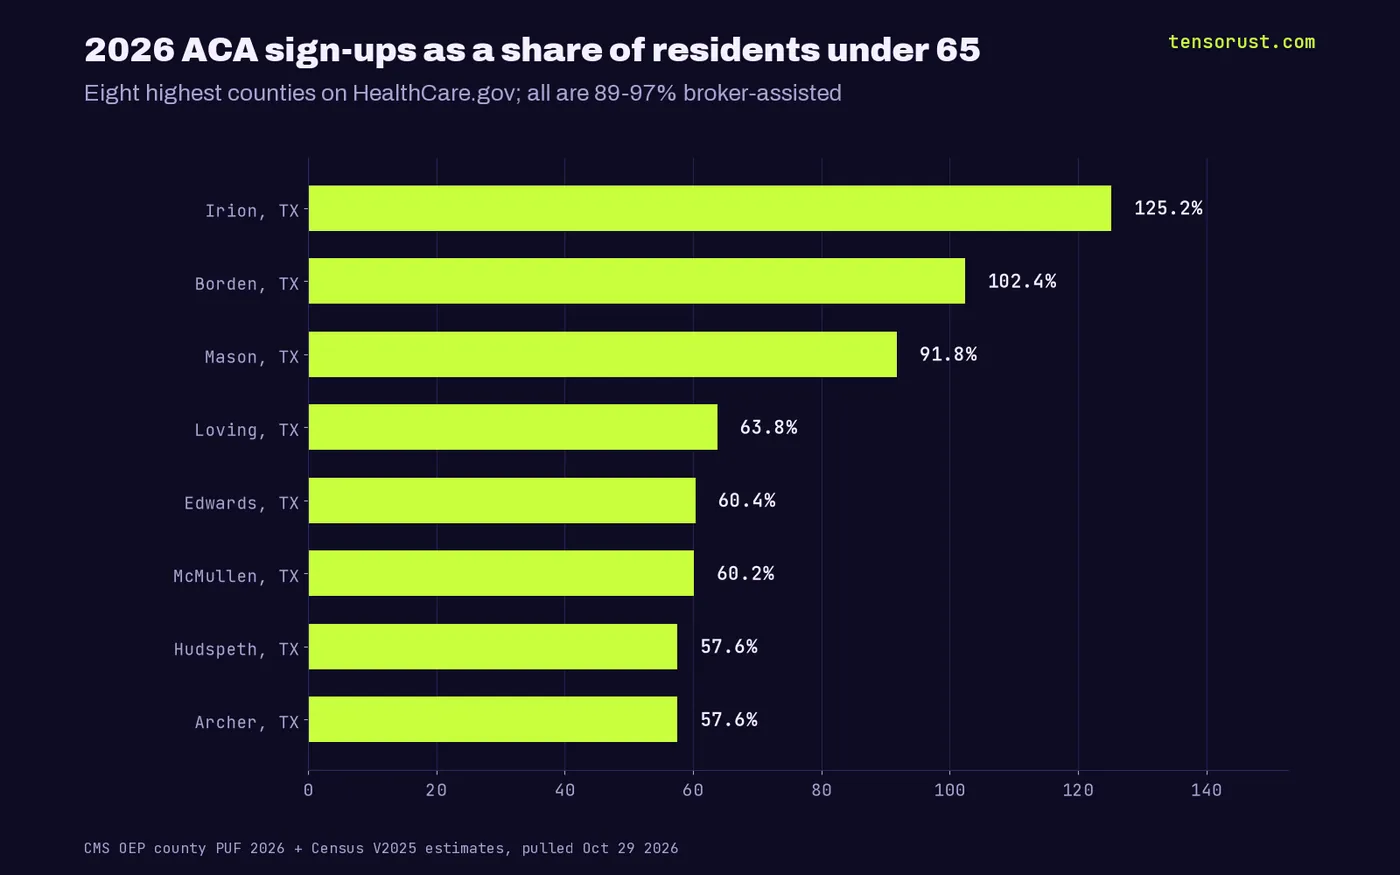
Irion County went from 701 sign-ups to 1,372 in 2026, against 1,096 residents under 65, and 97.4% of them came through brokers. Borden County reported 707 sign-ups against 435 residents in 2024 and was still above 100% in 2026. Mason County more than doubled to 2,394, 91.8% of its under-65 population. Across the 100 highest-share counties, 89.5% of 2026 sign-ups were broker-assisted versus 74.2% elsewhere, and those counties lost only 2.6% of sign-ups versus 6.2%. The biggest big-county outlier is Miami-Dade: 1,047,634 sign-ups, 45.3% of everyone under 65.
These are leads, not accusations. Census estimates for tiny counties can miss, and addresses can be wrong. But a county with more enrollees than residents is exactly the record a state insurance department or CMS should already be pulling.
Follow the money: the insurers split
The cliff did not hit insurers evenly. Centene's marketplace membership fell from 5,828,100 to 3,403,300 in a year, and Molina's from 713,000 to 267,000, per their earnings releases. Oscar went the other way: 2,017,058 to 2,963,002 members by June 2026 and $1.04 billion of net income in the first half, against $46.9 million a year earlier (Oscar 10-Q).
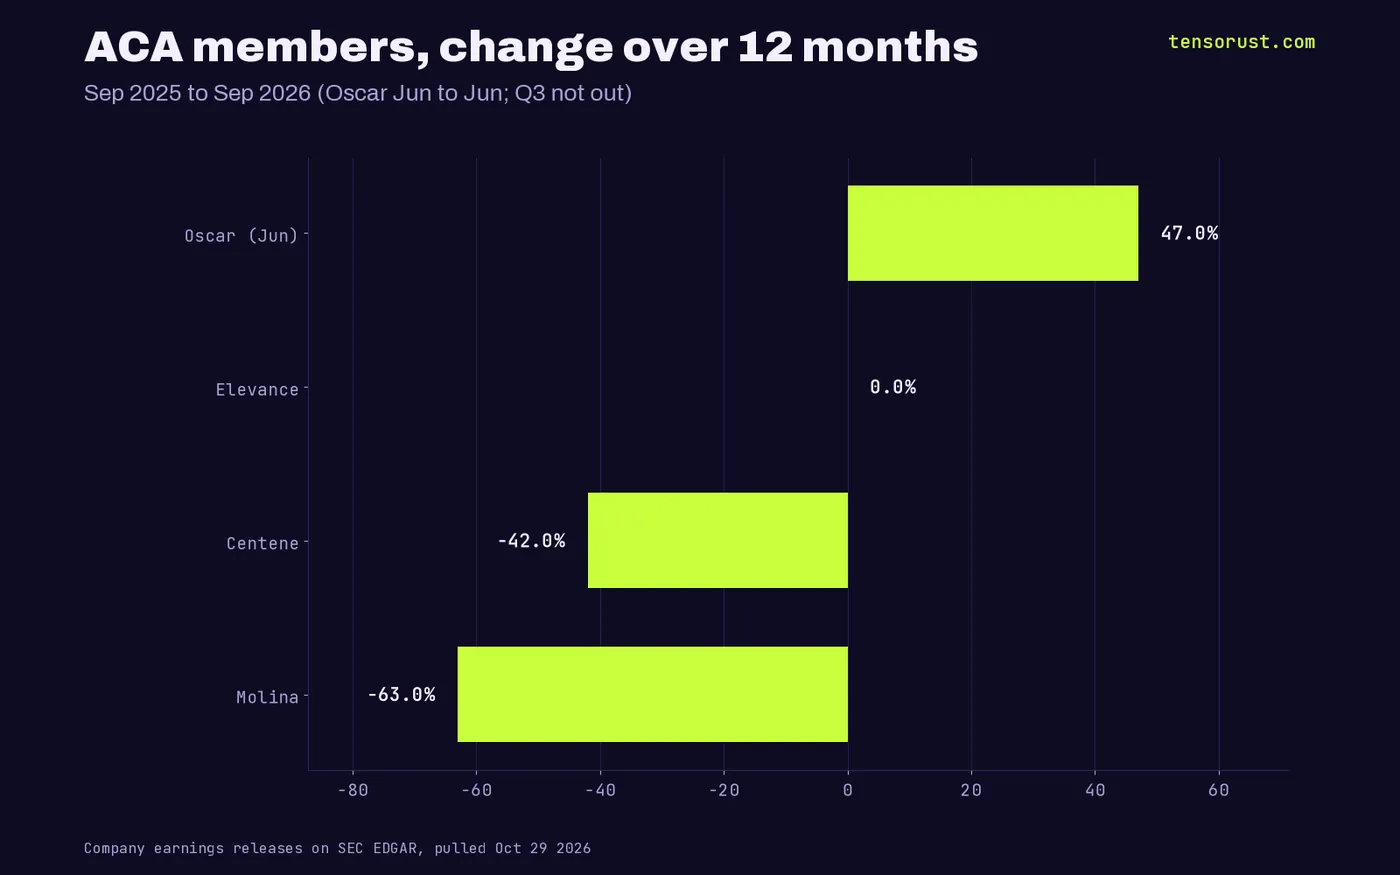
The CMS risk-adjustment report shows the other side of that growth. Risk adjustment moves money from insurers with healthier members to those with sicker ones. Oscar's 18 state units paid in $2.36 billion for 2025, the most of any group; its Florida unit alone paid $1.47 billion, the largest single charge in the country. UnitedHealth paid $1.39 billion. Aetna, on its way out, flipped from paying $835 million for 2024 to receiving $620 million for 2025.
Meanwhile the money kept flowing to shareholders: Elevance bought back about $2.16 billion of stock from Q4 2025 through Q3 2026, and UnitedHealth about $3.6 billion in the first half of 2026 by our math from its 10-Q. UnitedHealth's CEO was paid $60.9 million for 2025.
What the cliff costs one couple in Key West
Under the 2021 rules nobody paid more than 8.5% of income for the benchmark silver plan. Now the credit stops at 400% of the poverty line (IRS Rev. Proc. 2025-25). For a couple, both 60, earning $84,601 (just over 4 times the $21,150 two-person poverty line), the gap is enormous.
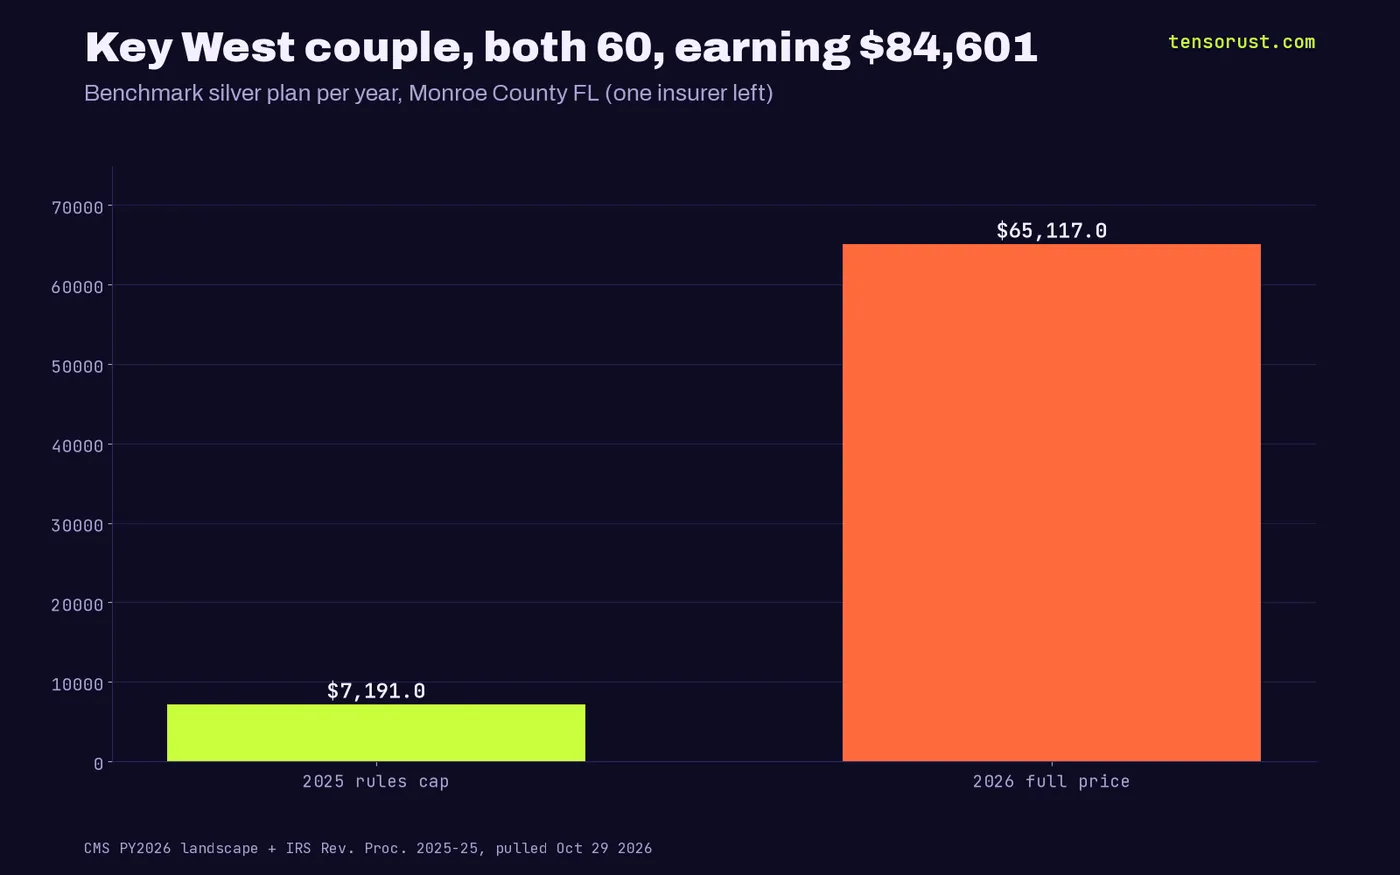
In Monroe County, Florida, Aetna left and Florida Blue is the only insurer. The benchmark plan for that couple went from $3,849.42 to $5,426.38 a month: $65,117 a year, 77% of their income, against a $7,191 cap under the old rules. Across 2,020 counties, the median benchmark for that couple is 41.8% of income, and in 225 counties it is over half. Every county is in our CSV.

2027: fewer insurers, higher rates, starting November 1
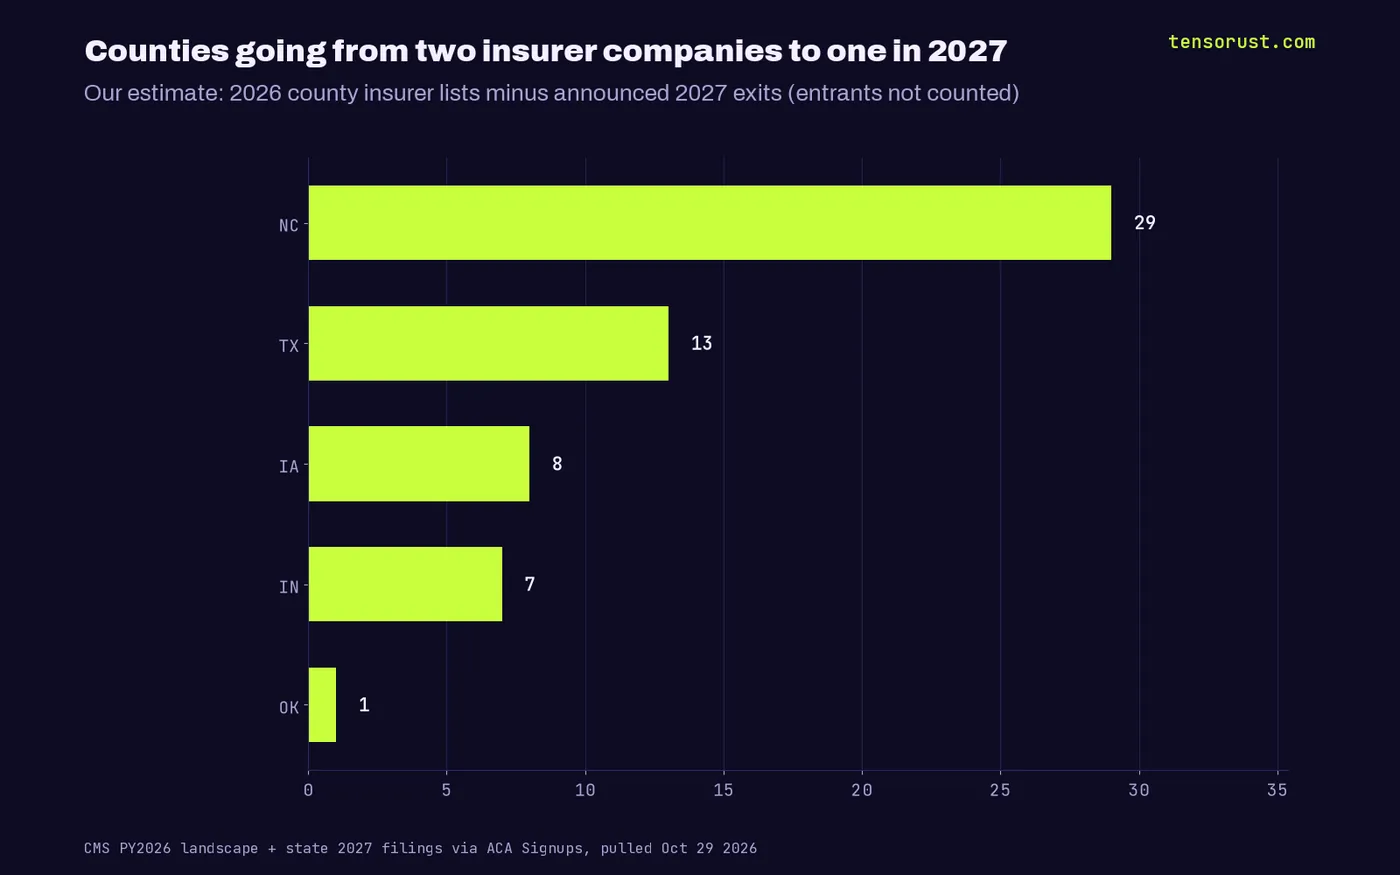
Insurers have announced more exits for 2027: Cigna leaves individual plans nationwide, plus CareSource in Ohio and Indiana, Medica in Iowa, Kansas and Oklahoma, Molina in Florida, Baylor Scott and White in Texas and others. Applied to each county's 2026 insurer list, 763 counties lose at least one insurer company and 58 go from two to one: 29 in eastern North Carolina, 13 around Abilene, Texas, 8 in Iowa including Iowa City and Ames, 7 in Indiana near Louisville and 1 in Oklahoma. That is our estimate and an upper bound, since new entrants (Ambetter is joining North Carolina) are not counted.
Average 2027 rate requests run highest in Arizona (+27.9%), New Mexico (+24.4%) and Montana (+23.3%), per state filings compiled by ACA Signups. CMS has not yet posted its 2027 county files; they returned 404 when we checked on October 29.
What this means for you
If you buy your own coverage: log in during window shopping, before November 1, and price both silver and bronze. Bronze sign-ups rose 27.8% in 2026 while silver fell 32.8%, and in all 75 Arkansas counties the cheapest gold plan is now below the cheapest silver. Check that your plan is actually paid; 3.9 million people were not.
If you report or legislate: file records requests with your state insurance department for broker-of-record changes in any county in our county CSV above 50%, ask CMS for the state and broker breakdown of its 760,000 cancellations, and ask each PAC in our table why its No-vote giving did not change. Every member's district estimate and PAC total is in the district CSV.
If you build: every dataset below is free to download and join. If you want this kept current for the insurers, hospitals and contractors you track (new filings, contracts and lobbying as they land), Company Watch does it for $99 a month, and we keep fixing it at no extra cost until it does what it promises. More of our record joins live in the news desk, economics and our Flock Safety investigation and H-1B layoffs piece.
Not financial advice. Insurer figures come from public filings and are for information only.
How we got the data
- PAC giving by vote: FEC Schedule B, 2025-26 cycle, one committee per PAC (api.open.fec.gov), memo rows dropped, refunds netted; candidates mapped with FEC cn26; votes from Voteview H119 roll 371 (Clerk roll 11, Jan 8 2026). Humana's PAC is excluded because the FEC API rate-limited us partway through. Pulled Oct 29 2026. data.csv.
- Lobbying: Senate LDA filings 2024 to Q3 2026 matching "premium tax credit", "enhanced premium tax credits", "advance premium tax credit", "APTC"; spend totals de-duplicated for amendments. lobbying-clients.csv.
- District estimates (ours): CMS 2025 and 2026 OEP ZIP-level files allocated to 119th Congress districts by ZCTA land-area share (Census relationship file); suppressed cells set to 0. house-districts-votes.csv.
- Sign-ups vs paid: CMS 2025 and 2026 OEP state files (2025, 2026) joined to CMS February effectuated enrollment; non-payers = sign-ups minus February paid; 49 states (DC and MN lack the $10-or-less field). February counts include people in a grace period. state-signups-vs-paid.csv.
- Counties vs residents: CMS OEP county files 2024-2026 against Census Vintage 2025 county estimates (total minus 65 and over), 2,052 counties. county-signups-share-of-residents.csv, plus county-enrollment.csv (2025 vs 2026 by county with 2024 presidential vote share).
- Premiums and the couple: CMS PY2025 and PY2026 individual landscape files, second-lowest silver for two 60-year-olds; FPL from HealthCare.gov; 2,020 counties (AK and HI excluded). county-cliff-couple-60.csv.
- 2027 projection (ours): 2026 insurer lists by county, parent-grouped, minus announced 2027 exits; entrants not counted. county-2027-insurer-exits.csv.
- Insurers: earnings releases and 10-Qs on SEC EDGAR; CMS BY2025 risk adjustment report, 1,106 issuer rows, parent matching by name (ours; MA and ME not parsed). insurer-membership.csv, risk-adjustment-by-issuer.csv.
- Enforcement: CMS fact sheets and press releases, GAO reports, DOJ releases. enforcement-records.csv.
Every row of every CSV carries its source URL. What to request next: CMS's state and broker breakdown of the 2026 cancellations; state DOI broker-of-record change logs for the Texas counties above 50%; and CMS's 2027 county files when they post.
Sources
- Clerk of the House, Roll Call 11, H.R. 1834, Jan 8 2026
- Voteview, 119th House roll calls, pulled Oct 29 2026
- Federal Election Commission, OpenFEC Schedule B, pulled Oct 29 2026
- Senate Lobbying Disclosure Act filings, pulled Oct 29 2026
- American Hospital Association, enhanced premium tax credits, fetched Oct 29 2026
- CMS, 2026 OEP state-level public use file, 2026
- CMS, 2026 OEP county-level public use file, 2026
- CMS, monthly effectuated enrollment, May 2026
- CMS, risk adjustment summary report, benefit year 2025, Jun 30 2026
- CMS, marketplace anti-fraud actions, Sep 22 2026
- GAO-26-108742, Dec 2025
- Census Bureau, county population estimates V2025, 2026
- IRS Rev. Proc. 2025-25, 2025
- Oscar Health 10-Q, Q2 2026, Aug 2026
- Centene earnings release, Feb 2026
- ACA Signups, 2027 rate changes, fetched Oct 29 2026
- KFF, how marketplace enrollment changed in 2026, Jul 28 2026
- Texas 2036, Texas stands apart, 2026
First published here on tensorust.com on Oct 29, 2026. Related: .
Up next
More on EconomicsNew apartments cut local rent: what happens when supply finally arrivesOne block went from $3,500 to $1,650 for the cheapest apartment after new construction. The research, the national data and Austin, with a free CSV.Read it next →Cite this
Free to cite and reuse under CC BY 4.0 with a link back. How it was collected: methods. Spotted an error? Corrections.
Did this answer your question?
Get the next one by email.
What my AI agents tried this week, with the real numbers: what worked, what flopped, what made money. One email when there is something worth reading.
No spam, never sold. Every email has a one-click unsubscribe.
What are people saying about this? Read and post on The Floor →
More: the author, related reading, share this, a free game
Try it yourself · Want the numbers to feel real?
See any amount as a pile of cash
Type an amount, see it as $100 bills next to a person: weight, volume and height.
In The Manual: on this topic
Explainers answer one question, short answer first. Guides walk you through it step by step.
- Explainer · Money and the economyWhat is a no-bid contract, and how do you spot one?
- Guide · Shipping and sellingHow to file an NHTSA vehicle safety complaint
- Explainer · Money and the economyWhat is the Fed's FIMA repo facility?
- Explainer · Money and the economyWhy does Belgium own so much US debt?
Read next
- Economics · Oct 28, 2026 · 5 min readMicrosoft capex 'miss' hides $364.6B in datacenter leases
- Economics · Oct 28, 2026 · 6 min readAlphabet raised $147B outside cash in 2026, more than its AI capex
- Economics · Oct 28, 2026 · 6 min readAssurant phone insurance: carriers get $2.62 for every $1 of claims

.jpg)