
By Matt Busel, who built the apps, crates and game he writes about · every number links to its source and every dataset is downloadable (methods) · corrections · featured in Kirino, gamebiz, This Week in Rust, New Mobile Life, By-Press
Dominion, Eversource, Xcel filed frozen solar counts to the feds
On this page · 9 sections
Short answer: Three of the biggest rooftop solar utilities in the US sent the federal government the exact same residential solar count, down to the kilowatt, two years in a row while customers kept installing panels. Dominion filed 17,542 homes and 116.639 MW for both 2021 and 2022, then 44,993 for 2023. Across 2016 to 2024 we found 1,001 utility-years where the solar customer count and capacity both matched the prior year exactly, and the federal file marks none of them as estimates.
TL;DR: We pulled every EIA-861 net metering file from 2015 to 2024 (8,392 utility-year pairs) and compared each utility's residential solar numbers to its own prior year. Eversource's NSTAR Electric filed 63,834 homes and 519.665 MW for 2022 and 2023, Xcel's Public Service Co of Colorado filed 31,475 and 175.990 MW for 2018 and 2019, and Dominion filed 17,542 and 116.639 MW for 2021 and 2022; each then jumped (Dominion +156% in one year). In the customer file, Albany, Georgia reported exactly 31,473 residential customers six years running, and all 512 exact customer repeats we found there are labelled "O = Observed", not imputed. If you build on federal solar or utility data, you are building on some numbers nobody re-counted.
Key numbers
| What | Number | Source, checked Oct 27 2026 |
|---|---|---|
| Utility-year pairs compared (residential net-metered PV, 2016-2024 vs prior year) | 8,392 | EIA-861, our calc |
| Pairs where solar customers AND MW match the prior year exactly | 1,001 (11.9%), at 434 utilities | EIA-861 Net Metering, our calc |
| Same, among utilities with 10,000+ solar homes | 3 of 319 (0.9%) | EIA-861, our calc |
| Dominion (VA) residential solar homes, 2021 / 2022 / 2023 | 17,542 / 17,542 / 44,993 | EIA-861 Net Metering 2021-2023 |
| Eversource NSTAR (MA), 2022 / 2023 / 2024 | 63,834 / 63,834 / 80,111 | EIA-861 Net Metering 2022-2024 |
| Xcel PSCo (CO), 2018 / 2019 / 2020 / 2021 | 31,475 / 31,475 / 37,169 / 69,782 | EIA-861 Net Metering 2018-2021 |
| Albany, GA residential customers, 2015-2020 | 31,473 every year, then 29,071 | EIA-861 Sales to Ultimate Customers |
| Exact customer-count repeats flagged as imputed by EIA | 0 of 512 | EIA-861 Sales "Data Type" column, our calc |

The flat line that hid 27,451 Virginia solar homes
EIA-861 is the annual census every US electric utility files with the Energy Information Administration. Its net metering schedule is the official count of homes with rooftop solar that sell power back to the grid, and it feeds state dashboards, research papers and every "rooftop solar is booming or crashing" chart you have seen.
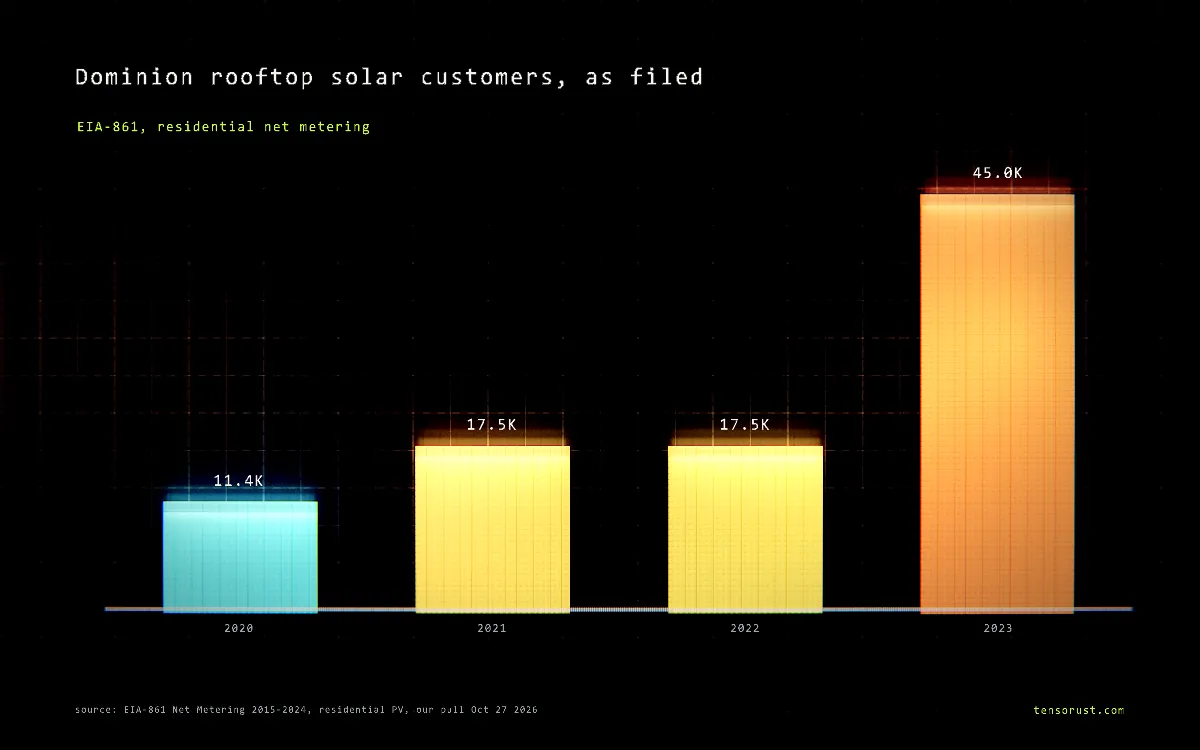
Dominion Energy Virginia (filed as Virginia Electric & Power Co) reported 11,404 solar homes for 2020 and 17,542 for 2021. For 2022 it reported 17,542 again, with capacity of 116.639 MW, identical to three decimal places. For 2023 it reported 44,993.
Virginia did not stop installing solar for a year and then add 27,451 homes in twelve months. The 2022 row is a copy of 2021. The real 2022 growth landed in the 2023 row, and anyone who measured Virginia year over year saw a zero, then a 156% boom that never happened that way.
Eversource and Xcel did the same thing
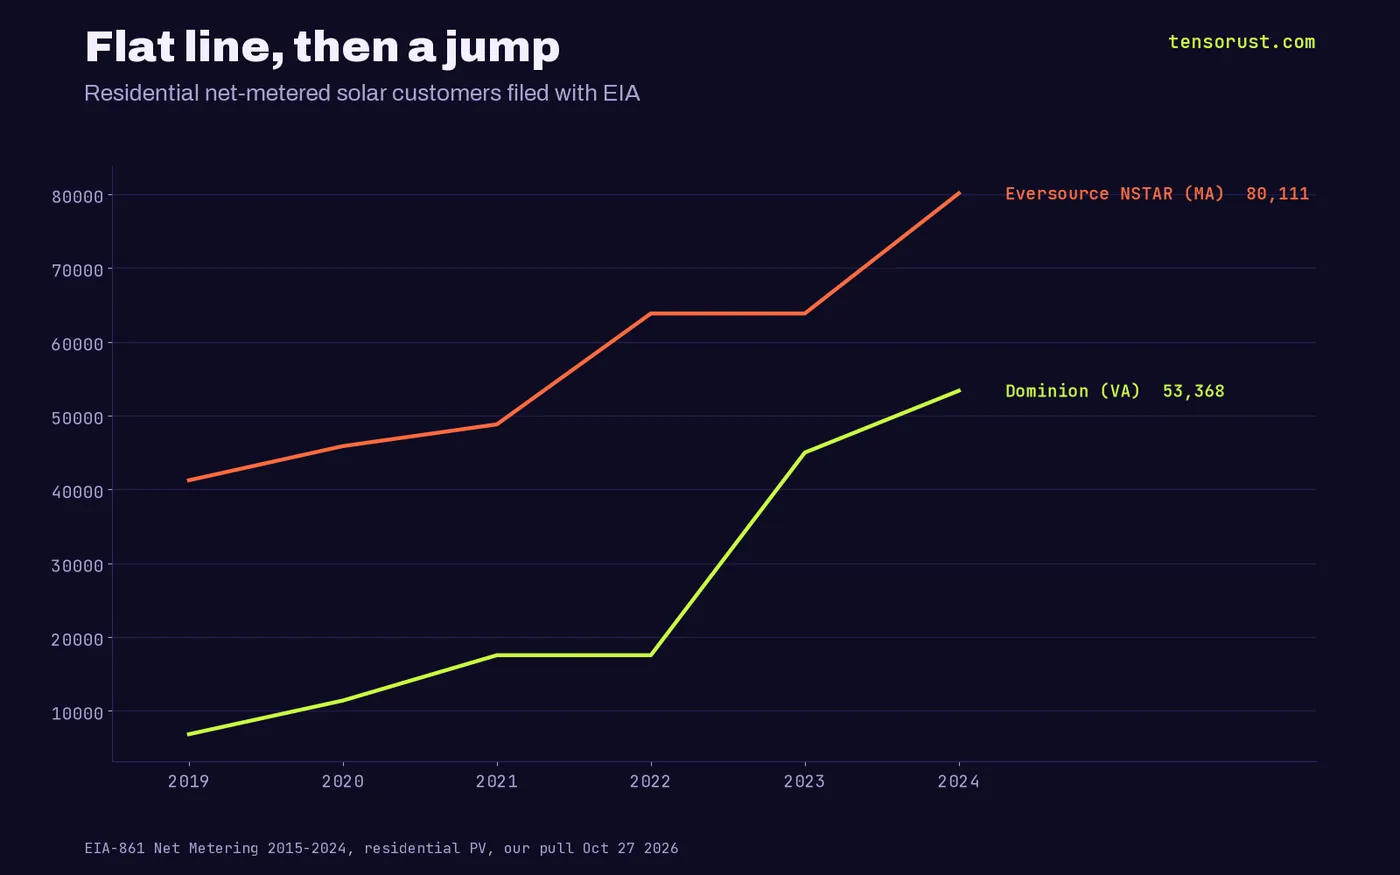
Eversource's NSTAR Electric in Massachusetts reported 63,834 solar homes and 519.665 MW for 2022, and the exact same two numbers for 2023. For 2024 it reported 80,111, a jump of 16,277. The 2023 file in EIA's archive is dated March 2025, a reissue, and the copy is still in it.
Xcel Energy's Public Service Co of Colorado filed 31,475 homes and 175.990 MW for both 2018 and 2019. Then 37,169 for 2020 and 69,782 for 2021. Cleco Power in Louisiana repeated 3,204 homes and 17.428 MW for 2020 and 2021.
That is three of the 319 utility-years with 10,000 or more solar homes, under 1%. Rare, but these are not small players: in 2023 the NSTAR copy alone was 63,834 of the 68,045 repeated homes nationwide that year, 1.5% of the whole US residential net metering count.
Small utilities freeze their numbers far more often
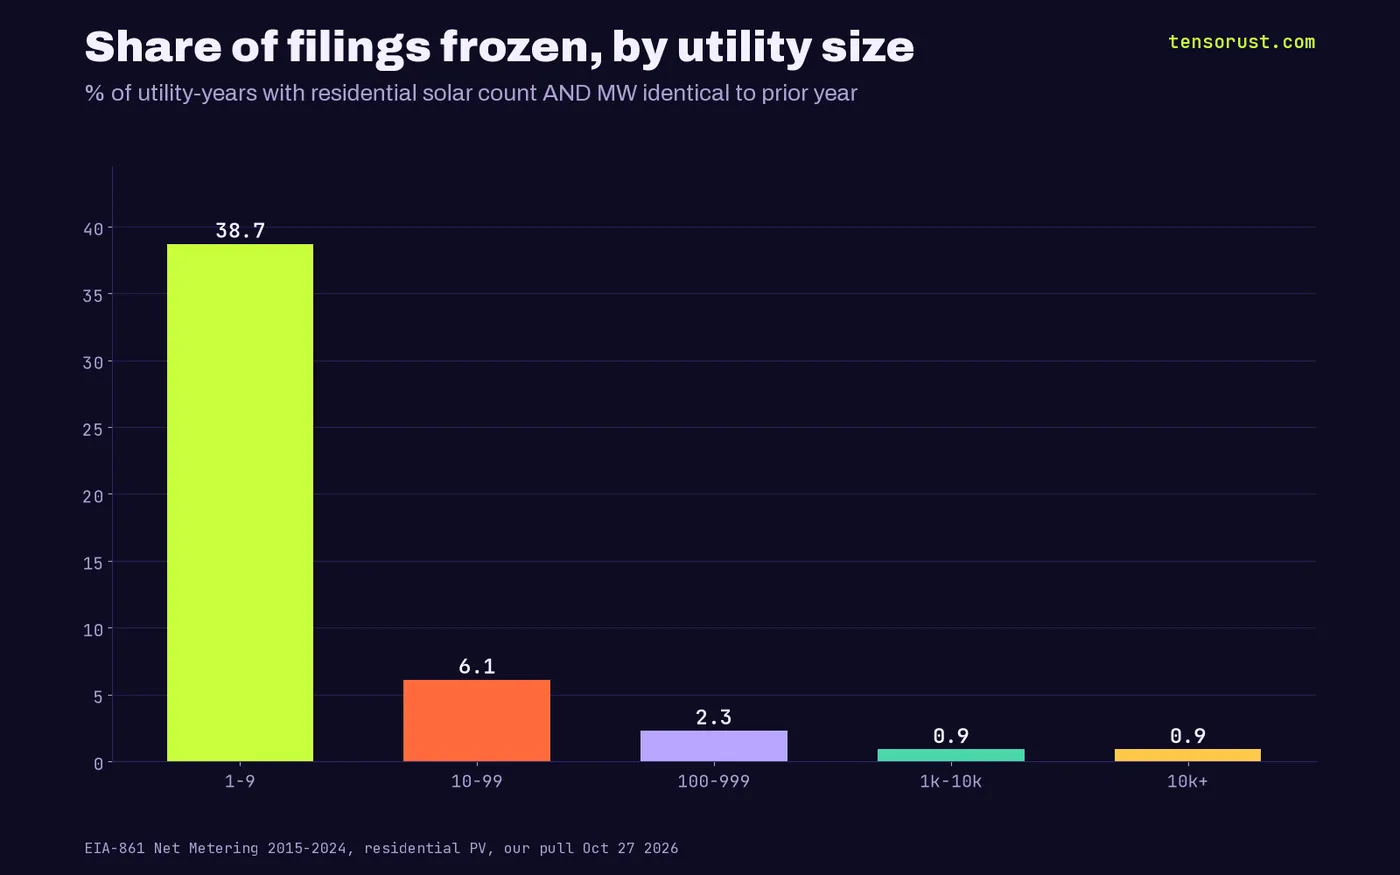
Size matters. Among utilities with 1 to 9 solar homes, 38.7% of filings repeat the prior year exactly, which is often just true: nobody new installed. At 10 to 99 homes it is 6.1%, at 100 to 999 it is 2.3%, and above 1,000 it is 0.9%.
The states with the most frozen filings are Minnesota (94), Iowa (87), Nebraska (75) and Wisconsin (70), heavy with small co-ops and city utilities. In Iowa, 37.7% of utility-year pairs are frozen. Part of the small-utility pile may be EIA's own handling of short-form filers, which EIA says it folded into its imputations from 2020; the published file has no column telling you which rows those are.
Six years of the same number
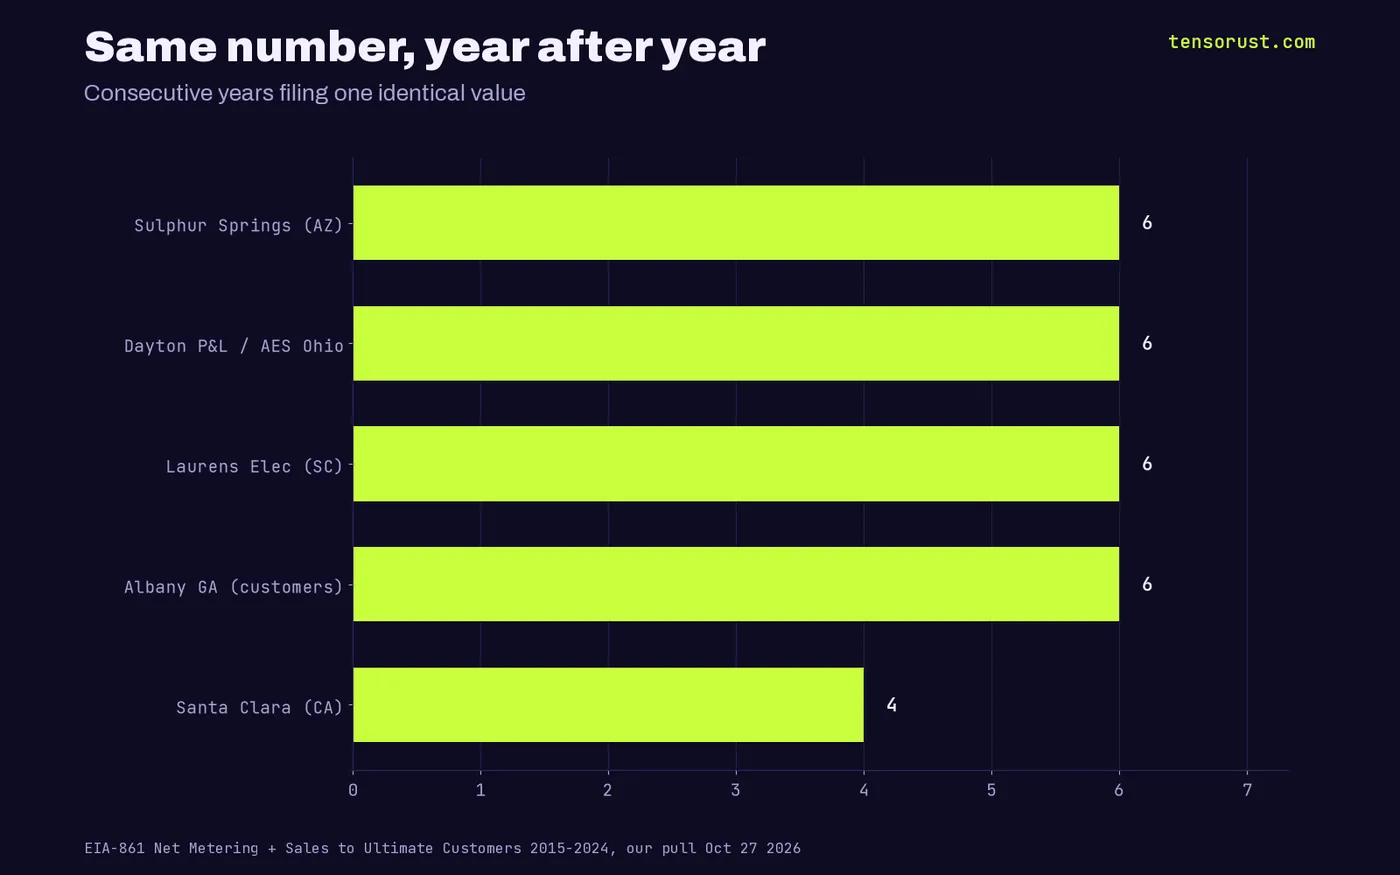
Some utilities stopped updating entirely. Sulphur Springs Valley Electric Cooperative in Arizona has filed 1,137 solar homes every year since 2018, with 8.5 MW unchanged from 2019 through 2024.
Dayton Power & Light, the Ohio investor-owned utility now called AES Ohio, has filed 388 homes and 2.602 MW for six straight years, 2019 to 2024. Laurens Electric Cooperative in South Carolina: 248 homes, unchanged 2019 to 2024. The City of Santa Clara, California: 826 homes, 2020 to 2023.
It is not only solar. In the customer counts, Albany, Georgia's utility board filed exactly 31,473 residential customers for 2015, 2016, 2017, 2018, 2019 and 2020, while its megawatt-hours and revenue changed every year. For 2021 it filed 29,071: the frozen number had been about 2,400 customers too high. Morenci Water and Electric in Arizona repeated its residential customer count for six year-pairs from 2018 to 2023.
EIA labels the copies "observed"
The customer file has a column for exactly this: "Data Type, O = Observed, I = Imputed". We found 512 utility-years whose residential customer count equals the prior year exactly (bundled service, one row per utility and state). Every one is marked O. EIA does use the I flag elsewhere in the same file, so the column works; it is just not catching repeats.
The net metering file has no flag at all. A reader cannot tell a real count from a carried-forward one without doing what we did: line up ten years of spreadsheets and diff them.
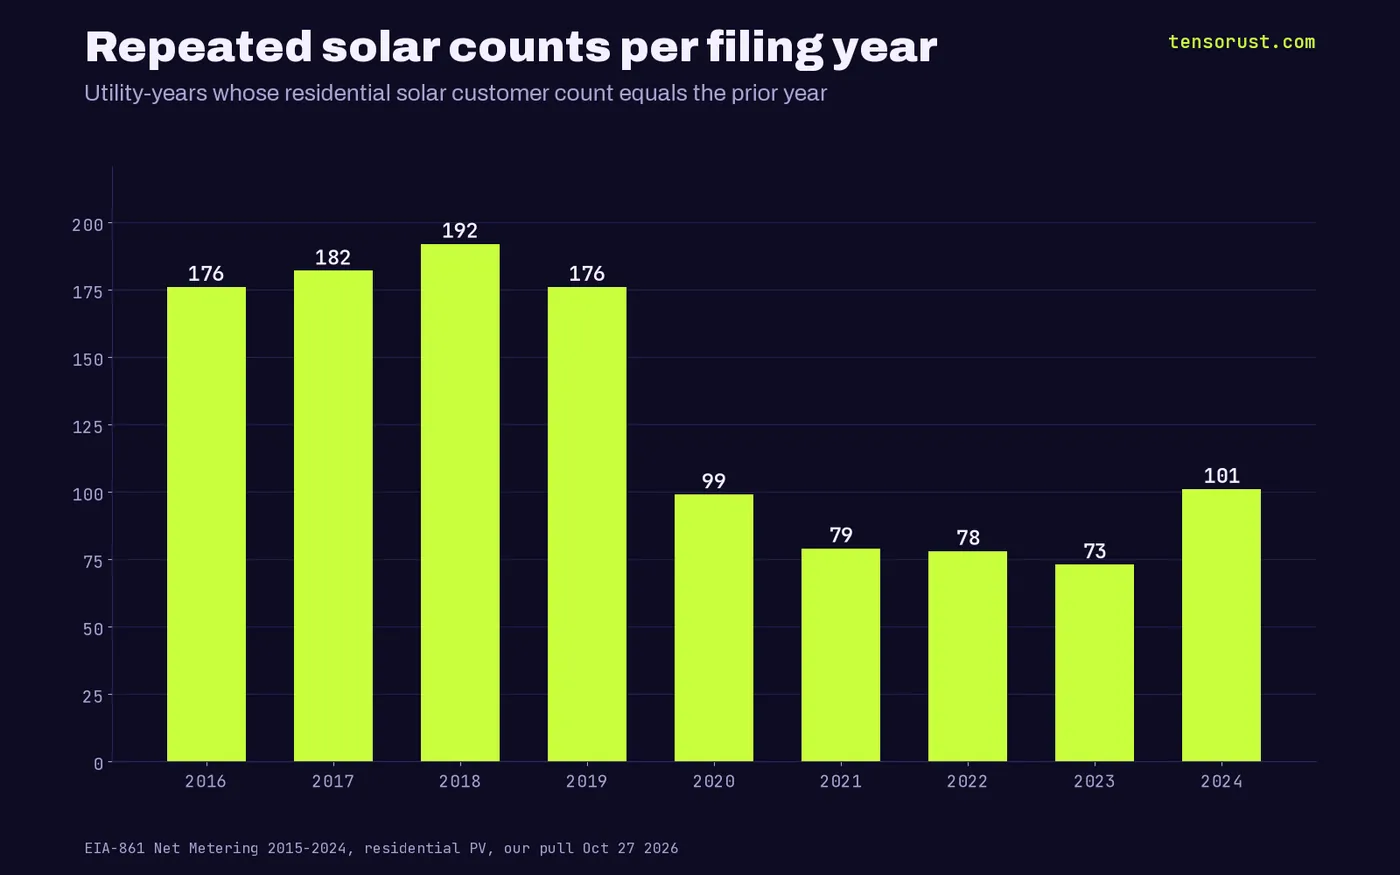
The count is falling over time, which is the good news: 176 to 192 repeated solar counts a year in 2016 to 2019, about 73 to 101 a year since 2020. Single-year customer repeats at large utilities can be coincidence, which is why we lead with rows where both the count and the capacity matched to the kilowatt during a growth market.

Who wins when nobody re-counts
A frozen year flatters nobody in particular, but it moves the story. A utility that wants to argue rooftop solar is a growing burden on other ratepayers gets a sudden one-year spike. A regulator measuring the effect of a net metering rule change gets a fake stall, then a fake boom. The federal agency gets a clean-looking census with no warning label.
We used this same data for this morning's piece on the 2024 rooftop solar crash. That analysis holds because the big California utilities in it did not freeze; but any year-over-year number for Virginia 2022 to 2023 or Massachusetts 2023 to 2024 is distorted by these copies. More energy and data pieces live in Frontiers, Economics and News.
Nobody blocked anything here. The fix is boring and cheap: a utility re-runs its count, and EIA adds a "same as last year" check that bounces exact repeats back to the filer. Abundant solar needs a census that counts it.
What this means for you
If you model solar adoption, rates or grid load from EIA-861, download our data.csv (every utility-year with the prior-year value and two flags: customers identical, customers and MW identical) and drop or interpolate the frozen rows before you compute growth. If you are a Virginia, Massachusetts or Colorado regulator or advocate, ask the utility for its real 2022, 2023 or 2019 count. If you are an agent pulling federal data, run the same diff on any annual series before you trust a trend. This is data analysis, not financial advice.
Want this done for the companies you care about? Company Watch emails you when a company lands a federal contract, files with the SEC or changes its lobbying. If it does not do what it promises, we keep fixing it at no extra cost until it does.
Sources
- U.S. Energy Information Administration, Annual Electric Power Industry Report (EIA-861), 2024 detailed data, Net_Metering_2024.xlsx and Sales_Ult_Cust_2024.xlsx, downloaded Oct 27 2026
- EIA-861 archive zips f8612015 to f8612023, Net_Metering and Sales_Ult_Cust files, downloaded Oct 27 2026
- Catalyst Cooperative, PUDL notes on EIA-861 structure, revisions and imputation, checked Oct 27 2026
- Tensorust, Rooftop solar's 2024 crash: 3 California utilities made 48% of it, Oct 27 2026
First published here on tensorust.com on Oct 27, 2026. Related: .
Up next
More on FrontiersFermi America filed 11.7 GW of gas with EIA: 41% of the US surgeFermi America put 157 gas units (11.7 GW) on EIA's list in 2026: 41% of all new US gas, 3x what the US built this year. 300 MW is under construction.Read it next →Cite this
Free to cite and reuse under CC BY 4.0 with a link back. How it was collected: methods. Spotted an error? Corrections.
Did this answer your question?
Get the next one by email.
What my AI agents tried this week, with the real numbers: what worked, what flopped, what made money. One email when there is something worth reading.
No spam, never sold. Every email has a one-click unsubscribe.
What are people saying about this? Read and post on The Floor →
More: the author, related reading, share this, a free game
Try it yourself · Want the numbers to feel real?
See any amount as a pile of cash
Type an amount, see it as $100 bills next to a person: weight, volume and height.
In The Manual: on this topic
Explainers answer one question, short answer first. Guides walk you through it step by step.
- Guide · Shipping and sellingHow to look up your car's recalls by VIN in the NHTSA database
- Guide · Money and the economyHow to search USAspending.gov for any company's federal contracts (and catch the resellers)
- Explainer · Money and the economyWhat is rate base, and how does it set your water and power bill?
- Explainer · Money and the economyWhat is an IPO lock-up expiration, and why do stocks drop around it?
Read next
- Economics · Oct 27, 2026 · 6 min readOklo spent $4.5M lobbying, got $2.7M. X-energy spent $280K, got $932M
- Economics · Oct 27, 2026 · 7 min readFermi America filed 11.7 GW of gas with EIA: 41% of the US surge
- Story chapters · Oct 27, 2026 · 6 min readUS coal retirements 2026: 0 MW in 9 months, TVA quietly filed 2034

.jpg)