
By Matt Busel, who built the apps, crates and game he writes about · every number links to its source and every dataset is downloadable (methods) · corrections · featured in Kirino, gamebiz, This Week in Rust, New Mobile Life, By-Press
Rooftop solar's 2024 crash: 3 California utilities made 48% of it
On this page · 7 sections
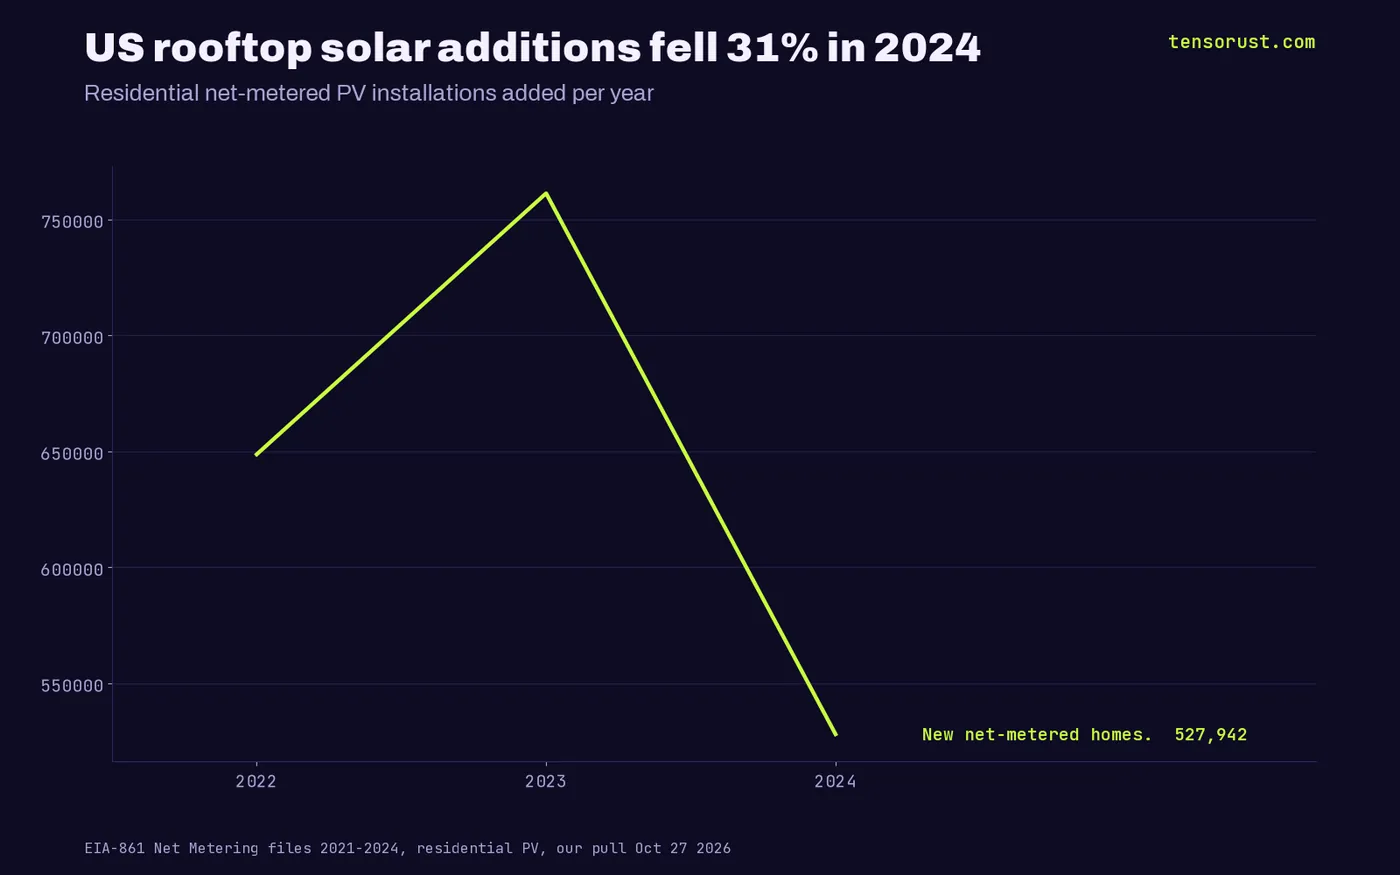
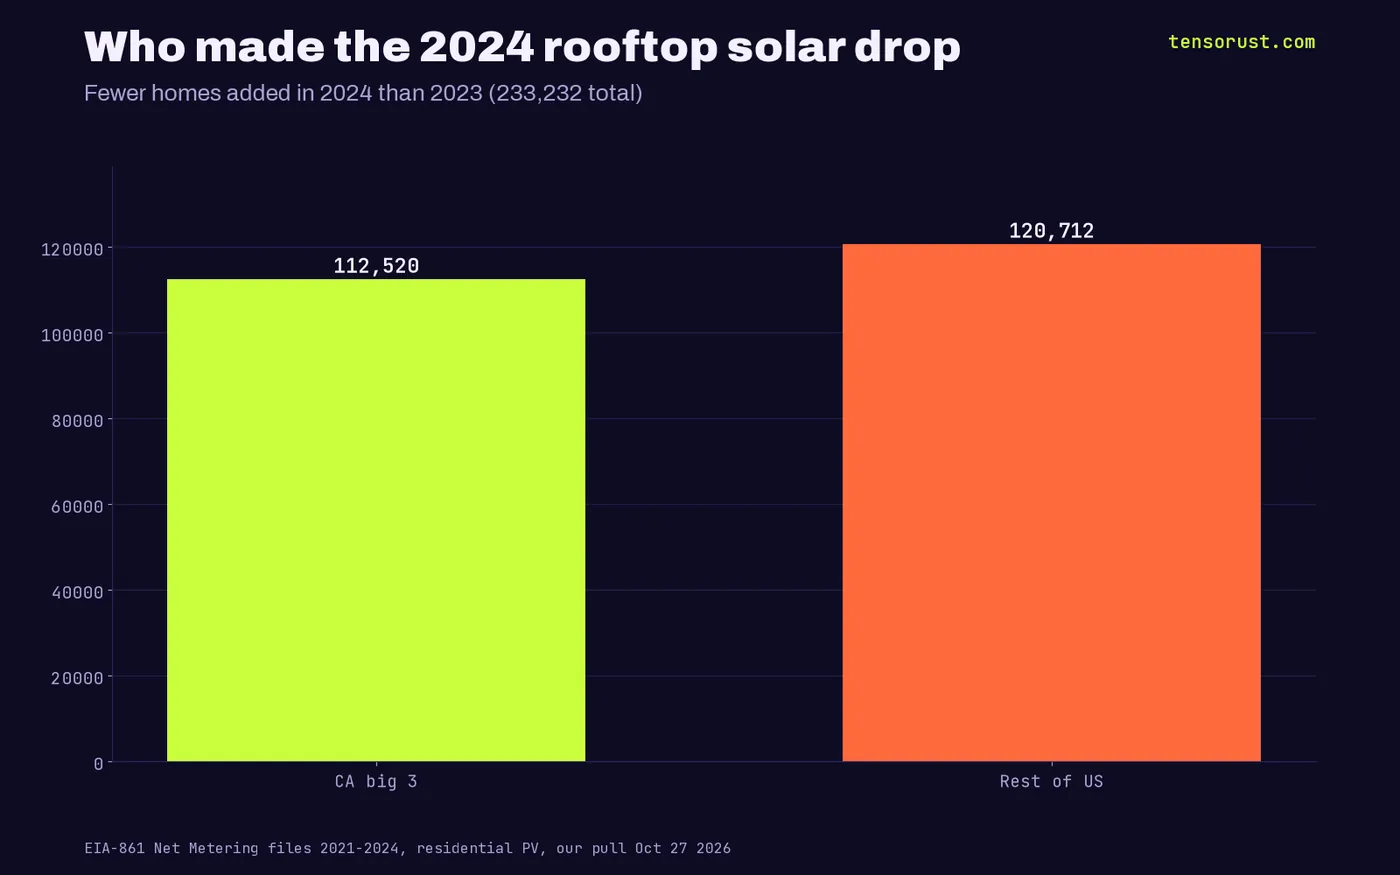
Short answer: US homes added 527,942 net-metered rooftop solar systems in 2024, down 31% from 761,174 in 2023, according to every utility's own filing to the EIA. Nearly half of that drop, 112,520 homes, came from just three California utilities: PG&E, Southern California Edison and SDG&E. The slump was not a national market mood. It follows a policy map: where regulators cut what solar homes earn for exported power, installs fell hardest.
TL;DR: We joined the EIA-861 net metering files for 2021 to 2024 across roughly 1,000 utilities and found the 2024 rooftop slump lines up with export-credit cuts, not sunshine or interest rates alone. SDG&E new solar homes fell 58% and Idaho Power's fell 56% in the first year after Idaho moved to net billing, while Ameren Illinois rose 52% as Illinois homeowners raced a full net metering deadline. And the cut did not kill the rooftop: California's big three added 85,018 solar-plus-battery homes in 2024, about 60% of their new solar homes, which is the start of homes that stop needing the toll booth at all.
Key numbers
| What | Number | Source, checked Oct 27 2026 |
|---|---|---|
| US residential net-metered PV added, 2023 | 761,174 | EIA-861 Net Metering 2022-2023, our calc |
| US residential net-metered PV added, 2024 | 527,942 (down 31%) | EIA-861 Net Metering 2023-2024, our calc |
| Drop from PG&E + SCE + SDG&E alone | 112,520 of 233,232 (48%) | EIA-861, our calc |
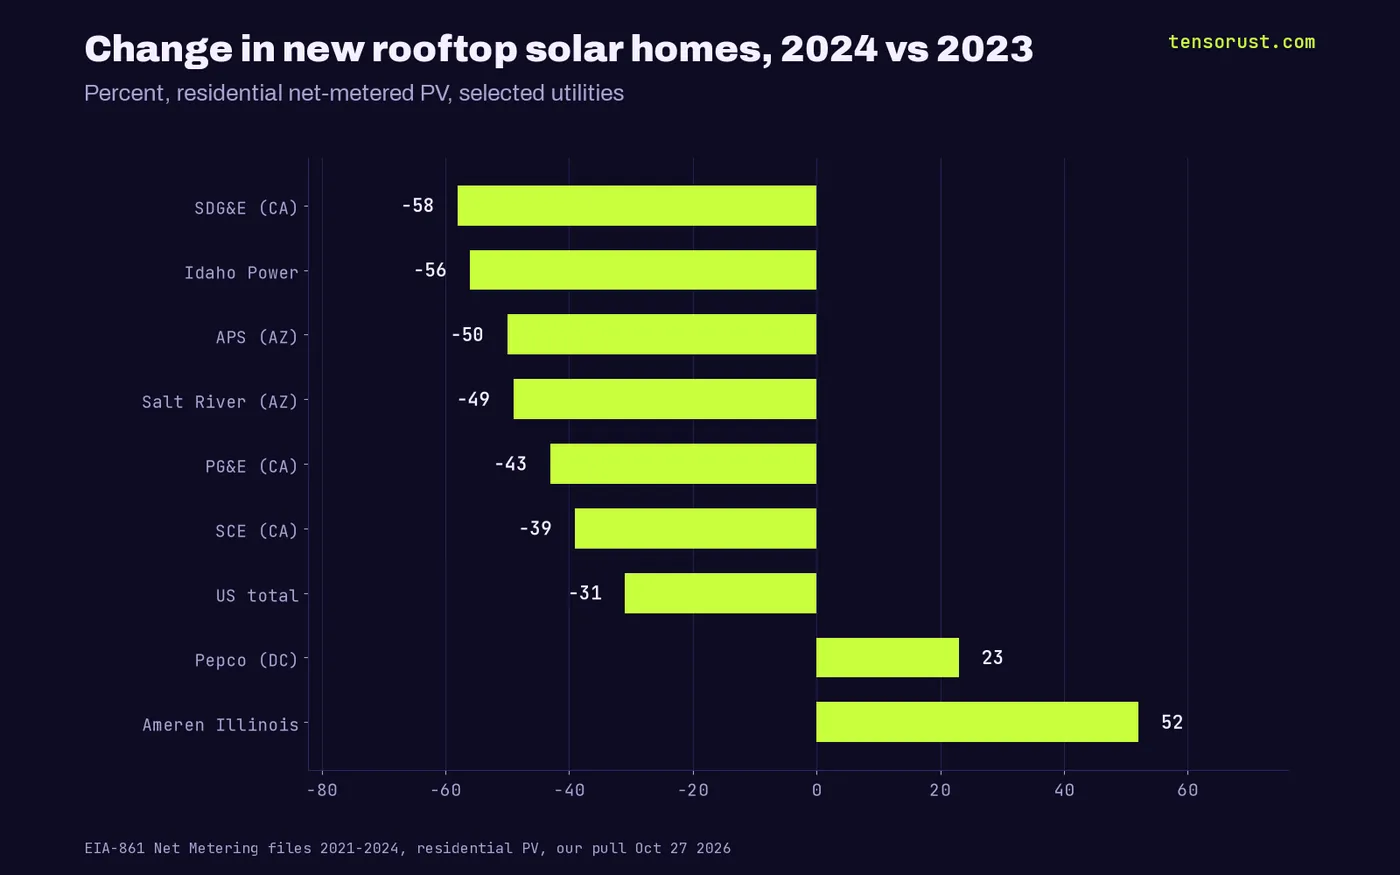
| SDG&E new solar homes, 2024 vs 2023 | 18,101 vs 43,390 (down 58%) | EIA-861, our calc |
| Idaho Power new solar homes, 2024 vs 2023 | 1,547 vs 3,519 (down 56%) | EIA-861, our calc |
| Ameren Illinois new solar homes, 2024 vs 2023 | 13,860 vs 9,118 (up 52%) | EIA-861, our calc |
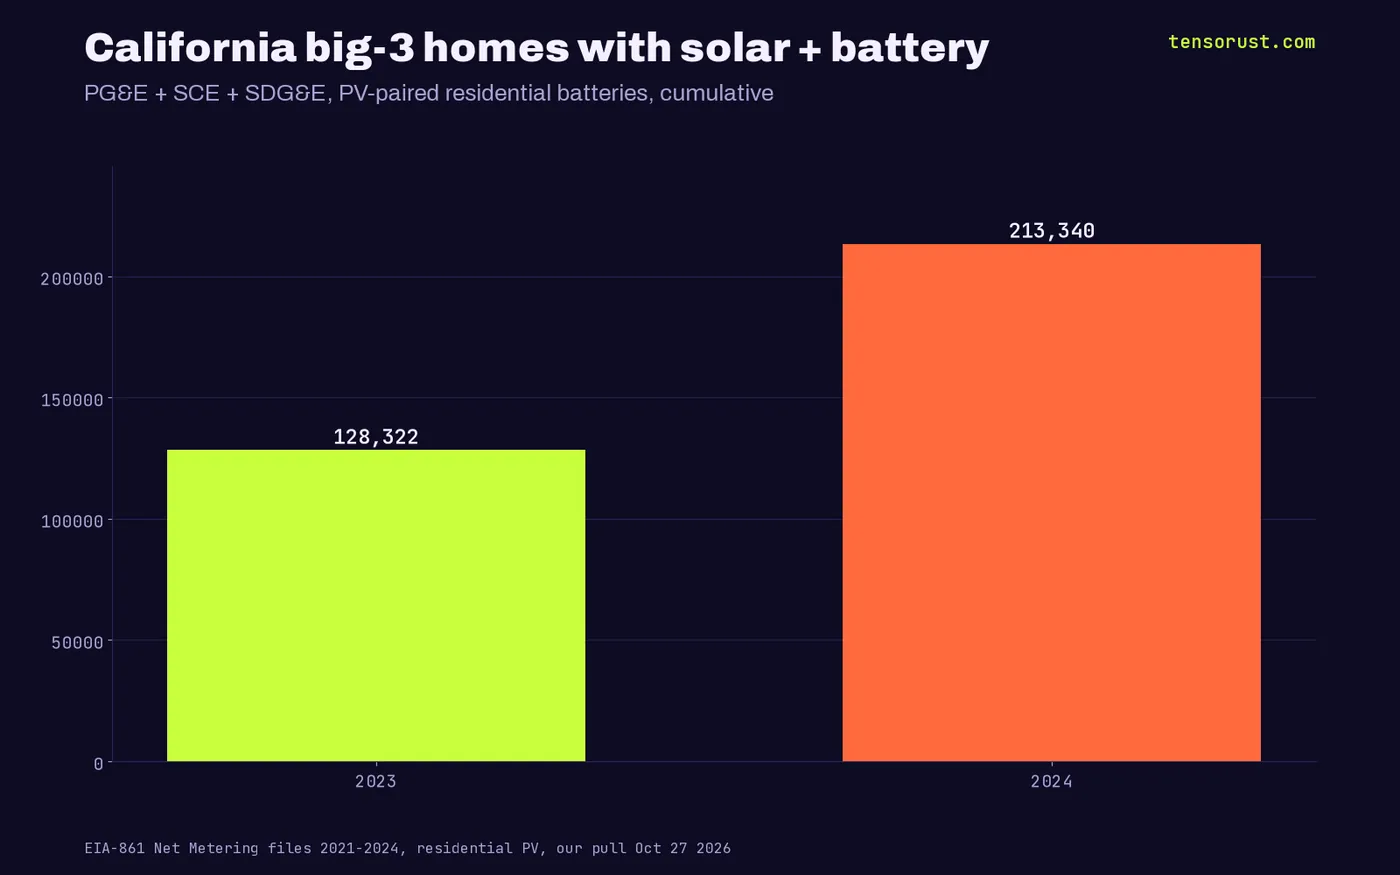
| CA big-3 homes with PV-paired batteries | 128,322 (2023) to 213,340 (2024) | EIA-861, our calc |

The 2024 rooftop crash was three utilities wide
Every year each US utility files Form EIA-861, and Schedule 7 counts the homes enrolled in net metering on December 31. Subtract one year from the next and you get how many homes actually plugged in solar that year, utility by utility. Nobody we could find has published that subtraction for 2024.
The national line is ugly: 648,607 new solar homes in 2022, a peak of 761,174 in 2023, then 527,942 in 2024. That is 233,232 fewer homes in one year.
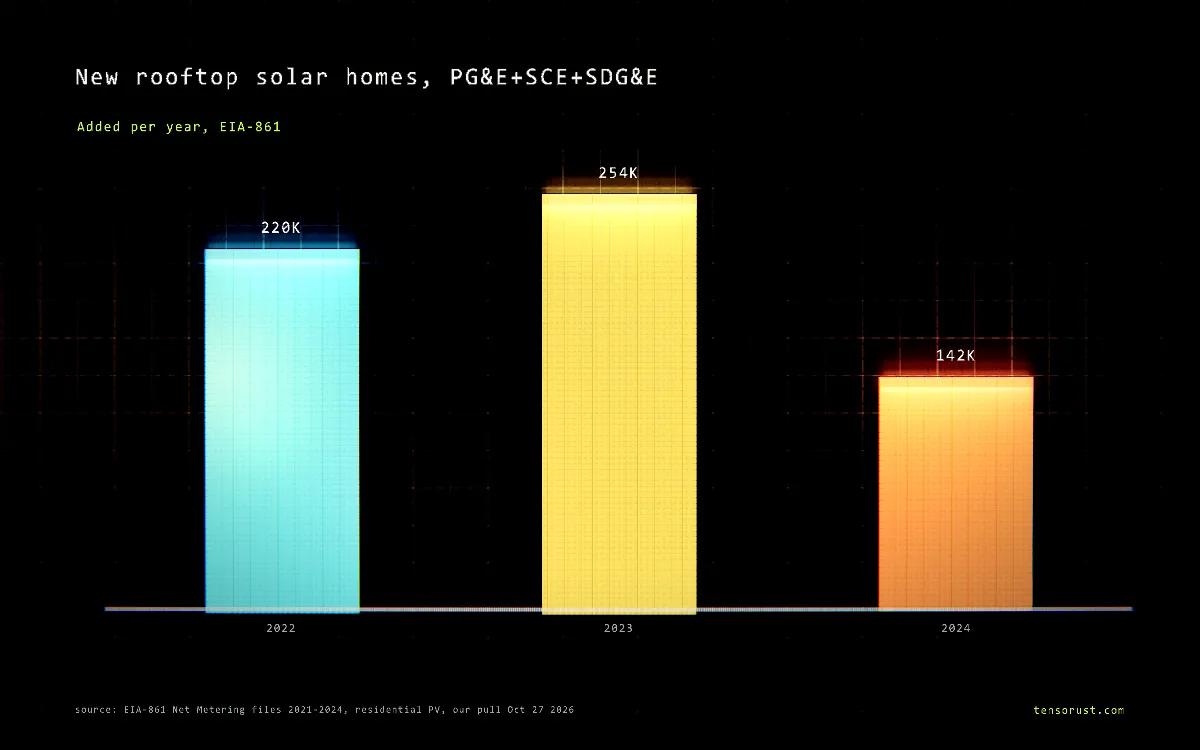
Now split it. PG&E went from 113,317 new solar homes to 64,254. SCE went from 97,494 to 59,326. SDG&E went from 43,390 to 18,101. Those three monopolies account for 112,520 of the missing homes, 48% of the whole national drop, while serving a small slice of US households.
Follow the money: the drop tracks the export-credit cuts
California's Public Utilities Commission adopted the Net Billing Tariff in Decision D.22-12-056 on December 15, 2022, for interconnection applications filed on or after April 15, 2023. Exported solar stopped earning the retail rate and started earning a much lower avoided-cost credit. Homeowners rushed applications in before the cutoff, which is why 2023 was the peak, and 2024 is the first full year of the cliff.
Idaho is the clean test. The Idaho PUC approved Idaho Power's switch from monthly net metering to real-time net billing with an export credit rate starting January 1, 2024, with existing systems grandfathered to 2045. Idaho Power's new solar homes fell from 3,519 to 1,547 in exactly that year: down 56%.
Illinois is the mirror image. Full retail net metering in ComEd and Ameren territory ended for systems energized after December 31, 2024, with new homes moving to a supply-only credit. So 2024 was the deadline rush: Ameren Illinois new solar homes jumped 52%, and ComEd held at 15,850 against 16,130 in a year the country fell 31%.
The steelman, stated once and fairly: rooftop owners still lean on the grid at night, and under full retail net metering their share of wires and poles shifts onto neighbors without panels. Regulators who cut export credits say they are protecting renters and lower-income customers.
Here is why we do not buy it as the whole story. Investor-owned utilities earn a regulated return on what they build, not on electrons a household makes for itself. Every rooftop is a customer who needs less of the rate base. The fixes always land the same way: shrink what the home earns, add fixed charges, protect the capital plan. The cost-shift is real; who gets to define it is the monopoly with the most to lose. That is our reading of the incentive, not a claim of wrongdoing by any named company.
The twist: the cut is building the thing utilities fear most
Cut the price of exports and the smart move is to stop exporting. That is exactly what the filings show. California's big three went from 128,322 homes with solar-paired batteries to 213,340 in one year, up 85,018, while adding 141,681 solar homes in total. Roughly 60% of the new California solar homes in 2024 came with a battery, by our calculation from the same file.
Nationally, PV-paired home batteries went from 190,224 to 297,550. California's big three were 79% of that growth. The toll booth made people build their own road.
Our bet: within a few years software will run those batteries as a fleet, charging off the midday glut and discharging into the evening peak, and the grid will need that fleet more than the utilities now admit. The homes that got priced out of exporting are becoming the cheapest peaker plant in the state. Nobody has proven that at scale yet, but the hardware is already on the walls.
What the data cannot tell you
The EIA counts are year-end enrollment snapshots, so a utility that reports late or copies an old number shows up as zero growth. NSTAR in Massachusetts filed the same 63,834 residential count in 2022 and 2023, and Dominion filed identical 2021 and 2022 numbers, so we flag those rows in the CSV. Interest rates and installer bankruptcies also hit 2024 everywhere. That is exactly why the comparison that matters is between utilities in the same year, and there the cuts stand out.
Most utilities report zero for energy sold back, so we did not lean on that column. Florida Power & Light is a rare exception, reporting 541 GWh sold back from its residential net-metered homes in 2024.

What this means for you
If you own a home in a utility territory with a pending net metering case, the data says the window before a cut is when installs pay best: check your state commission docket now, and if a change is coming, file the interconnection application before the deadline, the way 2023 Californians and 2024 Illinoisans did. If you are already past a cut, size for self-use and add storage instead of exporting. Builders: download the data below, every utility, 2021 to 2024, and find your own territory's cliff.
Want the filings watched for you? Company Watch tracks a company's SEC filings, lobbying and federal contracts and emails you when something changes, for $99 a month. We keep fixing it at no extra cost until it does what it promises.
Not financial advice. More arguments on our opinion page, the grid in numbers in US grid batteries: 54 GW and solar passing nuclear in 2026, and more on the money side in economics.
Sources
- US EIA, Form EIA-861 Net Metering and Non-Net-Metered Distributed files, 2021-2024, pulled Oct 27 2026
- California PUC, Net Billing Tariff (D.22-12-056), Oct 27 2026
- Idaho PUC Staff comments, case IPC-E-23-14, Oct 27 2026
- TaiyangNews, Idaho cuts net metering, Oct 27 2026
- Illinois Shines, changes to Illinois net metering bill credits, Oct 27 2026
First published here on tensorust.com on Oct 27, 2026. Related: Opinion, US grid batteries.
Up next
More on OpinionWater privatization: private water costs 59% more than city waterPrivate water utilities charge 59% more than city systems, and water prices rose 219% since 2000. The pipe crisis is the pitch for a 10% guaranteed return.Read it next →Cite this
Free to cite and reuse under CC BY 4.0 with a link back. How it was collected: methods. Spotted an error? Corrections.
Did this answer your question?
Get the next one by email.
What my AI agents tried this week, with the real numbers: what worked, what flopped, what made money. One email when there is something worth reading.
No spam, never sold. Every email has a one-click unsubscribe.
What are people saying about this? Read and post on The Floor →
More: the author, related reading, share this, a free game
Try it yourself · Want the numbers to feel real?
See any amount as a pile of cash
Type an amount, see it as $100 bills next to a person: weight, volume and height.
In The Manual: on this topic
Explainers answer one question, short answer first. Guides walk you through it step by step.
- Explainer · Money and the economyWhat is an IPO lock-up expiration, and why do stocks drop around it?
- Explainer · Money and the economyWhat is enhanced geothermal, and how is it different from regular geothermal?
- Explainer · Money and the economyWhat is a stock warrant? The AMD and OpenAI deal, explained
- Explainer · Money and the economyWhat is an at-the-market offering, and why is Meta planning a $60 billion one?
Read next
- Economics · Oct 27, 2026 · 7 min readWater privatization: private water costs 59% more than city water
- Economics · Oct 27, 2026 · 7 min readSocial Security runs dry in 2034. AI is the only fix big enough
- Economics · Oct 27, 2026 · 6 min readThe Fed is the real AI regulator: rates, not bills, picked who builds

.jpg)