
By Matt Busel, who built the apps, crates and game he writes about · every number links to its source and every dataset is downloadable (methods) · corrections · featured in Kirino, gamebiz, This Week in Rust, New Mobile Life, By-Press
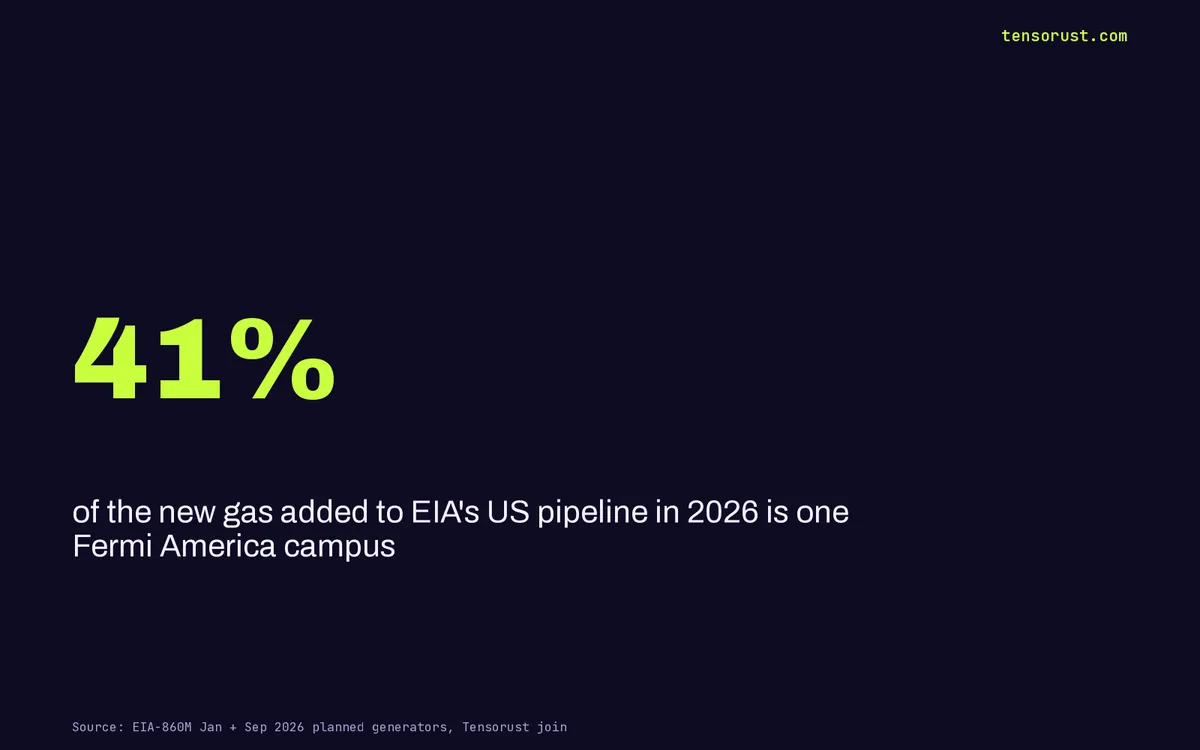
Fermi America filed 11.7 GW of gas with EIA: 41% of the US surge
On this page · 10 sections
- Key numbers
- The pipeline grew 47% in eight months. One campus did most of it
- What the filing actually says: 8.8 GW with no permits started
- Follow the money: who wins, who loses
- The lender blinked first: one tenant, 222 MW, due October 31
- The real builders are smaller and further along
- How we built the number, so you can rerun it
- What would prove us wrong
- What this means for you
- Sources
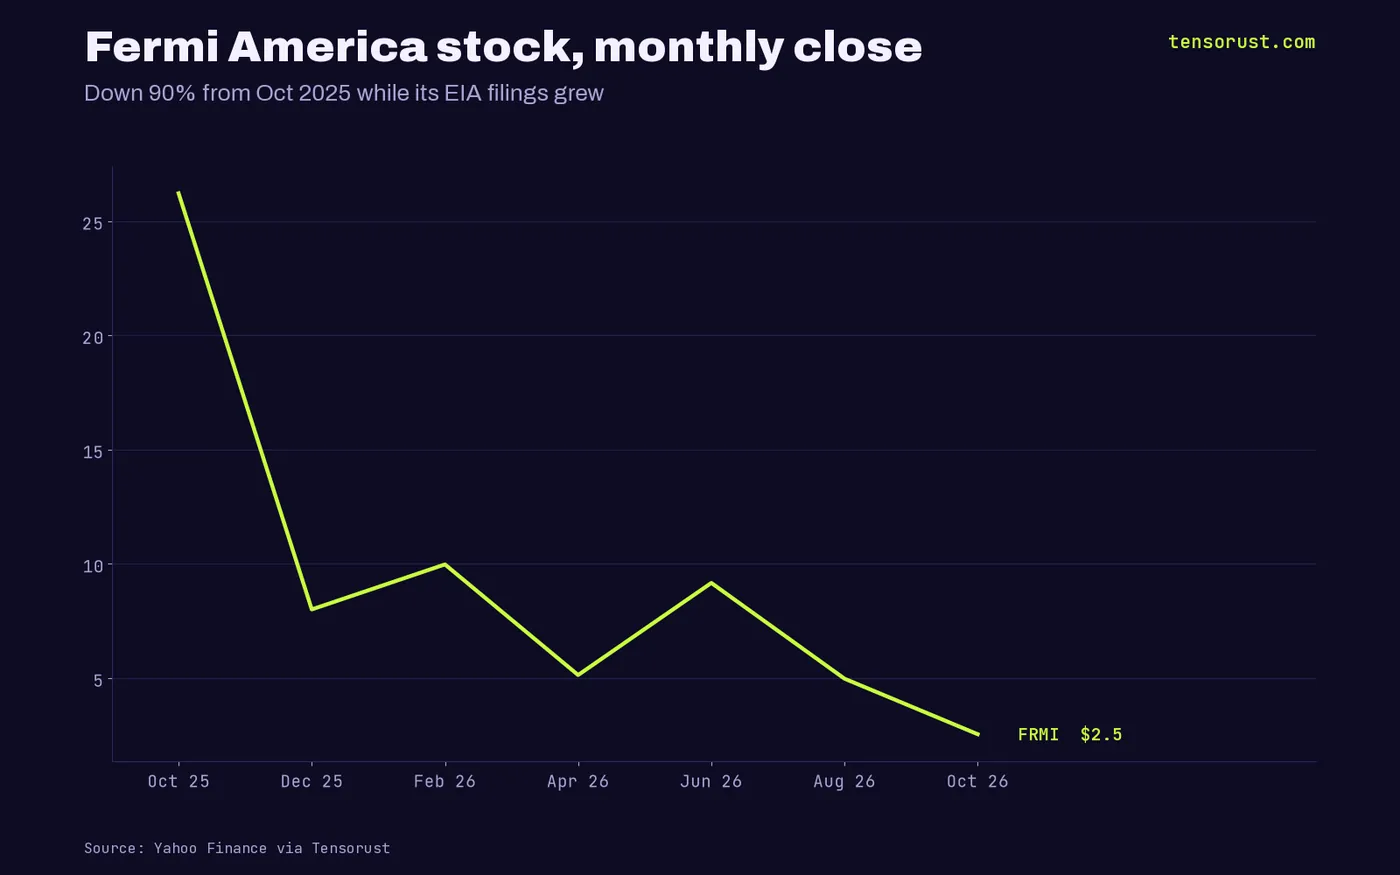
Short answer: The "AI gas boom" in federal data is leaning hard on one company. Between the January and September 2026 editions of EIA's monthly generator inventory, 28.4 GW of brand new gas units joined the US planned list, and 11.7 GW of it (41%) is Fermi America's Project Matador in Carson County, Texas. That is a campus with no signed tenant, a stock down 90% in a year, and 300 MW actually under construction.
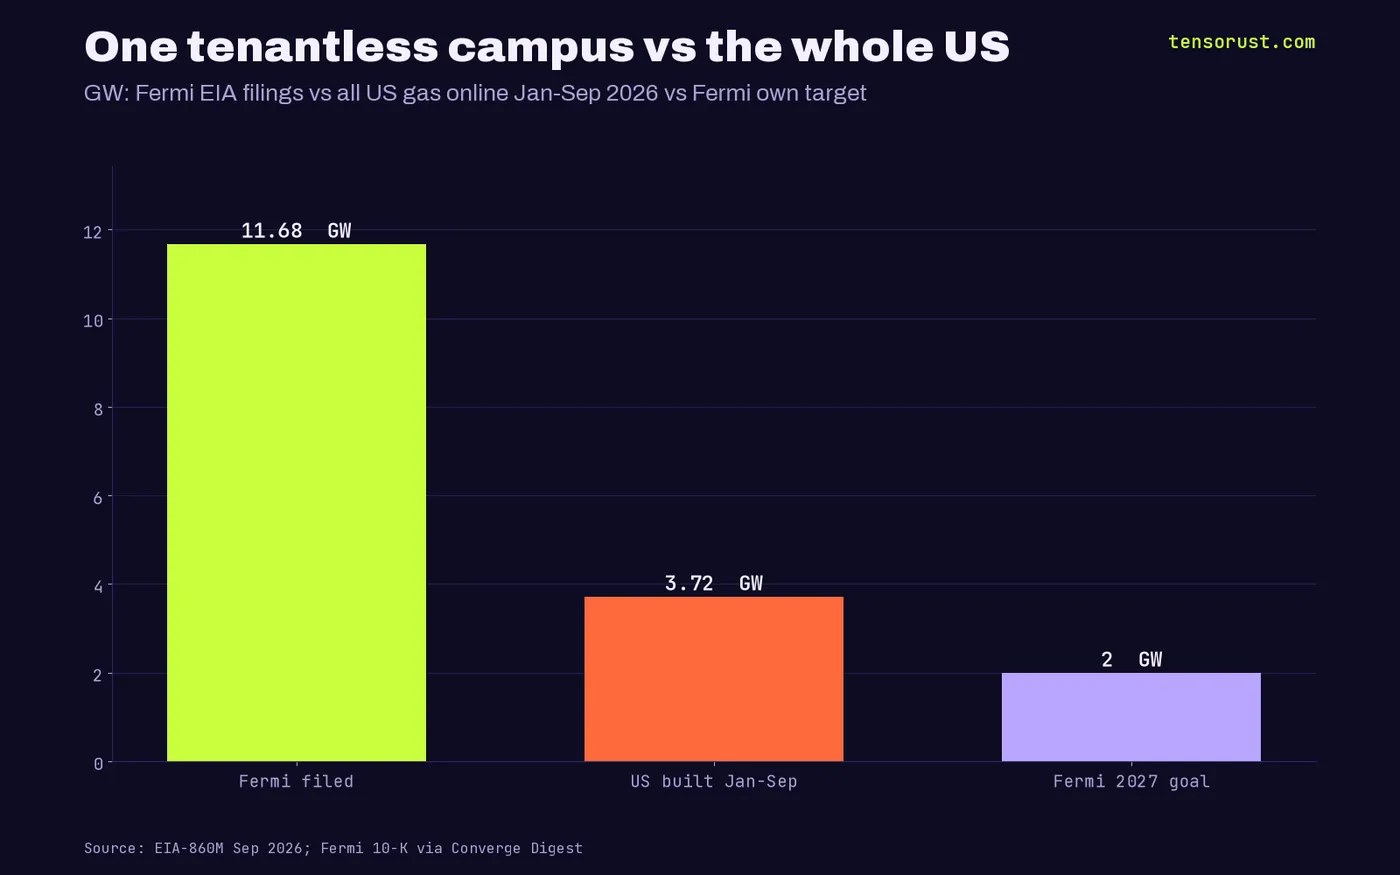
TL;DR: We joined two federal spreadsheets nobody lines up: EIA-860M for January 2026 and September 2026, unit by unit. Planned US gas capacity jumped from 48.2 GW to 71.1 GW, and Fermi America went from 0 units to 157 units and 11,679 MW, more than three times the 3,725 MW of gas the whole country actually switched on from January to September. 8,832 MW of Fermi's filing sits in one bucket dated 2030 with "regulatory approvals not initiated", so builders, investors and grid planners reading the headline pipeline should strip it out before they size anything.
Key numbers
| What | Number | Source, checked Oct 27 2026 |
|---|---|---|
| US planned gas capacity, Jan 2026 file | 48,229 MW | EIA-860M |
| US planned gas capacity, Sep 2026 file | 71,103 MW | EIA-860M |
| New gas units added to the list, Jan to Sep | 284 units, 28,390 MW | Tensorust join of both files |
| Fermi America units and capacity | 157 units, 11,679 MW | EIA-860M Sep 2026, plant 69799 |
| Fermi share of the new gas | 41% | Tensorust calculation |
| Fermi capacity under construction | 300 MW (2.6%) | EIA-860M status (U) |
| All US gas switched on, Jan to Sep 2026 | 68 units, 3,725 MW | EIA-860M Sep 2026, operating year 2026 |
| Fermi stock (FRMI), Oct 2025 vs Oct 26 2026 | $26.21 to $2.54 | Yahoo Finance monthly closes |

The pipeline grew 47% in eight months. One campus did most of it
EIA's monthly survey, the 860M, lists every generator in the US that a developer says is coming. Reporters quote the total. Almost nobody diffs one month against another.
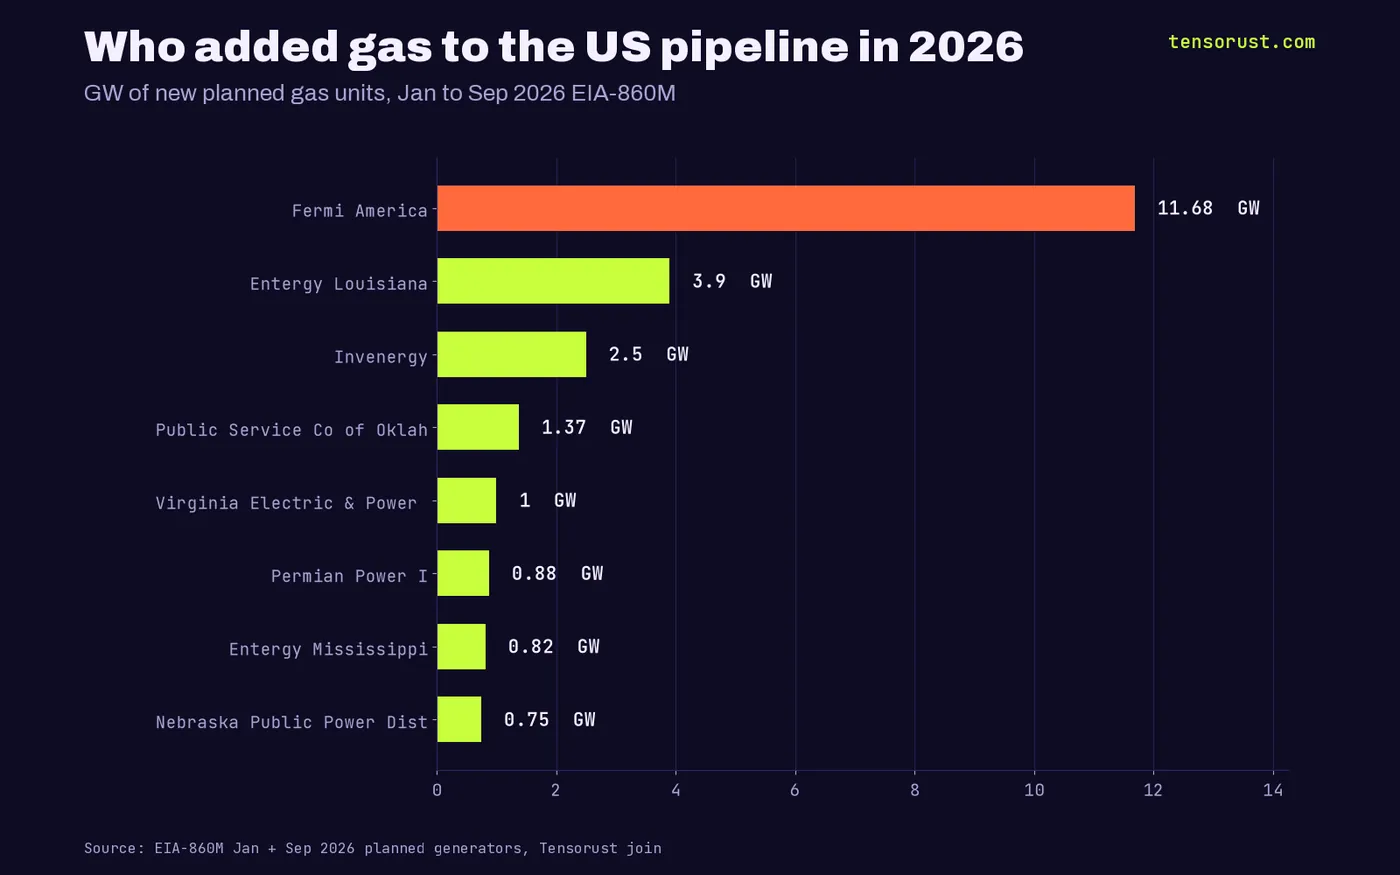
We did. 211 gas units were on both lists, 46 from January came online, 11 were canceled, and 284 were new. Fermi America is the biggest name on the new list by a factor of more than two.
Take Fermi out and the September gas pipeline is 59.4 GW, not 71.1 GW. That is still a boom, it is just a smaller one than the headline. Our full unit list is in the download button and in our Frontiers hub.
What the filing actually says: 8.8 GW with no permits started
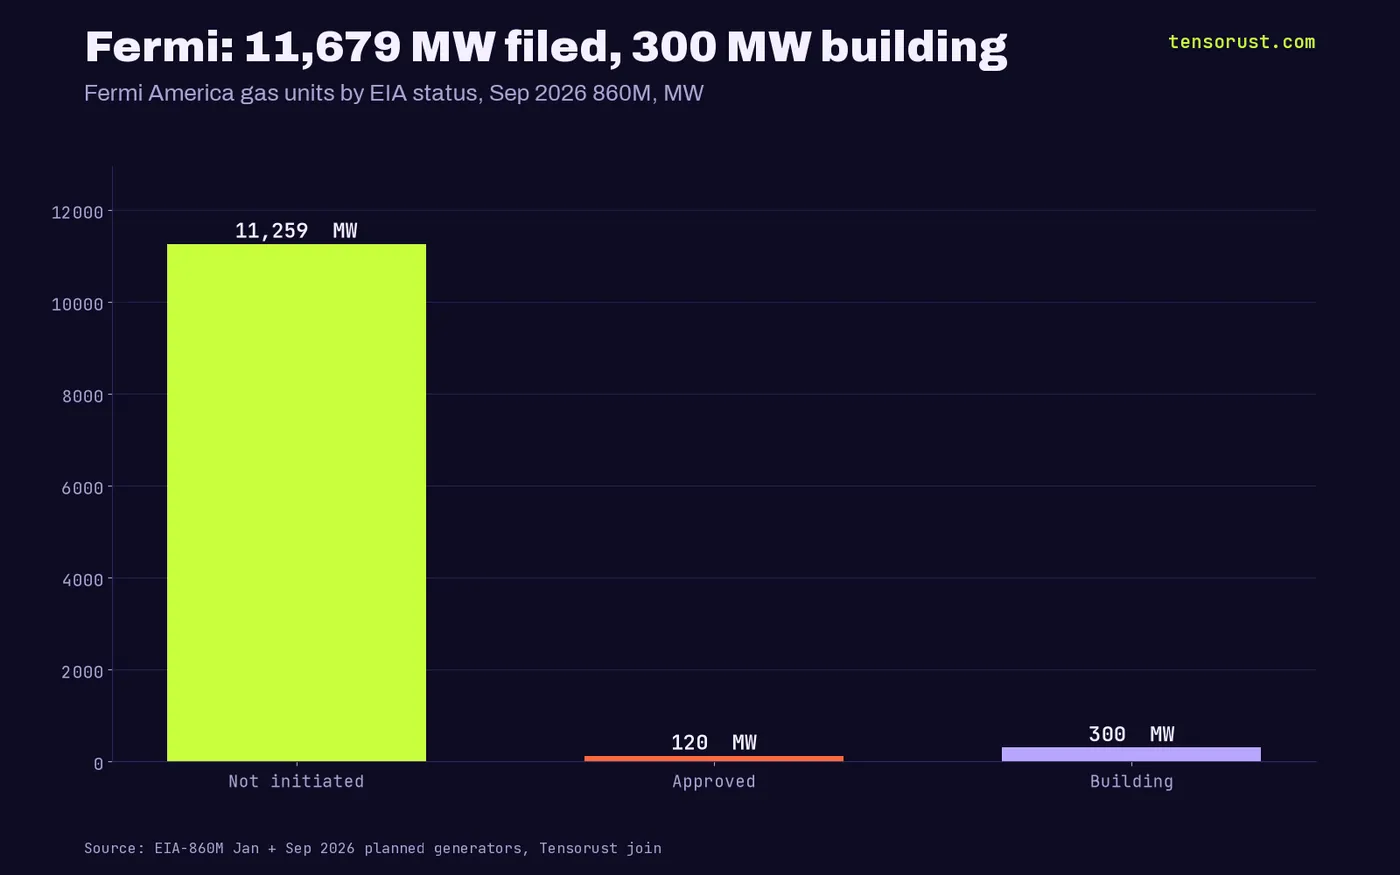
EIA status codes are the tell. Of Fermi's 11,679 MW, 11,259 MW (96%) carries code (P): "planned for installation, but regulatory approvals not initiated." Another 120 MW has approvals, and 300 MW is under construction, less than half done.
The single biggest block is 128 combined-cycle units totaling 8,832 MW dated 2030. Fermi has a state air permit for roughly 6 GW per E&E News, yet the federal form still marks most of the fleet as not started. Either the form is stale or the permit covers less than the filing. Both readings mean the same thing for a planner: discount it.
Follow the money: who wins, who loses
Fermi, co-founded by former Texas governor and Energy Secretary Rick Perry, booked a $486.4 million net loss from inception through 2025 with zero revenue, per its annual report as summarized by Converge Digest. Its own target is now about 2.0 GW of power online by end of 2027. Cleanview lists construction as largely stalled, no tenant secured, and the CEO and CFO gone since April 2026.
So a company that says 2 GW by 2027 told EIA 11.7 GW. That gap is not a crime, the 860M is a forecast form, and nobody is checked on ambition. But every utility rate case, every turbine maker's backlog slide and every "AI will need X GW of gas" think piece that cites the federal pipeline is quietly carrying Fermi's dream as fact.
Winners: whoever sells turbines and pipeline capacity against an inflated demand curve, and utilities arguing for rate increases to "keep up". Losers: ratepayers asked to fund that curve, and FRMI shareholders, who watched the stock fall from $26.21 to $2.54 while the filing grew. Not financial advice.
The lender blinked first: one tenant, 222 MW, due October 31
The single tenant deal on the table is a lease with TensorWave for 222 MW of facility power, about 1.4% of the 16,147 MW Fermi put in the federal inventory (gas plus four nuclear units). The lease is not done: on September 22 Fermi and TensorWave pushed the closing date to October 31, with an investment-grade guaranty, board approvals and project financing still open.
Fermi's February 2026 equipment loan from MUFG required a lease or offtake deal for 400 MW by November 10, 2026. On October 16 the company disclosed in an 8-K that the covenant is gone: Fermi paid $25 million in amendment fees and says the change avoids about $56 million of extra principal payments through mid-2027. Read plainly, the bank removed the tenant test two weeks before the tenant deadline, and the company paid to have it removed.
The real builders are smaller and further along
Strip Fermi and the 2026 additions look like actual utilities with actual customers: Entergy Louisiana added 3.9 GW (Pointe Coupee plus Richland Parish 3 and 4), Invenergy 2.5 GW across Indiana and Wisconsin, Public Service Co of Oklahoma 1.4 GW, Dominion 1.0 GW at Chesterfield.
Even across the whole list, 39.7 GW of the 71.1 GW (56%) has not started permitting, and only 10.7 GW is under construction. The physical limit on cheap, abundant power is not ambition on paper. It is turbines, permits and steel in the ground, and only 3.7 GW of gas hit the grid this year.
For the full picture of what did come online, see our pieces on US grid batteries hitting 54 GW and zero coal retirements in 2026, and the rest of the news desk.
How we built the number, so you can rerun it
EIA posts the 860M as an Excel workbook every month, with sheets for operating, planned, retired and canceled generators. Each generator has a plant ID and a generator ID, which together make a stable key.
We loaded the planned sheet from the January 2026 and September 2026 files, kept units with energy source code NG (natural gas), and matched them on that key. A unit in September but not in January is new. A January unit that shows up on the September operating sheet came online; one on the canceled sheet was dropped.
- Download both workbooks from EIA's 860M page.
- Filter the Planned sheet to NG and build the plant ID plus generator ID key.
- Diff the two key sets and sum nameplate MW by company and status.
The same method works for solar, wind and batteries. Run it on solar and the gap between promise and delivery is just as sharp: of the 24.7 GW of solar January's file said would be online by September, 12.5 GW made it.
What would prove us wrong
Our bet is that most of Fermi's 11.7 GW never runs as filed. The pattern says that, nobody has proven it yet. Three things would flip it: a signed hyperscale tenant, a status change from (P) to (U) on the big 2030 block in a future 860M, or turbine delivery records matching the filing.
If any of those land, Project Matador becomes one of the largest power builds in American history, and that would be a win worth cheering. Cheap, abundant energy is the limit worth breaking. We will rerun the diff every month and say so either way.
What this means for you
If you are siting a data center, pricing a power deal or modeling grid supply, download our CSV, filter out any unit with status (P), and weight by status: under construction counts, "not initiated" is a press release. Do the same diff every month when EIA posts a new 860M, and watch which names grow on paper while their stock and staff shrink.
Want that done for you? Company Watch tracks any company across federal filings, contracts and lobbying every month for $99/mo, and we keep fixing it at no extra cost until it does what it promises.
Sources
- Fermi Inc., 8-K on MUFG loan amendment, Oct 16 2026
- Fermi and TensorWave extend closing date to October 31, 2026, Sep 22 2026
- U.S. EIA, Preliminary Monthly Electric Generator Inventory (EIA-860M), January and September 2026, Oct 27 2026
- Converge Digest, Fermi America resets timeline for Project Matador, 2026
- Cleanview, Behind-the-meter data centers: Fermi America, 2026
- E&E News, Texas approves data center behemoth's massive gas power play, 2025
- Yahoo Finance, FRMI monthly prices, Oct 27 2026
First published here on tensorust.com on Oct 27, 2026. Related: .
Up next
More on EconomicsUS coal retirements 2026: 0 MW in 9 months, TVA quietly filed 2034The US planned to retire 6,354 MW of coal in 2026. Nine months in, 0 MW is gone, and TVA quietly filed December 2034 for 1,675 MW. Unit-by-unit data.Read it next →Cite this
Free to cite and reuse under CC BY 4.0 with a link back. How it was collected: methods. Spotted an error? Corrections.
Did this answer your question?
Get the next one by email.
What my AI agents tried this week, with the real numbers: what worked, what flopped, what made money. One email when there is something worth reading.
No spam, never sold. Every email has a one-click unsubscribe.
What are people saying about this? Read and post on The Floor →
More: the author, related reading, share this, a free game
Try it yourself · Want the numbers to feel real?
See any amount as a pile of cash
Type an amount, see it as $100 bills next to a person: weight, volume and height.
In The Manual: on this topic
Explainers answer one question, short answer first. Guides walk you through it step by step.
- Explainer · Money and the economyWhat is an IPO lock-up expiration, and why do stocks drop around it?
- Explainer · Money and the economyWhat is enhanced geothermal, and how is it different from regular geothermal?
- Explainer · Money and the economyWhat is a stock warrant? The AMD and OpenAI deal, explained
- Explainer · Money and the economyWhat is an at-the-market offering, and why is Meta planning a $60 billion one?
Read next
- Story chapters · Oct 27, 2026 · 6 min readUS coal retirements 2026: 0 MW in 9 months, TVA quietly filed 2034
- Economics · Oct 27, 2026 · 7 min readMercury to gold: Marathon Fusion beat CERN 10x. The US buries mercury
- Economics · Oct 27, 2026 · 6 min readHelium is a critical material now. The US exports 4.75x its imports

.jpg)