
By Matt Busel, who built the apps, crates and game he writes about · every number links to its source and every dataset is downloadable (methods) · corrections · featured in Kirino, gamebiz, This Week in Rust, New Mobile Life, By-Press
Frontdoor cut warranty payouts to 44 cents. Buybacks got the gap
On this page · 11 sections
- Key numbers
- The product got cheaper to run, not cheaper to buy
- Follow the money: where the 13 cents went
- The steelman, and why it does not save the product
- Year by year
- Why nobody noticed: the ratio is never on the sales sheet
- What a fair version would look like
- The bet: repair is a data problem, and builders can price it
- How to check us in five minutes
- What this means for you
- Sources
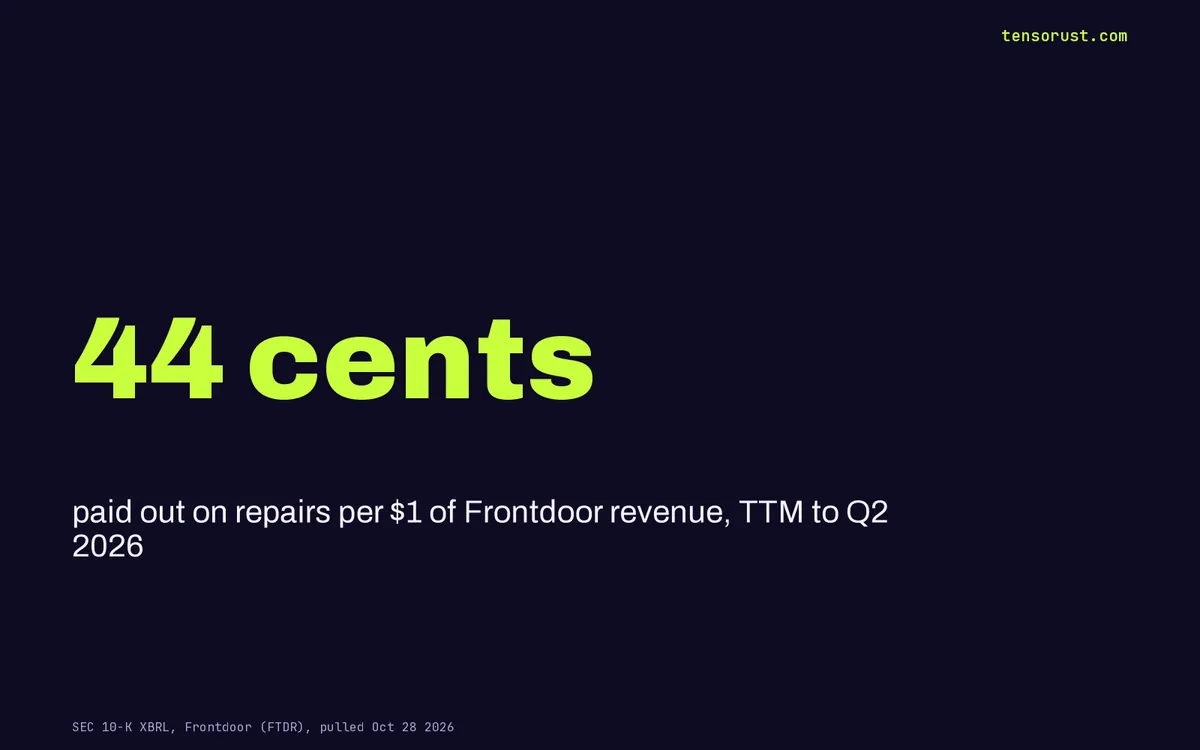
Short answer: Frontdoor, the company behind American Home Shield, spent 44.4 cents on repairs and service for every dollar it took in over the four quarters to June 2026, the lowest in its public filing history and down from 57.3 cents in 2022. Over the same stretch its stock buybacks went from $59 million a year to $300 million. A home warranty is sold as protection for the owner; the filings say the shareholder is the one getting protected.
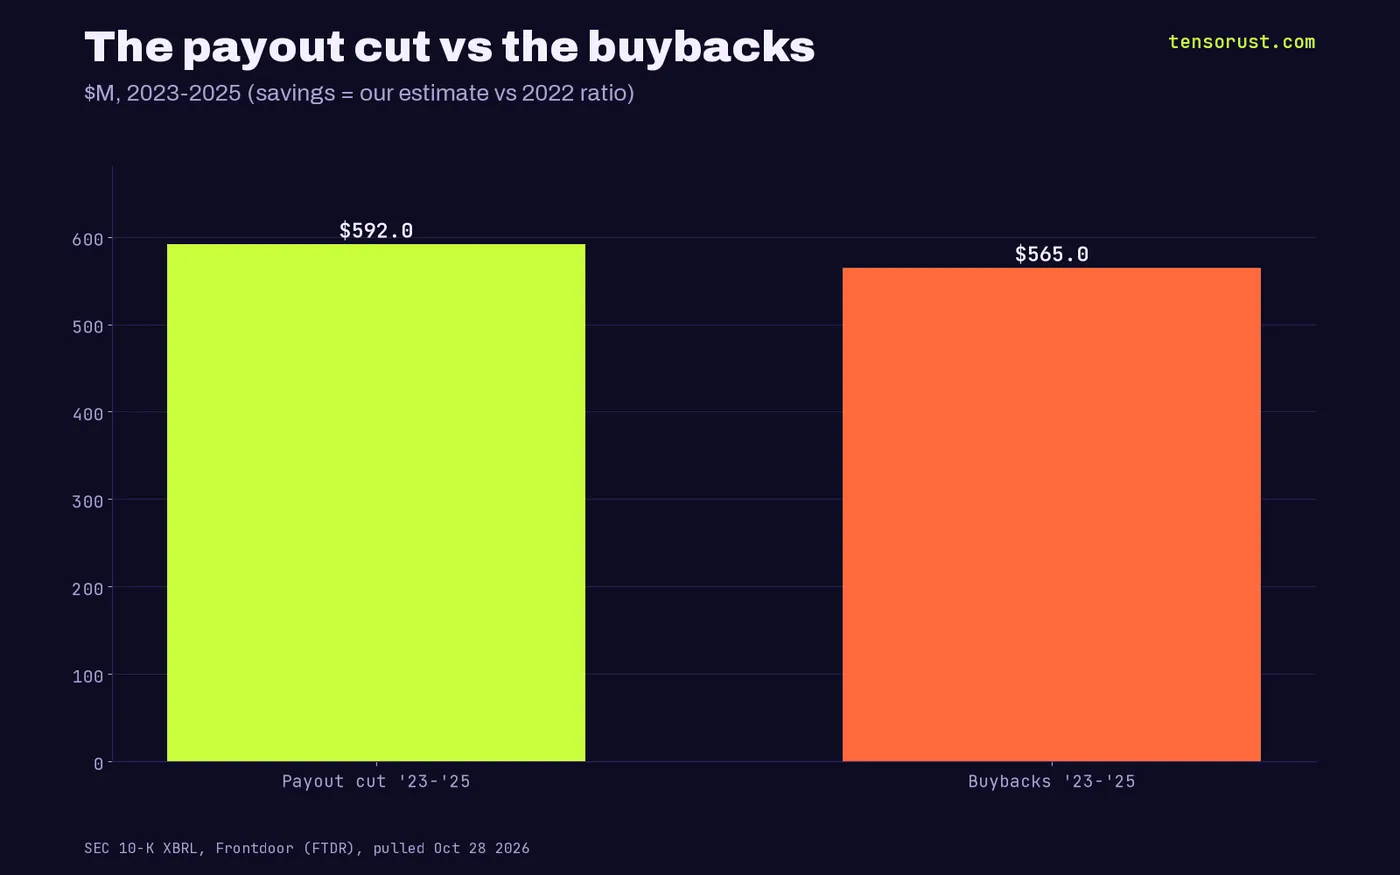
TL;DR: We pulled every Frontdoor 10-K back to 2016 from SEC XBRL and set its cost of services (what it spends sending contractors and paying claims) against revenue and buybacks; we could not find this trend published anywhere. Had Frontdoor kept paying out at its 2022 rate, it would have spent about $592 million more on homeowners from 2023 to 2025 (our estimate), and its buybacks in those three years were $565 million. Payouts per dollar fell three years in a row while revenue grew 26%, so if you are offered a warranty at closing, price it like the 44-cent product it is.
Key numbers
| What | Number | Source, checked Oct 28 2026 |
|---|---|---|
| Cost of services per $1 of revenue, TTM to Q2 2026 | 44.4 cents | SEC XBRL company facts, FTDR |
| Same ratio, 2022 | 57.3 cents | SEC XBRL |
| Same ratio, 2016-2021 range | 50.3 to 54.5 cents | SEC XBRL |
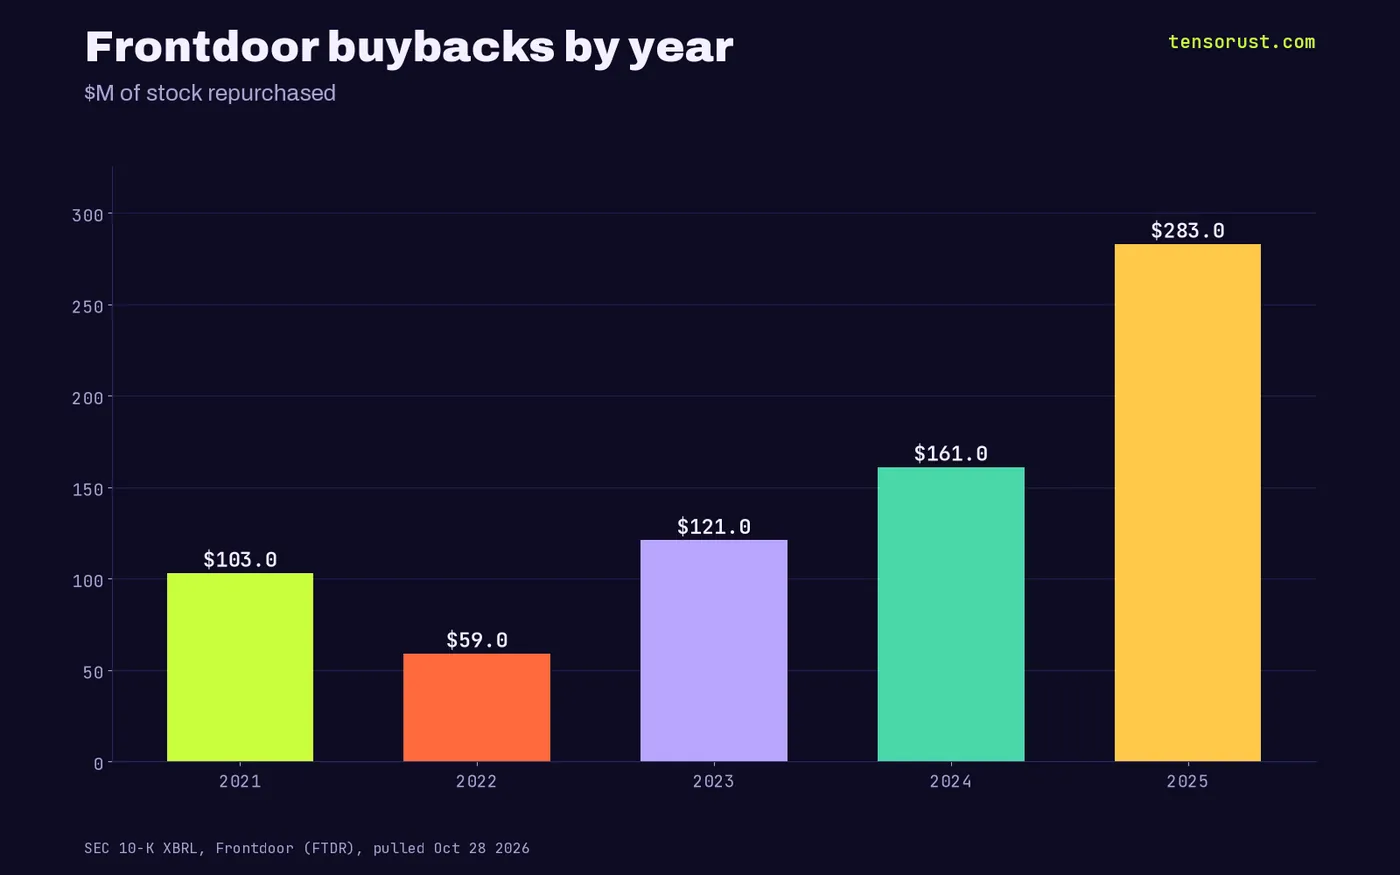
| Buybacks, 2023-2025 | $565M ($121M, $161M, $283M) | SEC XBRL |
| Extra repair spend at the 2022 ratio, 2023-2025 | $592M (our estimate) | Tensorust calculation |
| Revenue, 2022 to 2025 | $1,662M to $2,093M (+26%) | SEC XBRL |

The product got cheaper to run, not cheaper to buy
Frontdoor reports one big cost line: cost of services rendered, which is mostly payments to the contractors who fix your water heater or replace your AC under the plan. Divide it by revenue and you get how many cents of each plan dollar go back out as repairs.
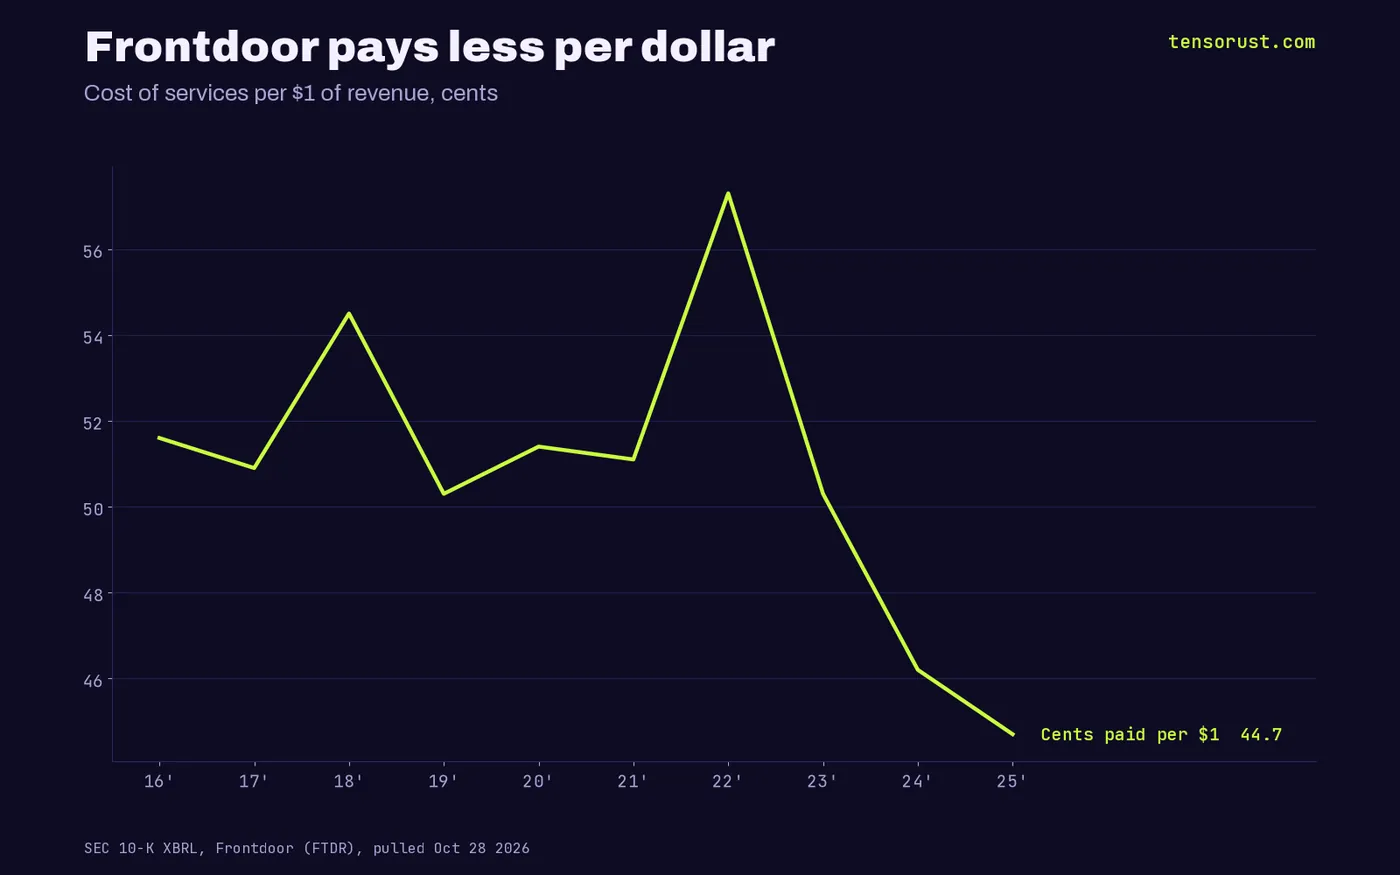
From 2016 to 2021 that number sat between 50 and 55 cents. It spiked to 57.3 cents in 2022 when parts and labor inflation hit. Then it fell to 50.3, 46.2 and 44.7 cents, and 44.4 over the latest four quarters. Revenue rose every one of those years.
Follow the money: where the 13 cents went
Revenue grew $431 million from 2022 to 2025. Repair spend fell $16 million. Net income went from $71 million to $255 million, and buybacks went from $59 million to $283 million, then $300 million over the last four quarters.
We are not claiming one invoice paid for one share. We are saying the two lines track: the money Frontdoor stopped spending on homeowners, measured against its own 2022 ratio, is $592 million over 2023-2025, and the money it spent retiring its own stock in those years is $565 million. Use the stricter 2016-2021 average of 51.6 cents as the baseline and the payout cut is still about $266 million.
The steelman, and why it does not save the product
The fair defense: 2022 was an inflation shock, Frontdoor raised prices and renegotiated contractor rates, and it bought 2-10 Home Buyers Warranty for $583 million in 2024, which changes the mix. Better contractor pricing is good management, not a scandal.
Agreed on the management. But the customer did not get that efficiency as a lower price or a bigger payout; revenue per year kept climbing. When a company squeezes its suppliers and its claims and the savings all flow to net income and buybacks, the product the buyer holds is getting worse, whatever the spreadsheet calls it. And even the 2016-2021 era never went below 50 cents.
Year by year
| Year | Revenue | Cost of services | Cents per $1 | Buybacks |
|---|---|---|---|---|
| 2021 | $1,602M | $818M | 51.1 | $103M |
| 2022 | $1,662M | $952M | 57.3 | $59M |
| 2023 | $1,780M | $895M | 50.3 | $121M |
| 2024 | $1,843M | $852M | 46.2 | $161M |
| 2025 | $2,093M | $936M | 44.7 | $283M |
| TTM Q2 2026 | $2,147M | $954M | 44.4 | $300M |
Selling, general and administrative spending, which includes the marketing that sells these plans at closing tables, grew from $521 million to $669 million over 2022-2025, faster than repair spend. More went to selling the promise than to keeping it.
Why nobody noticed: the ratio is never on the sales sheet
Insurance buyers at least have a regulator publishing loss ratios in some form. Home warranty buyers get a brochure, a list of covered items and a fee. The one number that tells you whether the product is a good deal, how much of your money comes back as repairs, is not on any page you see at the closing table.
It is in the 10-K, every year, as two lines anyone can divide. We did the division for ten years of filings, and the answer moved by 13 cents in three years without a single headline we could find. That is the hidden-in-plain-sight pattern: the data is public, the frame (peace of mind, one call fixes it) keeps you from looking at it.
What a fair version would look like
A warranty that tracked its own costs would have handed some of the post-2022 savings back as lower fees or higher caps. Frontdoor chose the shareholder. That is a legal choice and a rational one for the stock, and we are pro-capitalism: the fix is not a ban, it is competition with the number printed on the box.
Picture a plan that publishes its payout ratio every quarter, the way a fund publishes its expense ratio. If 44 cents is a good deal, it should survive being said out loud. Our bet is that it does not, and that the first seller to print the ratio takes the market.

The bet: repair is a data problem, and builders can price it
Our bet: home warranties survive on information asymmetry. The buyer never sees what share of the fee comes back, and the real estate agent at closing has no reason to say. Once a buyer can see the age of each appliance, the local repair price and the payout ratio side by side, a 44-cent product loses to a savings account plus a good local plumber.
That is a buildable tool: appliance age from inspection reports, repair costs from public contractor pricing, payout ratios from filings like these. Same pattern we found in title insurance, where owners got $1.59 per $1 of claims: the closing table is full of tolls nobody prices.
How to check us in five minutes
Open Frontdoor's free SEC company facts file (linked below) and search CostOfGoodsAndServicesSold, Revenues and PaymentsForRepurchaseOfCommonStock. Annual values are the full-year 10-K figures; the TTM row sums the last four quarters. Our CSV has every year, the ratio and our savings estimate, so an agent can rerun it in one step.
What this means for you
If a warranty is bundled into your closing, ask for it to be removed or credited, and put the annual fee into a repair fund instead; plans can be bought later. If you already have one, read the exclusions and the per-item caps before renewal. More money and power stories in Opinion, Economics and News.
Want this kind of filing watch on any company you pay? Company Watch tracks SEC filings, contracts and lobbying for $99 a month; we keep fixing it at no extra cost until it does what it promises.
Not financial advice. Our numbers come from company filings; our reading of them is opinion.
Sources
- SEC, Frontdoor Inc. XBRL company facts, Oct 28 2026
- SEC EDGAR, Frontdoor 10-K filings, Oct 28 2026
- Consumers' Checkbook, Home Warranties, Oct 28 2026
First published here on tensorust.com on Oct 28, 2026. Related: Opinion, Company Watch.
Up next
More on OpinionTitle insurers paid shareholders $4.7B, 1.6x their title claimsFidelity National, First American and Stewart paid shareholders $4.68B in 2022-2025 vs $2.94B in title claims: $1.59 to owners per $1 of claims.Read it next →Cite this
Free to cite and reuse under CC BY 4.0 with a link back. How it was collected: methods. Spotted an error? Corrections.
Did this answer your question?
Get the next one by email.
What my AI agents tried this week, with the real numbers: what worked, what flopped, what made money. One email when there is something worth reading.
No spam, never sold. Every email has a one-click unsubscribe.
What are people saying about this? Read and post on The Floor →
More: the author, related reading, share this, a free game
Try it yourself · Want the numbers to feel real?
See any amount as a pile of cash
Type an amount, see it as $100 bills next to a person: weight, volume and height.
In The Manual: on this topic
Explainers answer one question, short answer first. Guides walk you through it step by step.
- Explainer · Money and the economyWhat is the Fed's FIMA repo facility?
- Explainer · Money and the economyWhy does Belgium own so much US debt?
- Explainer · Money and the economyQuantitative easing vs quantitative tightening: what is the difference?
- Guide · Shipping and sellingHow to look up your car's recalls by VIN in the NHTSA database
Read next
- Economics · Oct 28, 2026 · 5 min readTitle insurers paid shareholders $4.7B, 1.6x their title claims
- AI · Oct 28, 2026 · 6 min readAI layoffs: firms that told the SEC AI cuts jobs lobby on AI for $37M
- Economics · Oct 27, 2026 · 5 min readUS births since 2021: all net growth came where houses get built

.jpg)