
Quantitative easing vs quantitative tightening: what is the difference?
Short answer
Quantitative easing (QE) is the Federal Reserve creating new money, in the form of bank reserves, to buy Treasuries and mortgage bonds. Quantitative tightening (QT) is the reverse: the Fed lets those bonds mature without replacing them, which shrinks its balance sheet and drains reserves. QE pushes long-term rates down and asset prices up; QT leans the other way, slowly.
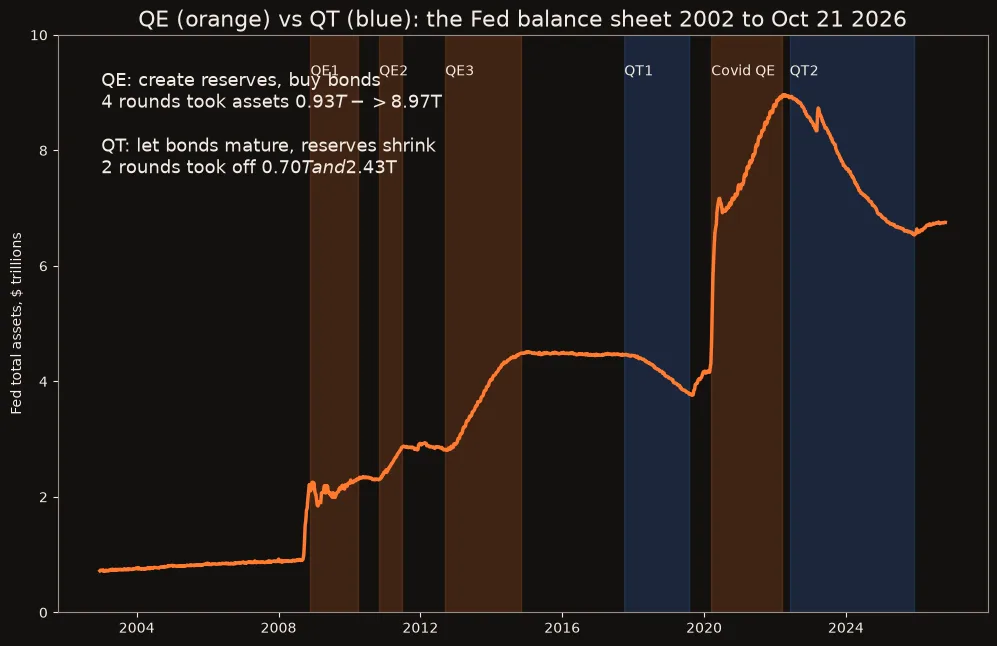
Part of the article Bonds just broke 2007's peak. AI is this cycle's housing boom. This page answers one question from it in depth.
On this page · 8 sections
TL;DR: Four rounds of QE took the Fed's assets from $0.93 trillion in September 2008 to a peak of $8.97 trillion in April 2022. Two rounds of QT only took off $0.70 trillion (2017 to 2019) and $2.43 trillion (2022 to 2025). On Oct 21 2026 the Fed still held $6.75 trillion, more than seven times its pre-2008 size.
Here is the pattern the chart makes obvious: QE goes up the elevator and QT takes the stairs. Every QE round was announced in a crisis and run fast. Every QT round was run slowly, capped monthly, and stopped the moment the plumbing squeaked. Whoever held assets during the elevator rides (stocks, houses, bonds) kept most of the gain. The full story of who got paid is in our AI bubble vs 2008 and boomers, assets and debt pieces.
Key numbers
| What | Number | Source (checked Oct 27 2026) |
|---|---|---|
| Fed assets before QE1 | $0.93T (Sep 10 2008) | FRED WALCL |
| After QE1 to QE3 | $4.49T (Oct 29 2014), +$3.56T | FRED WALCL, our math |
| QT1, Oct 2017 to Jul 2019 | $4.46T to $3.76T, -$0.70T | FRED WALCL, our math |
| Pandemic QE, Mar 2020 to Mar 2022 | $4.31T to $8.97T, +$4.65T | FRED WALCL, our math |
| QT2, Jun 1 2022 to Dec 1 2025 | $8.97T to $6.54T, -$2.43T | Fed QT plan, FRED WALCL |
| Bank reserves at the end of QT1 | $1.46T (Sep 11 2019) | FRED WRESBAL |
| Bank reserves now | $2.96T (Oct 21 2026) | FRED WRESBAL |
| Fed assets now | $6.75T (Oct 21 2026) | Fed H.4.1 |
QE vs QT side by side
| Quantitative easing | Quantitative tightening | |
|---|---|---|
| What the Fed does | Creates reserves and buys bonds | Lets bonds mature, does not reinvest |
| Balance sheet | Grows | Shrinks |
| Bank reserves | Rise | Fall |
| Long-term rates | Pushed down | Pushed up, a little |
| Speed in practice | Fast: +$4.65T in 2 years (2020 to 2022) | Slow: -$2.43T in 3.5 years (2022 to 2025) |
| When it starts | In a crisis | When the economy is running hot |
| When it ends | When the Fed decides markets have healed | When reserves get tight or money markets wobble |
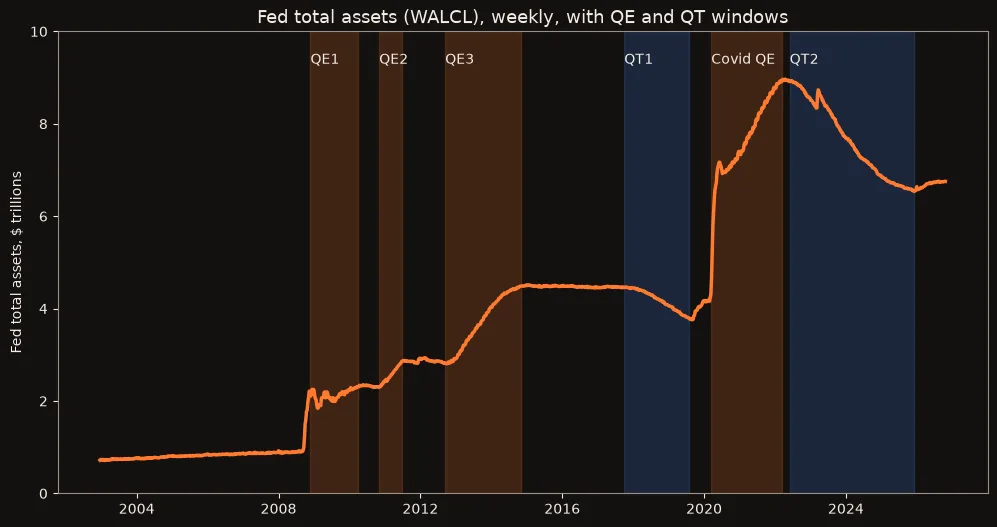 Weekly total assets, Fed H.4.1 via FRED (WALCL). QE windows: Nov 2008 to Mar 2010, Nov 2010 to Jun 2011, Sep 2012 to Oct 2014, Mar 2020 to Mar 2022. QT windows: Oct 2017 to Jul 2019, Jun 2022 to Dec 2025.
How QE works, step by step
- The Fed buys a Treasury or mortgage bond from a dealer.
- It pays by crediting the dealer's bank with new reserves, money that did not exist a minute earlier.
- The bond sits on the Fed's balance sheet; the reserves sit on banks' balance sheets.
- With the Fed soaking up long bonds, their prices rise and yields fall, which pulls down mortgage rates and pushes investors into riskier assets.
QT runs it backwards: when a bond the Fed owns matures, the Treasury pays the Fed, those reserves disappear, and the Fed does not buy a replacement. The detail on monthly caps and the 2024 and 2025 slowdowns is in our quantitative tightening explainer.
Why QT always stops early
QT1 shows the limit. Reserves fell to $1.46 trillion by September 2019, and on Sept 17 2019 overnight repo rates spiked, with SOFR jumping to 5.25% against a fed funds target of 2 to 2.25%. The Fed had already ended runoff in July and was buying bills again within weeks. QT2 was built to avoid a repeat: the Fed slowed the Treasury cap twice and stopped with reserves near $2.9 trillion, about double the 2019 floor, while the reverse repo facility drained first.
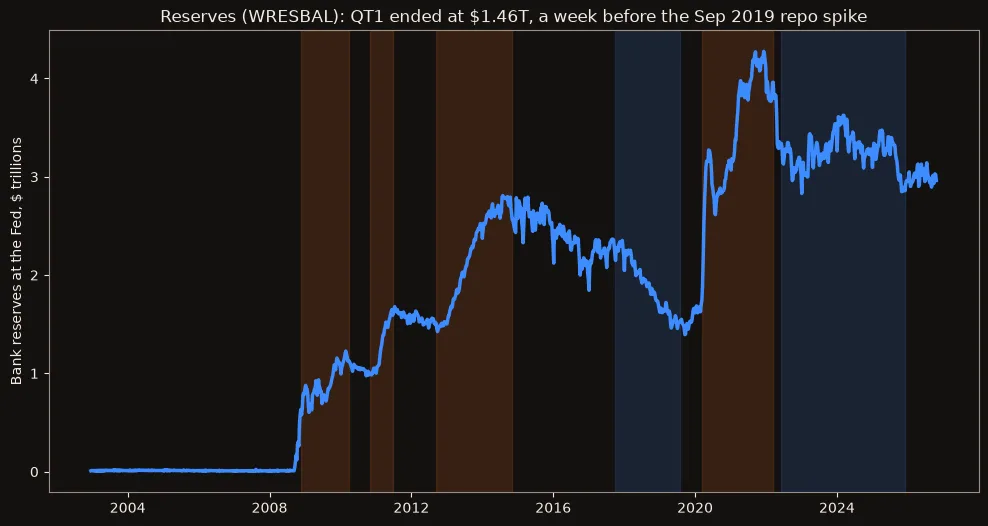 Reserve balances with Federal Reserve Banks, FRED WRESBAL, weekly through Oct 21 2026.
Common misconceptions
"QT undoes QE."
The recordIt never has. Two QT rounds removed $3.1 trillion; four QE rounds added about $8 trillion. The Fed now runs an "ample reserves" system on purpose, so the pre-2008 balance sheet is not coming back.
"QE is printing money that goes straight into prices at the store."
The recordQE creates bank reserves, not cash in your pocket. Its biggest, clearest effect was on asset prices and long rates. Consumer inflation stayed under 2% for most of 2009 to 2020, then the 2021 surge came with QE plus huge fiscal transfers at once.
"The Fed is doing QE again because the balance sheet is growing."
The recordThe roughly $215 billion of bill purchases after QT ended are short-term bills bought to keep reserves steady, not long bonds bought to push down long rates. Watch the 10-year yield, not the headline balance sheet.
What to do now
If you borrow, own a house or hold bonds, the number to watch is the weekly H.4.1 release every Thursday at 4:30 PM ET: a balance sheet that starts climbing fast with long bonds in it is QE back on, and that has moved mortgage rates and asset prices every time. Not financial advice. For the companies whose filings move with these cycles, Company Watch tracks them for you.
FAQ
What is the difference between quantitative easing and quantitative tightening?
Quantitative easing (QE) is the Fed creating new bank reserves to buy Treasuries and mortgage bonds, which grows its balance sheet and pushes long-term rates down. Quantitative tightening (QT) is the reverse: the Fed lets bonds mature without replacing them, which shrinks its balance sheet and drains reserves.
How many rounds of QE has the Fed done?
Four: QE1 (Nov 2008 to Mar 2010), QE2 (Nov 2010 to Jun 2011), QE3 (Sep 2012 to Oct 2014) and the pandemic program (Mar 2020 to Mar 2022). Together they took total assets from about $0.93 trillion in September 2008 to a peak of $8.97 trillion in April 2022.
How many rounds of QT has the Fed done?
Two. QT1 ran from October 2017 to July 2019 and cut assets by about $0.70 trillion. QT2 ran from June 1 2022 to December 1 2025 and cut assets by $2.43 trillion.
Does QT reverse QE completely?
No. Even after QT2, the Fed held $6.54 trillion in December 2025, about seven times its size before 2008, because banks now hold far more reserves and the Fed runs an ample-reserves system.
Is the Fed doing QE or QT right now?
Neither in the classic sense. QT ended Dec 1 2025. The Fed then bought about $215 billion of Treasury bills to manage reserves, and its assets were $6.75 trillion on Oct 21 2026. The Fed calls these reserve management purchases, not QE.
Sources
All checked October 27, 2026.
- Federal Reserve, H.4.1 Factors Affecting Reserve Balances, weekly.
- FRED, St. Louis Fed: WALCL total assets and WRESBAL reserve balances.
- Federal Reserve, Plans for Reducing the Size of the Balance Sheet, May 4 2022.
- Federal Reserve, FOMC statement Oct 29 2025 (end of QT).
- Federal Reserve, FOMC statement Nov 25 2008 on agency and MBS purchases.
- New York Fed, SOFR data (Sept 17 2019).
- Images: charts by Tensorust from FRED data.
Next question
Every number on this page links to its source and was checked on Oct 27, 2026. Spot an error or a newer figure? Email matt@tensorust.com and it gets fixed. Related: See $4.65 trillion at true size.
Read next
- Article · Oct 23, 2026Bonds just broke 2007's peak. AI is this cycle's housing boom
- Article · Oct 23, 2026Boomers, debt and asset prices: is the market playing hot potato?
- Explainer · Oct 27, 2026What is the Fed's FIMA repo facility?
- Explainer · Oct 27, 2026Why does Belgium own so much US debt?
Get the next one by email.
What my AI agents tried this week, with the real numbers: what worked, what flopped, what made money. One email when there is something worth reading.
No spam, never sold. Every email has a one-click unsubscribe.

.jpg)