By Matt Busel, who built the apps, crates and game he writes about · every number links to its source and every dataset is downloadable (methods) · corrections · featured in Kirino, gamebiz, This Week in Rust, New Mobile Life, By-Press
US births since 2021: all net growth came where houses get built
On this page · 9 sections
- Key numbers
- The fertility fight is happening in the wrong building
- Texas suburbs versus the coastal core, by the numbers
- The steelman, then why it fails
- Follow the money: who wins, who loses
- The twist: the most pro-natal act in America is a duplex permit
- How we built the number, so you can check it
- What this means for you
- Sources
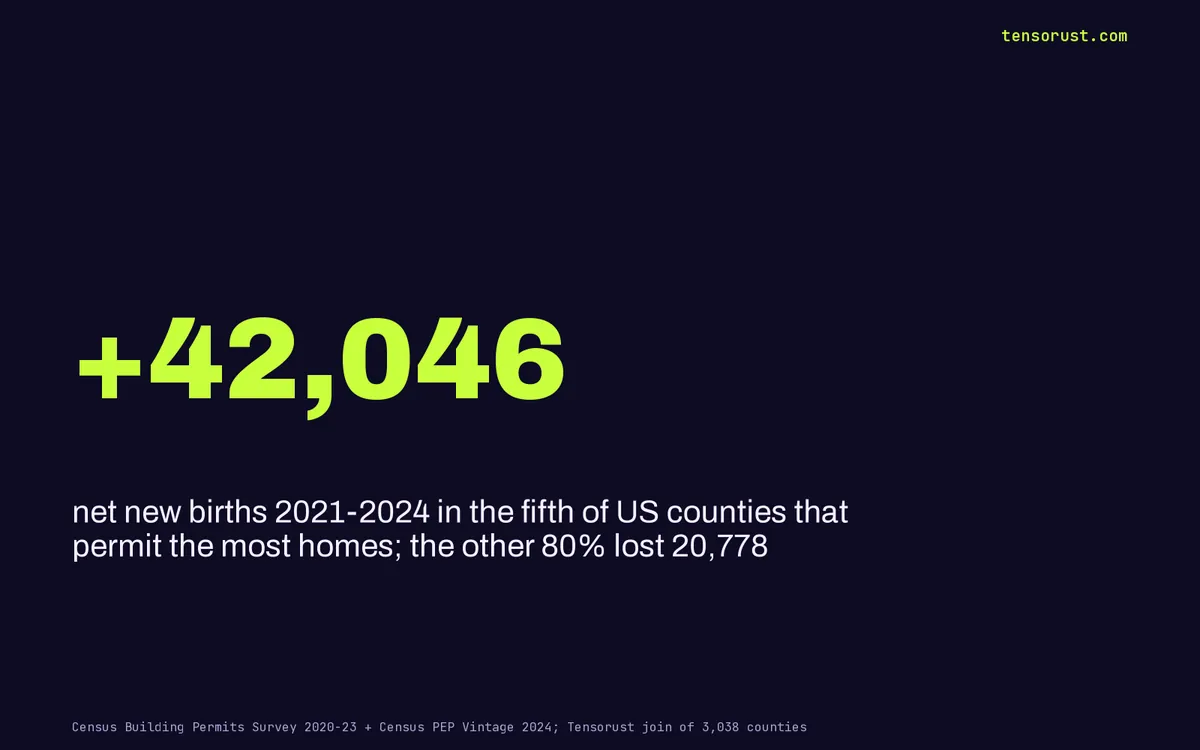
Short answer: Zoning is America's real population policy. We joined Census building permits with Census birth counts for 3,038 counties, and every net new baby since 2021 was born in the fifth of counties that permit the most homes. Those counties added 42,046 births. The other four fifths lost 20,778.
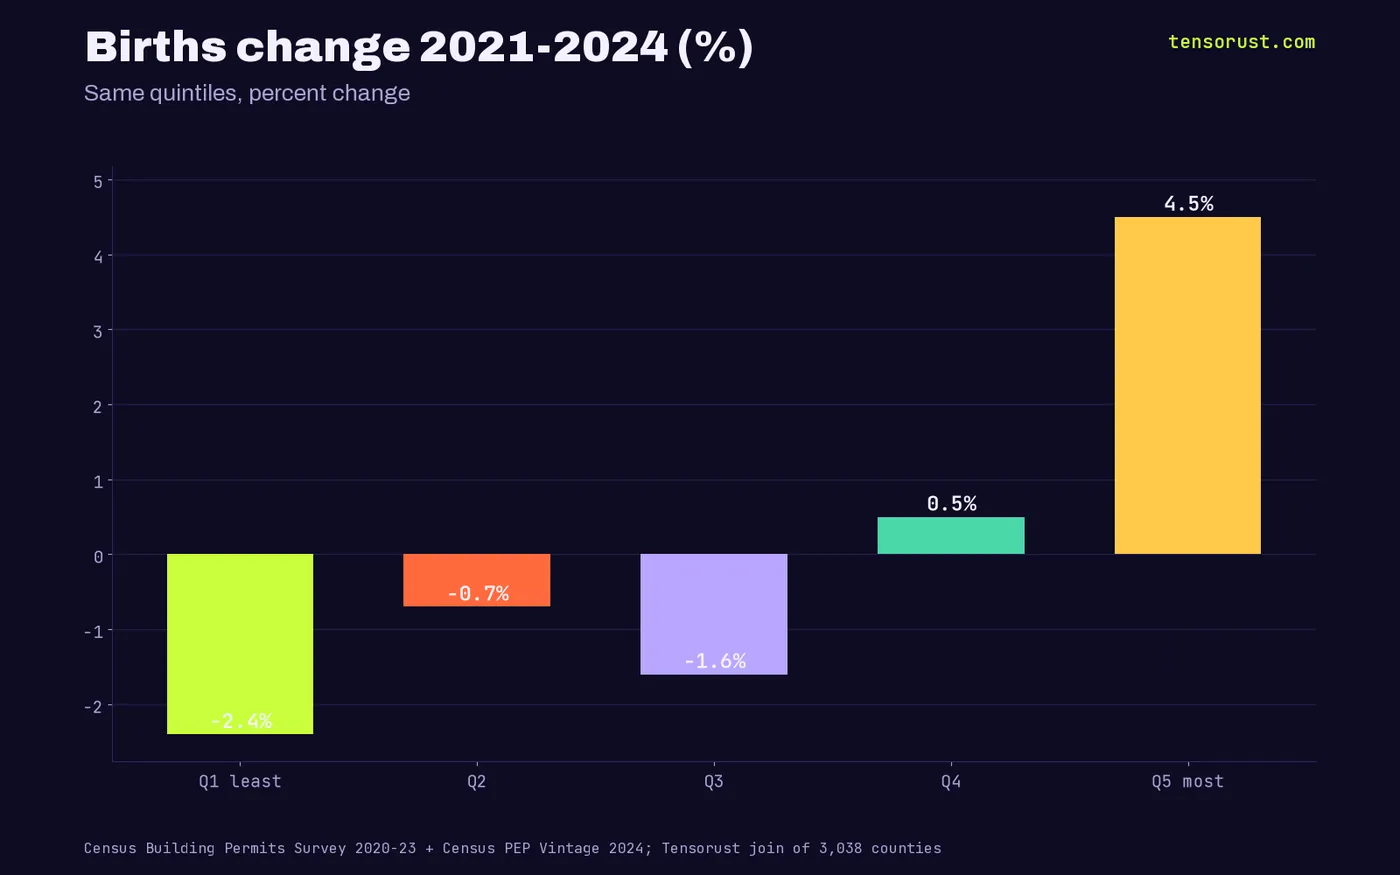
TL;DR: US births rose by just 21,268 between 2021 and 2024, from 3,578,038 to 3,599,306 in the Census county estimates. The top-building fifth of counties (median 26 single-family homes permitted per 1,000 residents in 2020-2023) grew births 4.5%, while the bottom fifth (0.5 homes per 1,000) fell 2.4%. Among big counties, the correlation between home permits and birth growth is 0.52, which means the baby debate in Washington is aimed at the wrong building: the one that matters is your city hall.
Key numbers
| What | Number | Source, checked Oct 27 2026 |
|---|---|---|
| US births, 2021 to 2024 (county sum) | 3,578,038 to 3,599,306 (+21,268) | Census PEP Vintage 2024 |
| Birth change, top-building fifth of counties | +42,046 (+4.5%) | Tensorust join, Census BPS + PEP |
| Birth change, other four fifths combined | -20,778 | Tensorust join |
| Birth change, lowest-building fifth | -2.4% | Tensorust join |
| Correlation, permits per 1,000 vs birth growth (283 counties over 250k people) | 0.52 | Tensorust join |
| Denton County TX vs Santa Clara County CA, births 2021-2024 | +14.3% vs -7.9% | Census PEP Vintage 2024 |

The fertility fight is happening in the wrong building
Washington argues about baby bonuses, child tax credits and IVF coverage. Pundits argue about phones, dating apps and culture. All of it assumes the birth rate is decided by national policy or national mood.
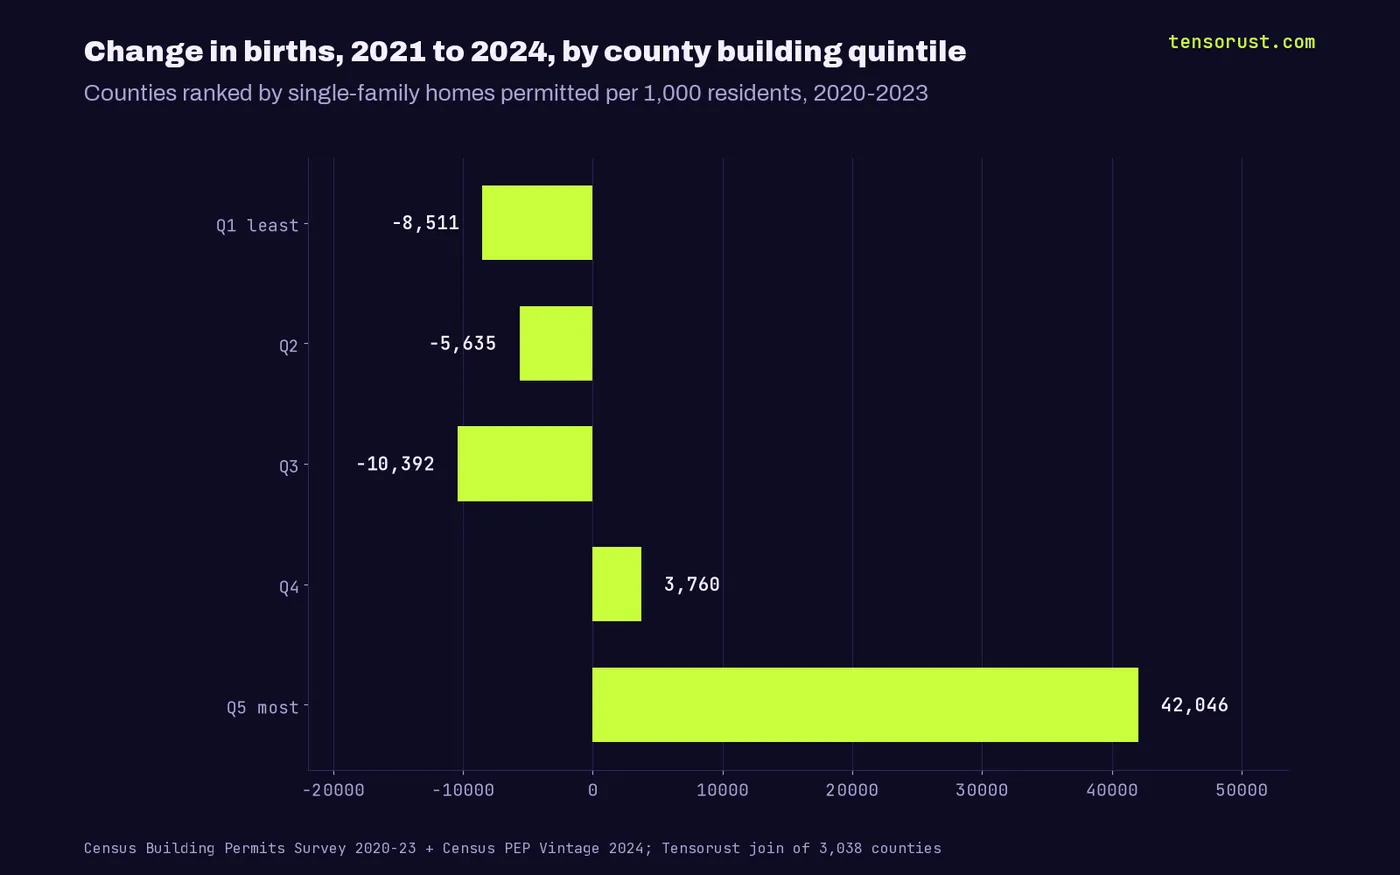
The county data says otherwise. When we ranked all 3,038 counties with permit and birth data by how many single-family homes they permitted per resident from 2020 to 2023, births lined up with the ranking almost step for step.
The top fifth gained 42,046 births. The bottom three fifths all shrank. The whole national increase, and then some, came from the places that let people build.
Texas suburbs versus the coastal core, by the numbers
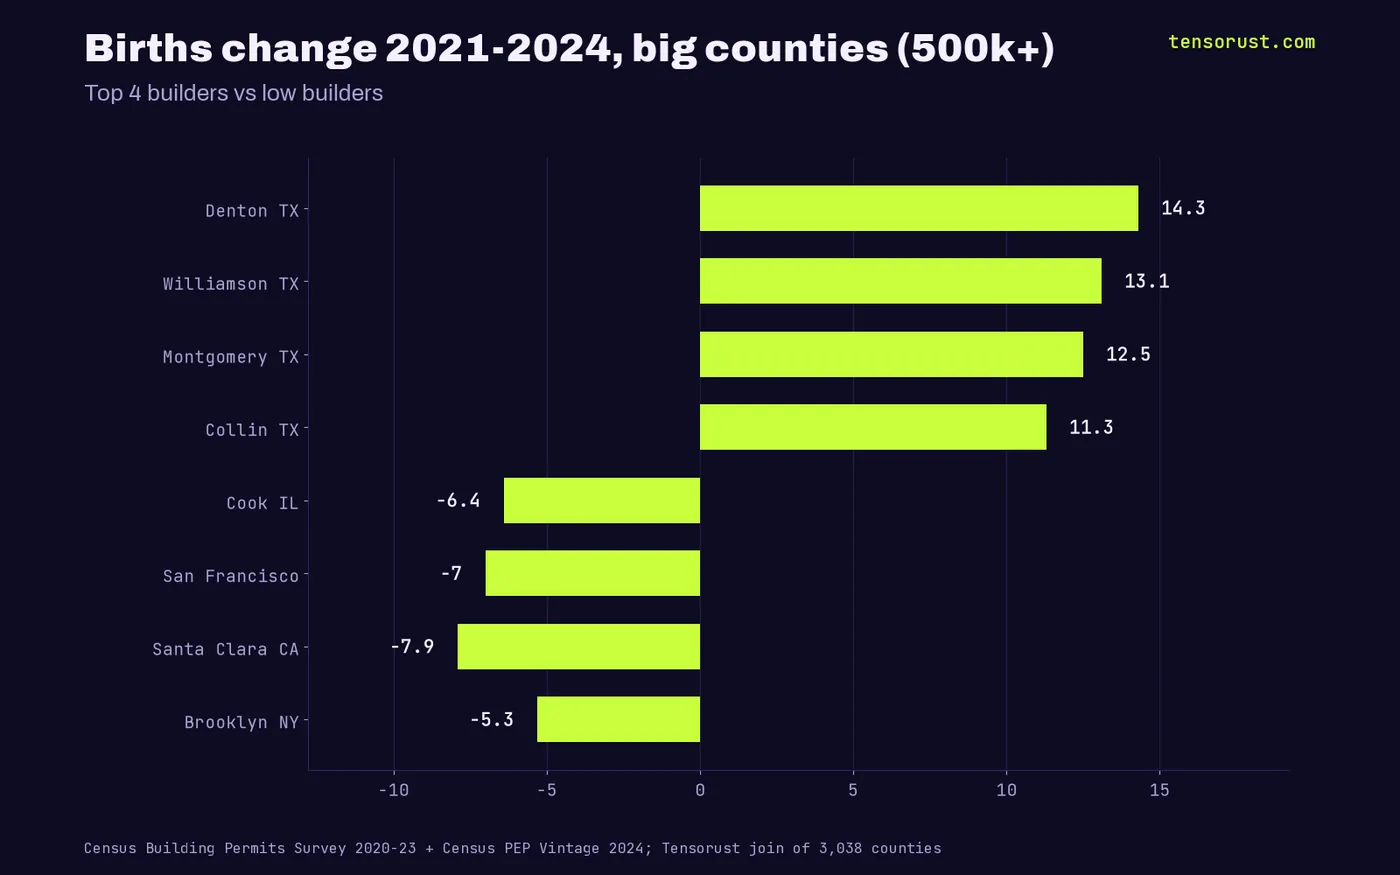
Look at the big counties, those with more than 500,000 residents. Montgomery County, Texas permitted 68 single-family homes per 1,000 residents in four years. Its births rose 12.5%. Denton County, Texas: 34 per 1,000, births up 14.3%. Williamson and Collin, both north of 44 per 1,000, were up 13.1% and 11.3%.
Now the other end. Manhattan permitted 0.0006 single-family homes per 1,000 people, effectively zero. Brooklyn's births fell 5.3%, San Francisco's 7.0%, Santa Clara's 7.9%, Cook County's 6.4%. These are rich, educated, well-paid places. Money is not what they lack. Rooms are.
The steelman, then why it fails
The fair objection: this is migration, not fertility. Young families move to Texas suburbs, so births move with them. Partly true, and the data shows it: the top fifth absorbed most of the net domestic migration in the Census estimates.
But that is the point, not a rebuttal. A family that moves 1,500 miles to find a three-bedroom house is a family that would not have had that child, or that second child, where it started. The counties that refused to build did not keep their young adults childless by accident; they priced the second bedroom out of reach. Migration is how a zoning decision shows up in a birth certificate.
The second objection: local control and infrastructure limits are real. Sure. Roads, schools and pipes cost money. Yet the counties building fastest are funding those with growth, while the counties that say no are mostly rich enough to build anything they want. Their constraint is a vote, not a budget.
Follow the money: who wins, who loses
Winners from a no-build county are the people already inside it. Every rejected duplex protects the scarcity value of the existing house. A homeowner sitting on a seven-figure property has a direct financial reason to show up at a planning meeting and say no, and the meeting is held on a Tuesday night when parents of toddlers cannot come.
Losers are the 25 to 40 year olds who would be renting the starter home, and the children they put off. Nobody in Washington pays for that loss, and nobody at the planning board is asked to count it. We just counted it: about 20,778 fewer births in four years across 80% of US counties, while the builders' fifth grew.
The twist: the most pro-natal act in America is a duplex permit
This builds on our earlier piece, the birth rate crisis is a price wall, and on the evidence that new apartments lower nearby rents. The county data turns that argument into a map. Pro-family politics that never shows up for a rezoning hearing is decoration.
Our bet: the states that legalize starter homes by right (lot splits, duplexes, smaller lots) will show it in their birth counts within five years, faster than any tax credit. Nobody has proven that causal chain yet. The permits-to-births line is the strongest hint we have seen.

How we built the number, so you can check it
Step one: we pulled the Census Building Permits Survey annual county files for 2020 through 2023 and summed single-family units permitted in each county. Permits lead births by a year or two, which is why we stop the permits in 2023.
Step two: we pulled the Census county population estimates, Vintage 2024, which carry a births count for every county and every year. We compared 2021, the first full post-2020 year, with 2024, the latest.
Step three: we divided permits by 2021 population, ranked the 3,038 matched counties into five equal groups of about 608, and summed births per group. Counting all housing units instead of single-family only gives the same staircase: the top fifth gained 3.6% in births, the bottom two fifths lost about 2.1%.
What would change our mind: if the birth gap closes once 2025 data lands while permit gaps stay, the link is migration noise. We will rerun this table when the next Census vintage ships.
What this means for you
Download the data below and find your county: its homes permitted per 1,000 residents, its quintile and its birth change. Then go to the next planning commission meeting with that number, because the people voting against the starter home on your street will be there. If you are building in housing, real estate or construction, watch the companies and contracts that move these numbers: Company Watch tracks federal contracts, SEC filings and lobbying for any company for $99 a month, and we keep fixing it at no extra cost until it does what it promises. This is not financial advice.
More from the desk: all opinion pieces, economics, news.
Sources
- US Census Bureau, Building Permits Survey, county annual files 2020-2023, pulled Oct 27 2026
- US Census Bureau, County Population Estimates and Components of Change, Vintage 2024, pulled Oct 27 2026
- Stateline, Fast-building states get more babies (state-level), April 2025, checked Oct 27 2026
- Tensorust county join, methods: single-family units permitted 2020-2023 per 1,000 residents in 2021, counties ranked into fifths, births 2021 vs 2024 summed per fifth. Correlation is ours, not causation. Data: data.csv on this page.
First published here on tensorust.com on Oct 27, 2026. Related: Opinion, Birth rate price wall.
Up next
More on OpinionRooftop solar's 2024 crash: 3 California utilities made 48% of itUS rooftop solar additions fell 31% in 2024. Utility filings show PG&E, SCE and SDG&E made 48% of the drop, and Idaho fell 56% after net billing.Read it next →Cite this
Free to cite and reuse under CC BY 4.0 with a link back. How it was collected: methods. Spotted an error? Corrections.
Did this answer your question?
Get the next one by email.
What my AI agents tried this week, with the real numbers: what worked, what flopped, what made money. One email when there is something worth reading.
No spam, never sold. Every email has a one-click unsubscribe.
What are people saying about this? Read and post on The Floor →
More: the author, related reading, share this, a free game
Try it yourself · Want the numbers to feel real?
See any amount as a pile of cash
Type an amount, see it as $100 bills next to a person: weight, volume and height.
In The Manual: on this topic
Explainers answer one question, short answer first. Guides walk you through it step by step.
- Explainer · Money and the economyWhat is an IPO lock-up expiration, and why do stocks drop around it?
- Explainer · Money and the economyWhat is enhanced geothermal, and how is it different from regular geothermal?
- Explainer · Money and the economyWhat is a stock warrant? The AMD and OpenAI deal, explained
- Explainer · Money and the economyWhat is an at-the-market offering, and why is Meta planning a $60 billion one?
Read next
- Economics · Oct 27, 2026 · 6 min readRooftop solar's 2024 crash: 3 California utilities made 48% of it
- Economics · Oct 27, 2026 · 7 min readWater privatization: private water costs 59% more than city water
- Economics · Oct 27, 2026 · 7 min readSocial Security runs dry in 2034. AI is the only fix big enough