By Matt Busel, who built the apps, crates and game he writes about · every number links to its source and every dataset is downloadable (methods) · corrections · featured in Kirino, gamebiz, This Week in Rust, New Mobile Life, By-Press
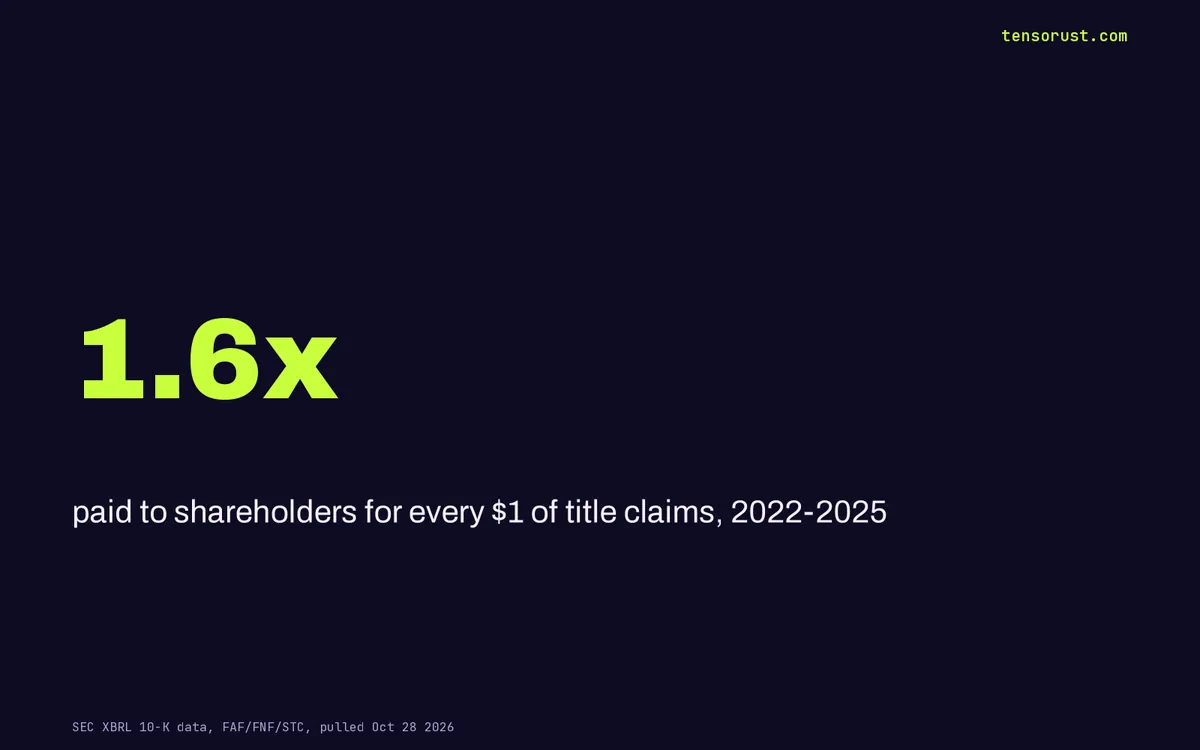
Title insurers paid shareholders $4.7B, 1.6x their title claims
On this page · 10 sections
- Key numbers
- The insurance where the owners collect more than the victims
- Fidelity National is the clearest case
- The steelman, and why it does not hold
- Follow the money: who wins, who loses
- Year by year: owners beat claimants four times out of four
- How to check us in five minutes
- The bet: the search becomes cheap, the premium becomes indefensible
- What this means for you
- Sources
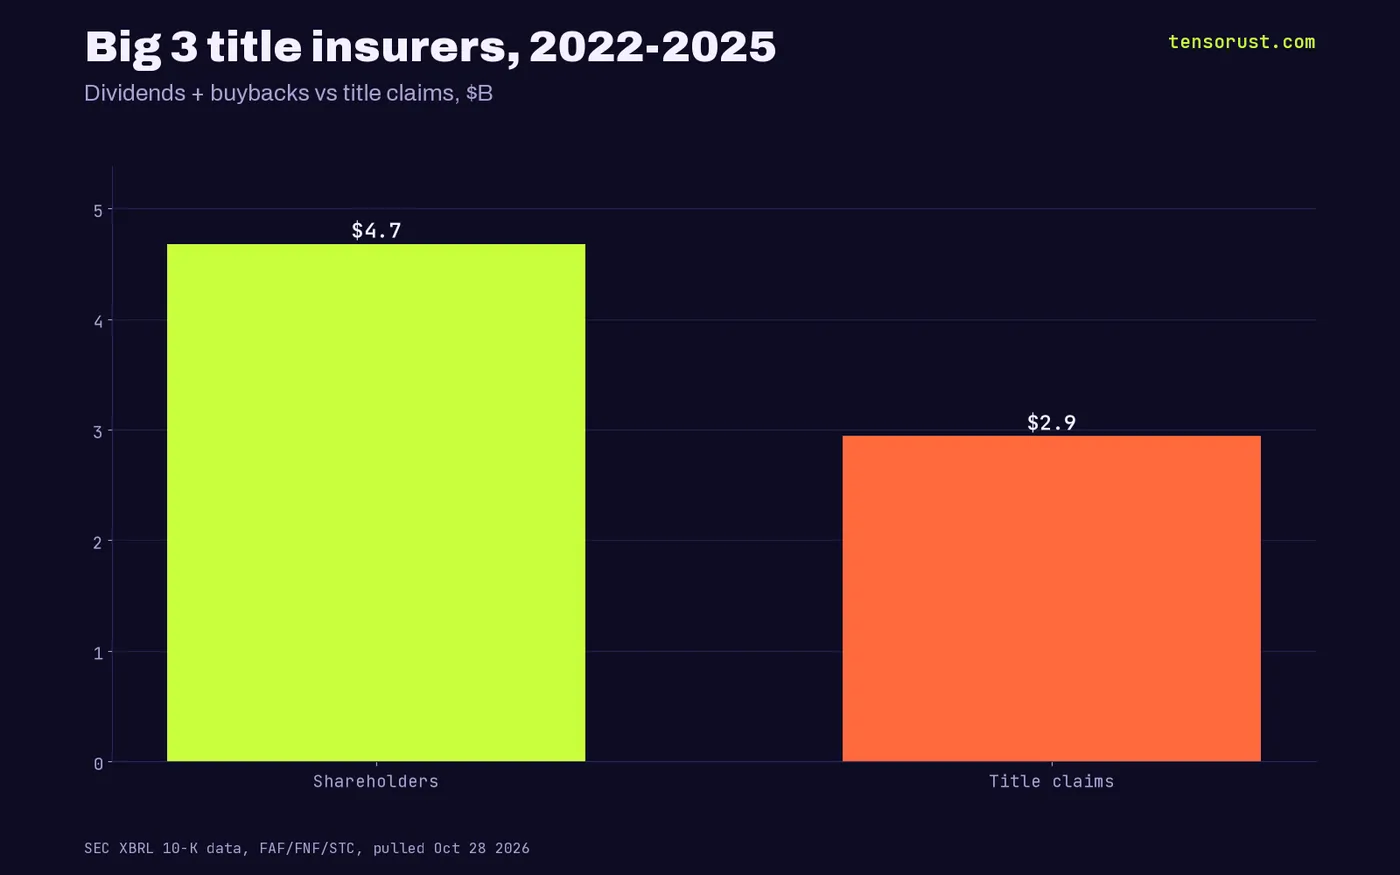
Short answer: From 2022 through 2025, Fidelity National Financial, First American and Stewart paid their own shareholders $4.68 billion in dividends and buybacks, against $2.94 billion in title claims. That is $1.59 to owners for every $1 to the homebuyers the policy is supposed to protect. The policy you pay for at closing works like a toll, and the filings show who collects it.
TL;DR: We pulled four years of 10-K data for the three biggest public title insurers and set shareholder payouts next to title claims; we could not find anyone who has published that comparison. Fidelity National alone sent $2.88 billion to shareholders against $1.01 billion in title claim provisions, a 2.9x gap, and the three combined paid owners more than claimants in every single year. Title claims ran at about 3.3% of these companies' total revenue, which is why we think software that does the search is about to make the premium look like what it is.
Key numbers
| What | Number | Source, checked Oct 28 2026 |
|---|---|---|
| Dividends + buybacks, FNF + FAF + STC, 2022-2025 | $4.68B | SEC XBRL company facts |
| Title claims, same three firms, 2022-2025 | $2.94B | SEC XBRL company facts |
| Payout per $1 of title claims | $1.59 | Tensorust calculation from the rows above |
| Fidelity National: payout vs title claim provision | $2.88B vs $1.01B (2.9x) | FNF XBRL facts |
| First American: payout vs title claims paid | $1.58B vs $1.57B | FAF XBRL facts |
| Title claims as share of the three firms' revenue | 3.3% ($2.94B of $89.4B) | Tensorust calculation |

The insurance where the owners collect more than the victims
Most insurance exists to move money from the many to the unlucky. Title insurance flips that: the three biggest public title companies paid their owners 59% more than they paid on title claims over the last four years.
We built this from the companies' own XBRL filings at the SEC. For First American and Stewart we used title claims paid, from the reserve rollforward in each 10-K. Fidelity National stopped tagging claims paid after 2019, so for it we used the title claim provision it books each year. Every row is in the downloadable CSV, with the measure named on each line.
Fidelity National is the clearest case
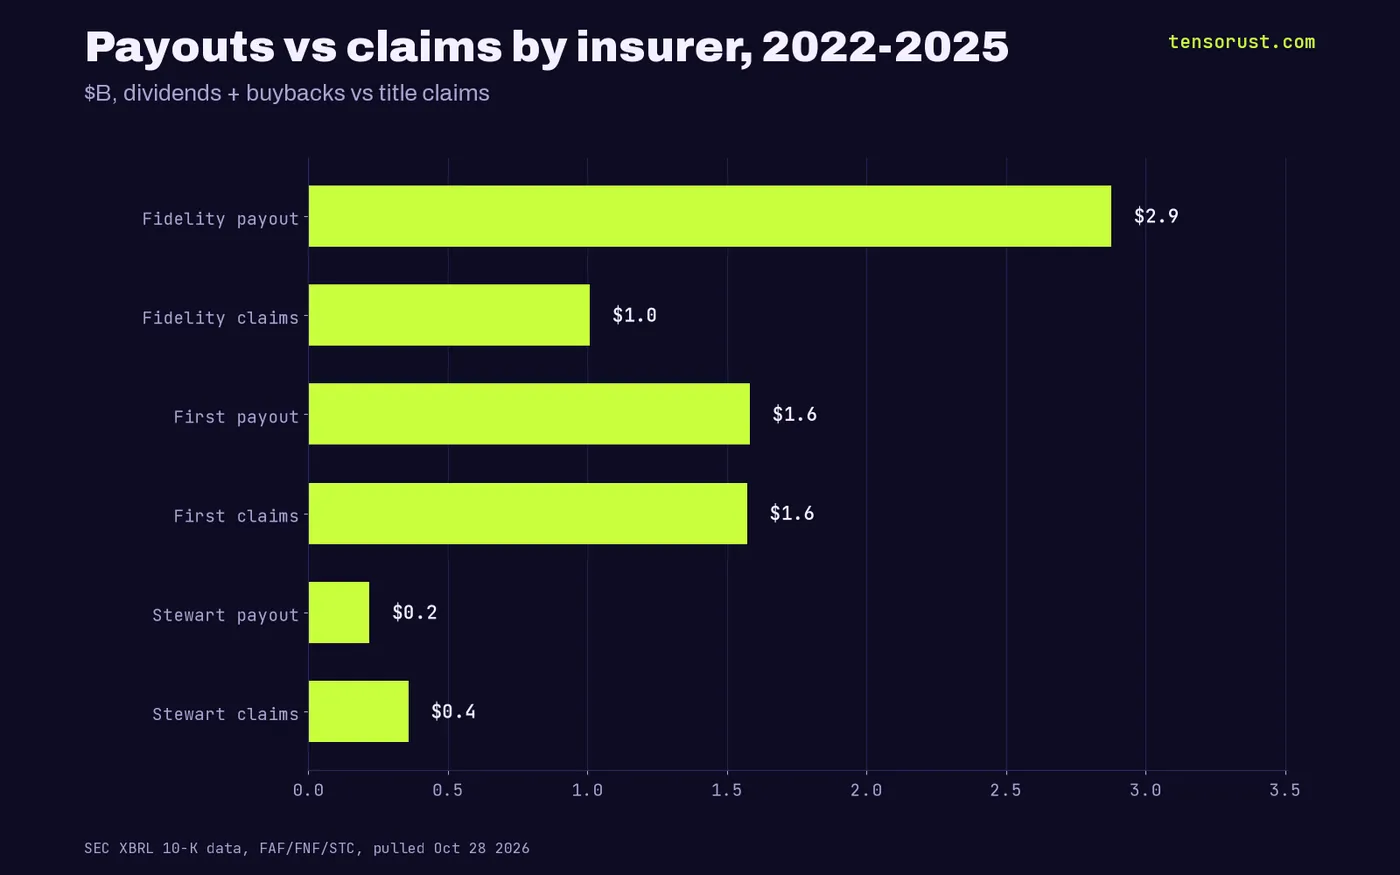
Fidelity National Financial, the largest of the three by revenue, paid $2.07 billion in dividends and $810 million in buybacks from 2022 to 2025. Its title claim provision over the same years was $1.01 billion. That is 2.9 dollars to shareholders for each dollar set aside for claims.
First American came out almost exactly even: $1.58 billion to shareholders, $1.57 billion in title claims paid, with a $441 million buyback in 2022 doing much of the work. Stewart, the smallest, is the only one of the three that paid more in claims ($360 million) than to shareholders ($220 million).
The steelman, and why it does not hold
The fair objection: Fidelity National also owns F&G, an annuity and life insurer, so not every dividend dollar came from title. True, and it is why we show each company separately. But First American's business is overwhelmingly title and escrow, and it still paid owners as much as claimants. The pattern does not depend on the annuity arm.
The second objection: title insurance is "loss prevention", so low claims prove the search works. We agree, and that is the point. If the value is the search, the buyer is paying an insurance premium for a records job. Records jobs are exactly what software eats.
Follow the money: who wins, who loses
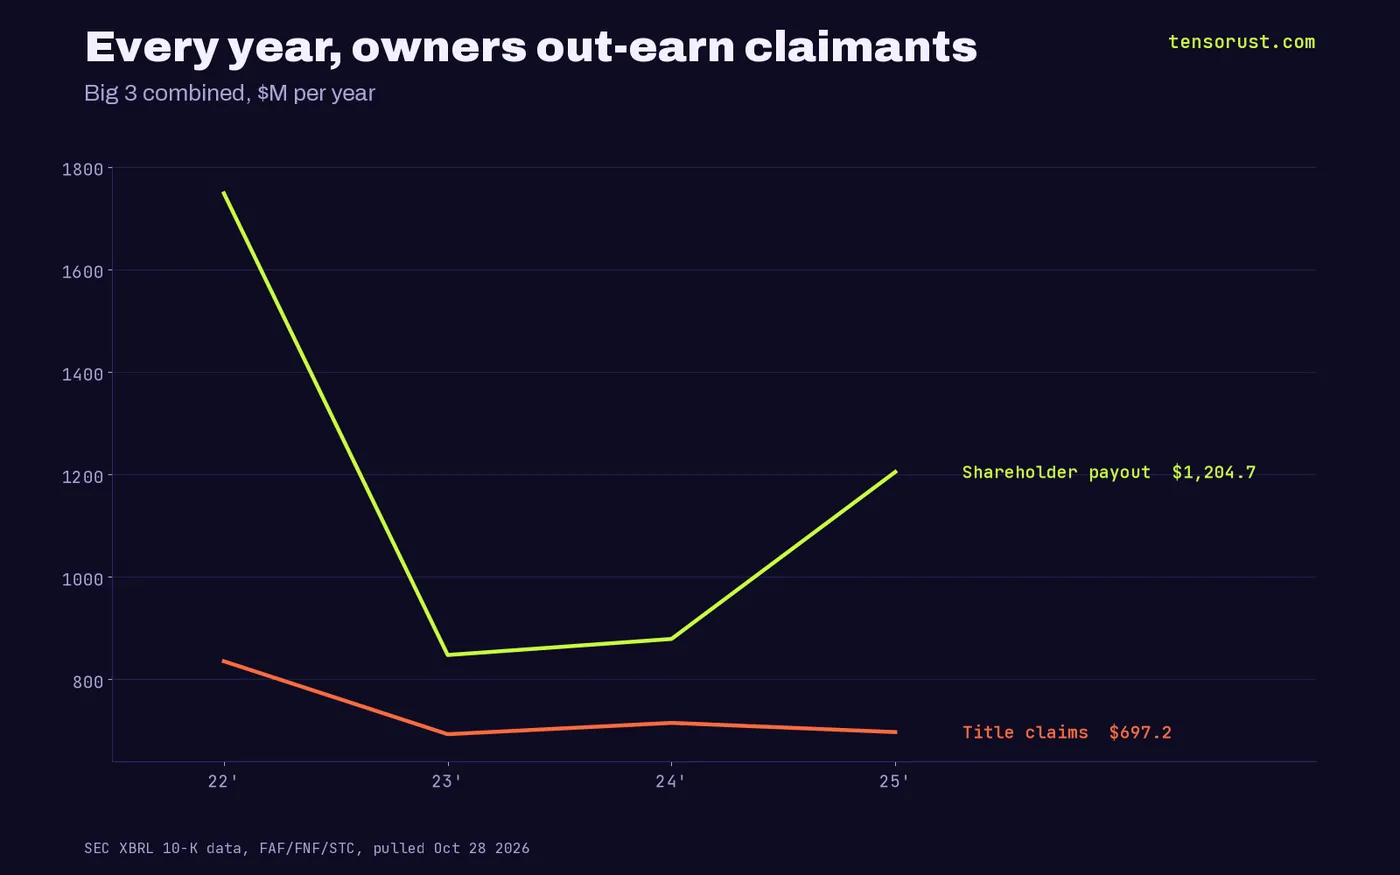
Winners: shareholders of the big underwriters, who collected $1.75 billion in 2022 alone, more than double that year's $835 million in claims. Losers: buyers who pay a premium set through state rate filings and usually picked by a lender or agent, not by shopping.
Claims stayed flat at roughly $700 million a year across 2023 to 2025 for the three combined, while payouts swung with buyback appetite. The claims side barely moves; the owner side does. That is what a toll looks like on a chart.
Year by year: owners beat claimants four times out of four
Here is the combined ledger for the three companies. Payouts are dividends plus buybacks from each cash flow statement; claims use the measure described above.
| Year | Shareholder payout | Title claims | Payout per $1 of claims |
|---|---|---|---|
| 2022 | $1,748M | $835M | $2.09 |
| 2023 | $848M | $693M | $1.22 |
| 2024 | $879M | $715M | $1.23 |
| 2025 | $1,205M | $697M | $1.73 |
In 2023 the three companies' combined revenue fell 10% from 2022, to $20.0 billion, and that is when you would expect the cushion to thin. It did, but it never flipped: owners still took more than claimants.
And 2025 shows the direction of travel: as volumes came back, payouts jumped $326 million while claims slipped. Fidelity National restarted buybacks at $251 million, First American lifted its buyback to $122 million, and Stewart raised its dividend again.
How to check us in five minutes
Every number here comes from the SEC's free XBRL "company facts" files, one JSON per company, linked in Sources. Open the file, search for PaymentsOfDividends and PaymentsForRepurchaseOfCommonStock for the payout side, and for the claims side search the claims-paid tags (First American, Stewart) or PolicyholderBenefitsAndClaimsIncurredNet (Fidelity National).
Our CSV has one row per company per year with revenue, net income, dividends, buybacks and claims, and names which claims measure we used. An agent can load it and redo the math in one step. If you find a better claims series for Fidelity National's title segment, tell us and we will rerun the comparison in public.

The bet: the search becomes cheap, the premium becomes indefensible
Our bet, not yet proven: once county records, liens and judgments are read by AI agents in minutes, the risk the premium is priced on shrinks toward the 3% of revenue claims already are, and buyers start asking why they pay full freight. Iowa already runs a state title guaranty program instead of private title insurance, which shows the private model is a choice, not a law of nature.
Builders should treat this as an open market: a cheap, verifiable title search that a lender will accept is the product. The incumbents' own filings say the claims bill is small.
What this means for you
If you are buying a home, ask your closing agent for the title premium itemized, ask whether you may pick your own title company, and get a second quote; in many states you can. Download our CSV and check the numbers yourself. More on money and power in Opinion, Economics and News, and see how insurers already write the rules for AI in our piece on 4,078 AI exclusions.
Want this kind of filing watch on any company you deal with? Company Watch tracks federal contracts, SEC filings and lobbying for $99 a month; we keep fixing it at no extra cost until it does what it promises.
Not financial advice. Our numbers come from company filings; our reading of them is opinion.
Sources
- SEC, Fidelity National Financial XBRL company facts, Oct 28 2026
- SEC, First American Financial XBRL company facts, Oct 28 2026
- SEC, Stewart Information Services XBRL company facts, Oct 28 2026
- Stewart Information Services, 10-K for FY2025, Oct 28 2026
- Iowa Finance Authority, Iowa Title Guaranty, Oct 28 2026
First published here on tensorust.com on Oct 28, 2026. Related: Opinion, Company Watch.
Up next
More on OpinionFrontdoor cut warranty payouts to 44 cents. Buybacks got the gapFrontdoor (American Home Shield) spent 44.4 cents on repairs per $1 of revenue, down from 57.3 in 2022, while buybacks rose from $59M to $300M a year.Read it next →Cite this
Free to cite and reuse under CC BY 4.0 with a link back. How it was collected: methods. Spotted an error? Corrections.
Did this answer your question?
Get the next one by email.
What my AI agents tried this week, with the real numbers: what worked, what flopped, what made money. One email when there is something worth reading.
No spam, never sold. Every email has a one-click unsubscribe.
What are people saying about this? Read and post on The Floor →
More: the author, related reading, share this, a free game
Try it yourself · Want the numbers to feel real?
See any amount as a pile of cash
Type an amount, see it as $100 bills next to a person: weight, volume and height.
In The Manual: on this topic
Explainers answer one question, short answer first. Guides walk you through it step by step.
- Explainer · Money and the economyWhat is the Fed's FIMA repo facility?
- Explainer · Money and the economyWhy does Belgium own so much US debt?
- Explainer · Money and the economyQuantitative easing vs quantitative tightening: what is the difference?
- Guide · Shipping and sellingHow to look up your car's recalls by VIN in the NHTSA database
Read next
- Economics · Oct 28, 2026 · 6 min readFrontdoor cut warranty payouts to 44 cents. Buybacks got the gap
- AI · Oct 28, 2026 · 6 min readAI layoffs: firms that told the SEC AI cuts jobs lobby on AI for $37M
- Economics · Oct 27, 2026 · 5 min readUS births since 2021: all net growth came where houses get built