
Inverted yield curve: what it means, and where it stands now
Short answer
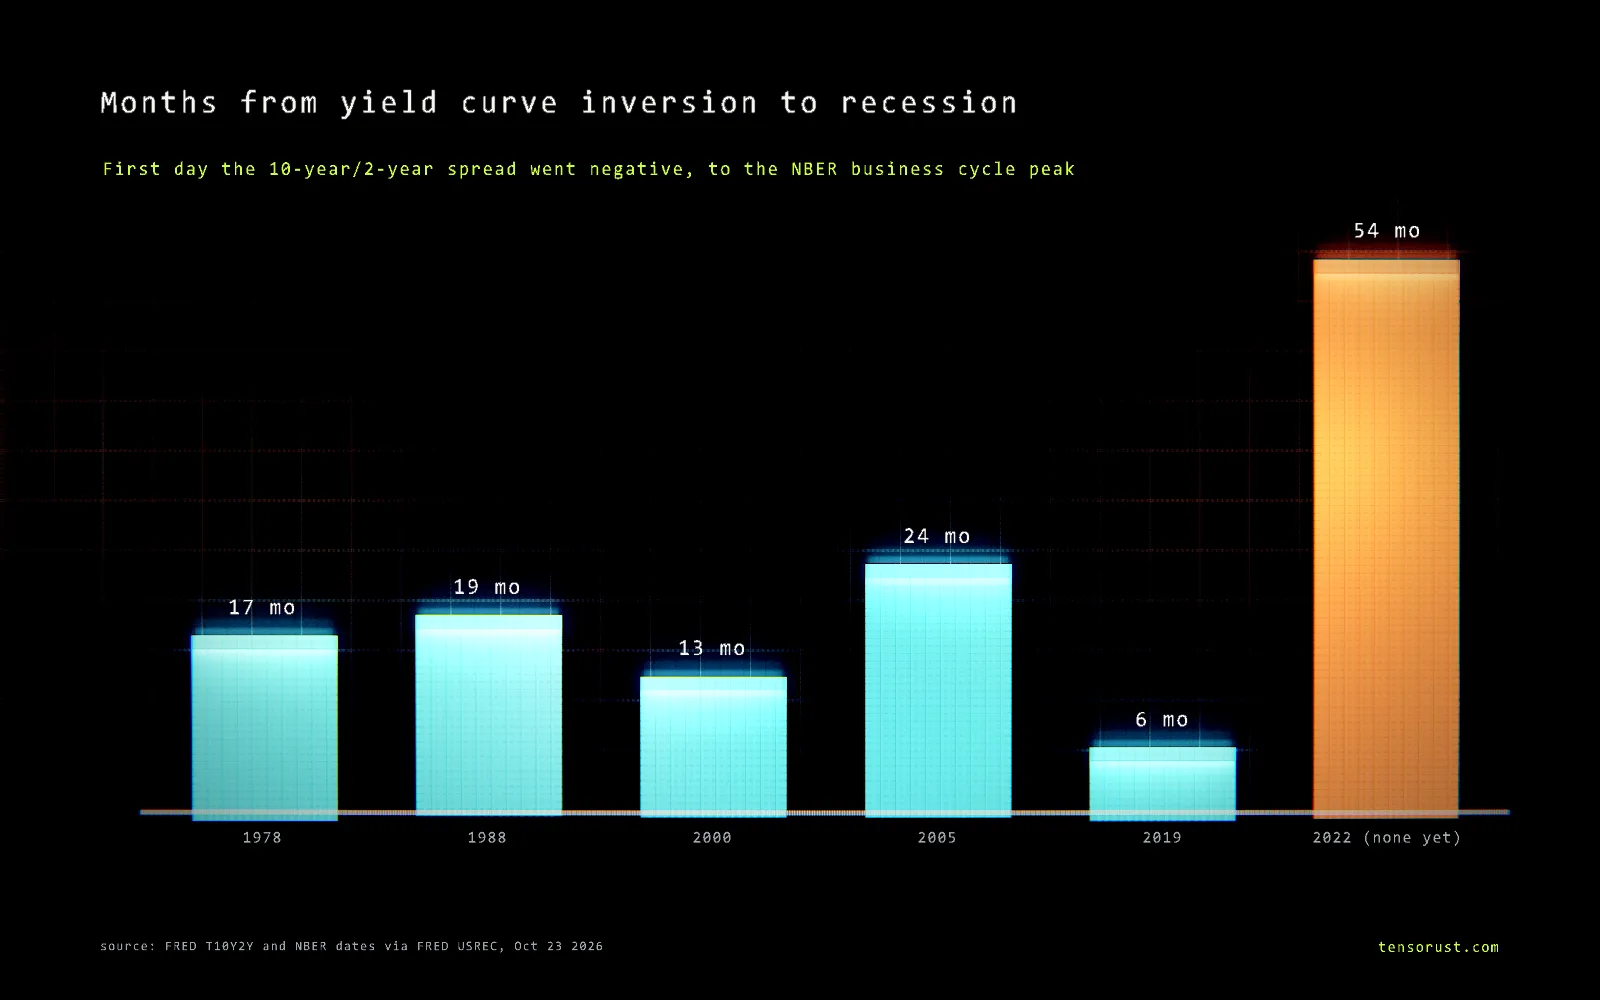
An inverted yield curve means short-term US Treasury debt pays a higher interest rate than long-term debt, the reverse of normal. Since 1976, every recession was preceded by an inversion of the 10-year minus 2-year spread, with the recession starting 6 to 24 months after it first went negative.
Part of the article Bonds just broke 2007's peak. AI is this cycle's housing boom. This page answers one question from it in depth.
On this page · 9 sections
Then 2022 broke the pattern. That spread stayed inverted for 537 trading days (July 6, 2022 to August 26, 2024), the longest run on record, and 54 months after the first dip below zero the NBER has dated no recession. Today the curve is not inverted: on October 23, 2026 the 10-year yielded 0.31 points more than the 2-year and 0.78 points more than the 3-month bill.
Key numbers
| What | Number | Source (checked Oct 24 2026) |
|---|---|---|
| 10-year minus 2-year spread now | +0.31 points (Oct 23 2026) | FRED T10Y2Y |
| 10-year minus 3-month spread now | +0.78 points (Oct 23 2026) | FRED T10Y3M |
| Longest inversion on record (10y-2y) | 537 trading days, Jul 6 2022 to Aug 26 2024 (previous record: 423 days, 1978 to 1980) | FRED T10Y2Y, our count |
| Deepest point of the 2022-24 inversion | -1.08 (10y-2y, Jul 3 2023); -1.89 (10y-3m, May 4 2023) | FRED T10Y2Y, T10Y3M |
| Lead from first inversion to recession | 6 to 24 months (5 recessions, 1980 to 2020) | FRED T10Y2Y, NBER business cycle dates, our math |
| Months since the 2022 inversion began | 54, no NBER recession dated | FRED USREC (through Sep 2026) |
| Fed policy rate | 3.75% to 4.00% (raised Sep 16 2026) | FOMC statement |
Download the data (CSV): every daily 10y-2y and 10y-3m spread since 1976 and 1982, with the NBER recession flag for each month.
What "inverted" means, with real numbers
The yield curve is just a line through the interest rates the US Treasury pays at each maturity, from 1 month to 30 years. Normally it slopes up: tying your money up for 10 years earns more than lending it for 3 months. (If yields are new to you, start with what a Treasury yield is.)
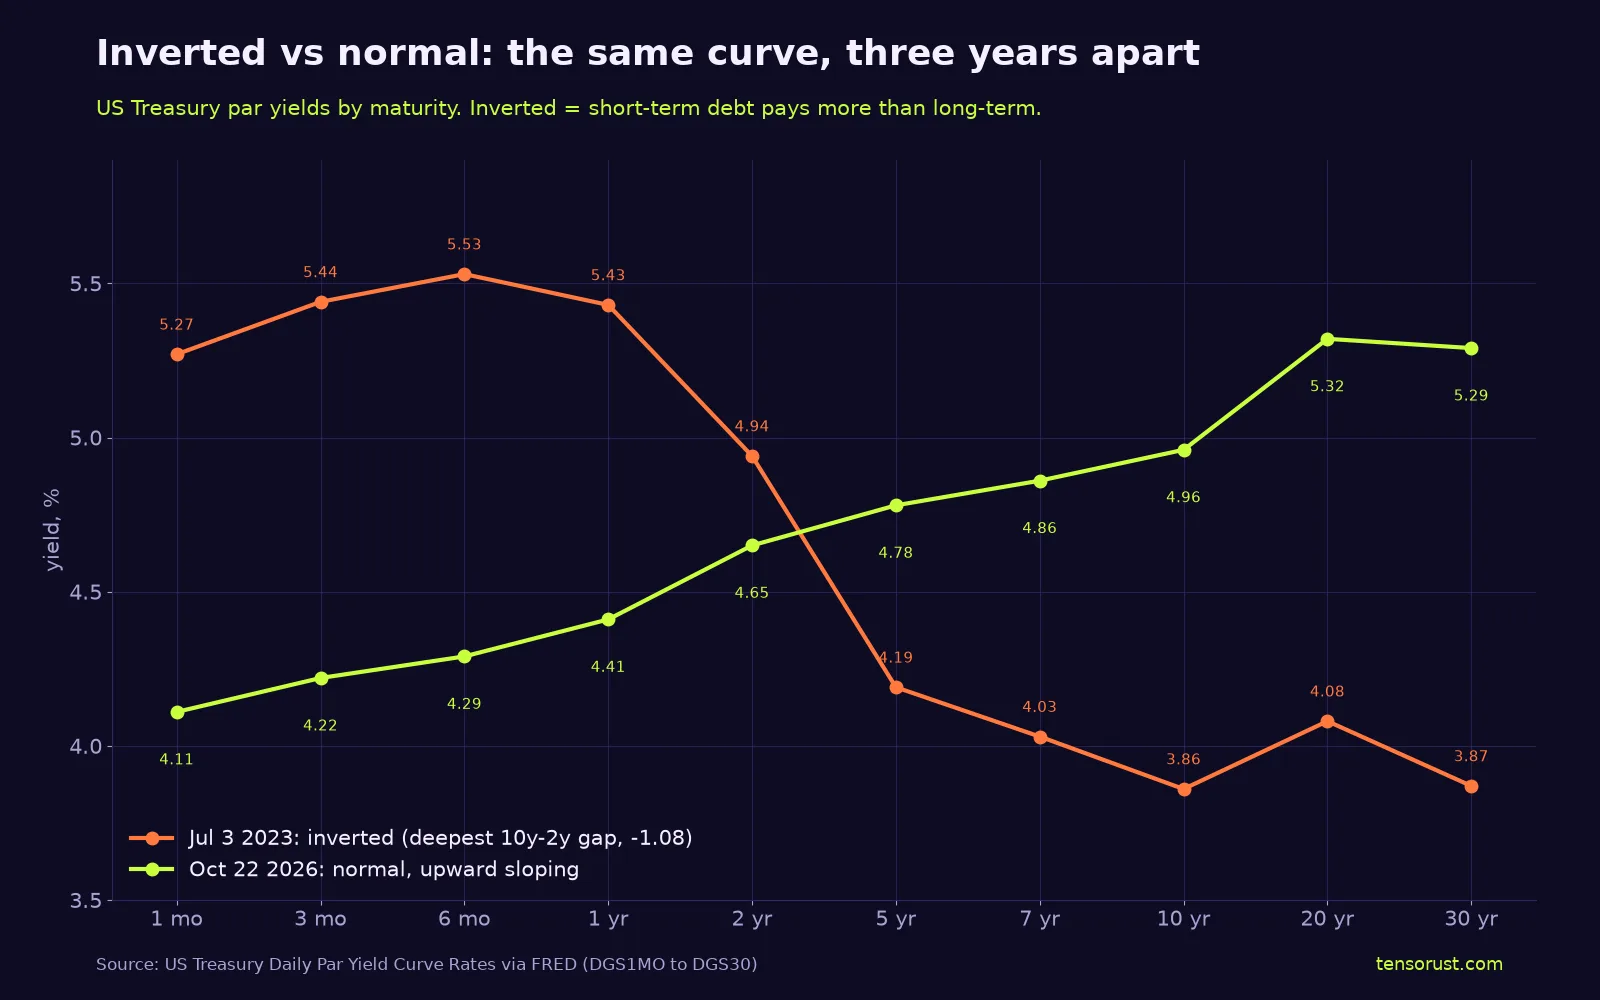
On July 3, 2023 a 6-month bill paid 5.53% and a 10-year note paid 3.86%. Investors accepted less to lock money up for a decade because they expected the Fed, which had hiked from near zero to 5% to 5.25% by then, to cut rates later. Long yields are roughly the average of expected short rates over the bond's life plus a term premium, so when markets expect cuts, long yields sit below short ones.
Two spreads get quoted:
- 10-year minus 2-year (FRED T10Y2Y): the one in most headlines, daily since June 1976.
- 10-year minus 3-month (FRED T10Y3M): the one the New York Fed uses in its recession probability model, based on Estrella and Mishkin (1996). The idea traces to Campbell Harvey's 1986 dissertation.
Every inversion since 1976
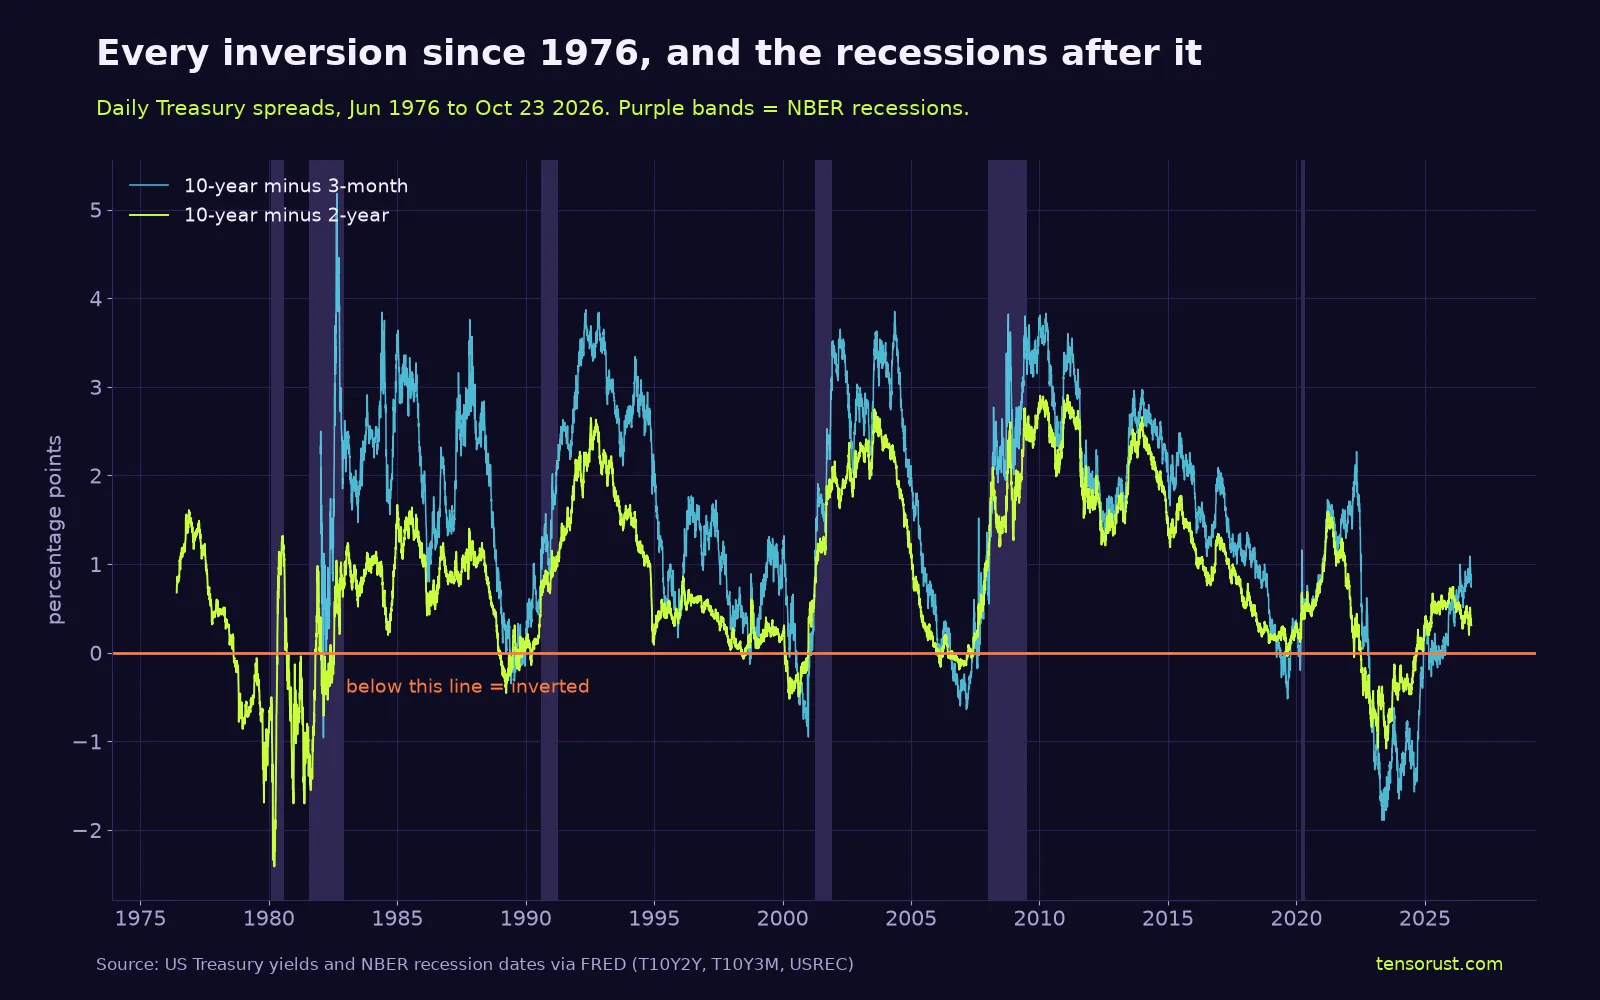
Our count, 10-year minus 2-year spread, grouping negative days less than six months apart into one episode:
| First negative day | Deepest | Recession began (NBER peak) | Lead |
|---|---|---|---|
| Aug 18 1978 | -2.41 | Jan 1980 (and again Jul 1981) | 17 months |
| Dec 13 1988 | -0.45 | Jul 1990 | 19 months |
| May 26 1998 | -0.07 (27 days) | Mar 2001 | 34 months: usually counted as a false start |
| Feb 2 2000 | -0.52 | Mar 2001 | 13 months |
| Dec 27 2005 | -0.19 | Dec 2007 | 24 months |
| Aug 27 2019 | -0.04 (3 days) | Feb 2020 | 6 months, and the cause was a pandemic |
| Apr 1 2022 | -1.08 | none dated as of Oct 2026 | 54 months and counting |
Two honest caveats. Six recessions is a tiny sample; the 2020 "hit" came from a virus no bond market forecast. And the NBER dates recessions months after the fact, so a downturn that began in mid 2026 would not show in its data yet. Even so, 54 months is more than double the longest lead on record.
The un-inversion signal
A popular follow-up claim is that the real danger comes when the curve turns positive again. The record partly backs it: in 1990, 2001, 2007 and 2020 the recession started 3 to 6 months after the 10y-2y spread went back above zero (in 1980 it started while the curve was still inverted). This time the spread turned positive for good in early September 2024 and has stayed there for about 25 months without an NBER recession.
Common misconceptions
"An inverted yield curve causes recessions."
The recordIt is mostly a symptom. It shows the Fed holding short rates well above where investors expect them to settle, which is what squeezes borrowing. It can add pressure, because banks that fund short and lend long earn less on new loans, but the curve is a thermometer more than a cause.
"Inversion means a recession within a year."
The recordLeads ran from 6 to 24 months in the five recessions it caught, and 34 months after the brief 1998 dip. A one-year rule would have missed 1980, 1990, 2001 and 2007.
"The yield curve has never been wrong."
The recordNot in data since 1976 until 2022, and 2022 was the longest and one of the deepest inversions ever. As of October 2026 it has produced no NBER recession. Whether it was wrong or just slow is still open; the record so far says wrong.
"The curve is inverted now."
The recordIt is not. Every maturity from 1 month to 30 years climbed in order on October 22, 2026, except a 0.03 point dip from 20 to 30 years.
Related
- Bonds just broke 2007's peak. AI is this cycle's housing boom: the article this explainer spins out of.
- What is a Treasury yield?
- How are mortgage rates determined?
- What is the Fed's reverse repo facility?
- What is quantitative tightening?
- How do interest rates affect the national debt?
FAQ
What does an inverted yield curve mean in simple terms?
It means lenders get paid more to lend to the US government for a short time than for a long time, which is the reverse of normal. It usually happens when the Federal Reserve has pushed short-term rates up and investors expect it to cut them later because the economy will slow.
Is the yield curve inverted right now?
No. On October 23, 2026 the 10-year Treasury yield was 0.31 percentage points above the 2-year and 0.78 points above the 3-month bill. The 10-year minus 2-year spread has been positive since early September 2024, and the 10-year minus 3-month spread since mid October 2025.
How long after the yield curve inverts does a recession start?
In the five recessions since 1976 that followed an inversion of the 10-year minus 2-year spread, the business cycle peak came 6 to 24 months after the first negative day. The 2022 inversion is the exception so far: 54 months later, the NBER has not dated a recession.
Did the 2022 yield curve inversion predict a recession?
Not so far. The 10-year minus 2-year spread was negative every trading day from July 6, 2022 to August 26, 2024, 537 days, the longest run in data back to 1976, and reached minus 1.08 points on July 3, 2023. As of October 2026 the NBER has not declared a recession starting after it, though the NBER dates recessions with a lag of months.
Why does an inverted yield curve predict recessions?
Mostly because it measures how tight the Fed is relative to where markets expect rates to go. Short yields follow the Fed's current rate; long yields reflect expected future rates plus a term premium. When the Fed is far above where markets think it will end up, it usually means the Fed is squeezing the economy, and banks that borrow short and lend long earn less on new loans.
Sources
All checked October 24, 2026.
Data (Federal Reserve Bank of St. Louis, FRED)
- T10Y2Y: 10-year minus 2-year Treasury constant maturity, daily since June 1, 1976.
- T10Y3M: 10-year minus 3-month, daily since January 4, 1982.
- USREC: NBER-based recession indicator, monthly, through September 2026.
- DGS1MO to DGS30: Treasury par yields by maturity for the curve comparison.
Primary
- National Bureau of Economic Research, US Business Cycle Expansions and Contractions: peak months Jan 1980, Jul 1981, Jul 1990, Mar 2001, Dec 2007, Feb 2020; and the Business Cycle Dating Committee on how dates are set after the fact.
- US Treasury, Daily Treasury Par Yield Curve Rates.
- Federal Reserve, FOMC statement of September 16, 2026: target range raised to 3.75% to 4%.
- Federal Reserve Bank of New York, The Yield Curve as a Leading Indicator.
- Arturo Estrella and Frederic S. Mishkin, The Yield Curve as a Predictor of U.S. Recessions, Current Issues in Economics and Finance, Federal Reserve Bank of New York, June 1996.
- Campbell R. Harvey, Duke University: the 1986 dissertation linking the term structure to economic growth.
Our data and math
- data.csv: daily spreads with the monthly recession flag. Episodes group negative days less than 180 calendar days apart; lead = months from the first negative day to the NBER peak month. The 537-day and 423-day runs count consecutive trading days with a negative close.
Images
- Hero: rendered by Tensorust with the Proof Engine from FRED and NBER data.
- Spread history and curve comparison charts: Tensorust, from FRED data.
Next question
Every number on this page links to its source and was checked on Oct 24, 2026. Spot an error or a newer figure? Email matt@tensorust.com and it gets fixed. Related: See a trillion dollars at true size.
Read next
- Article · Oct 23, 2026Bonds just broke 2007's peak. AI is this cycle's housing boom
- Article · Oct 23, 2026Boomers, debt and asset prices: is the market playing hot potato?
- Explainer · Oct 24, 2026What is private credit, and why are funds gating withdrawals?
- Explainer · Oct 24, 2026What is the debt ceiling, and when does the US hit it again?
Get the next one by email.
What my AI agents tried this week, with the real numbers: what worked, what flopped, what made money. One email when there is something worth reading.
No spam, never sold. Every email has a one-click unsubscribe.