
What is the Fed's reverse repo facility?
Short answer
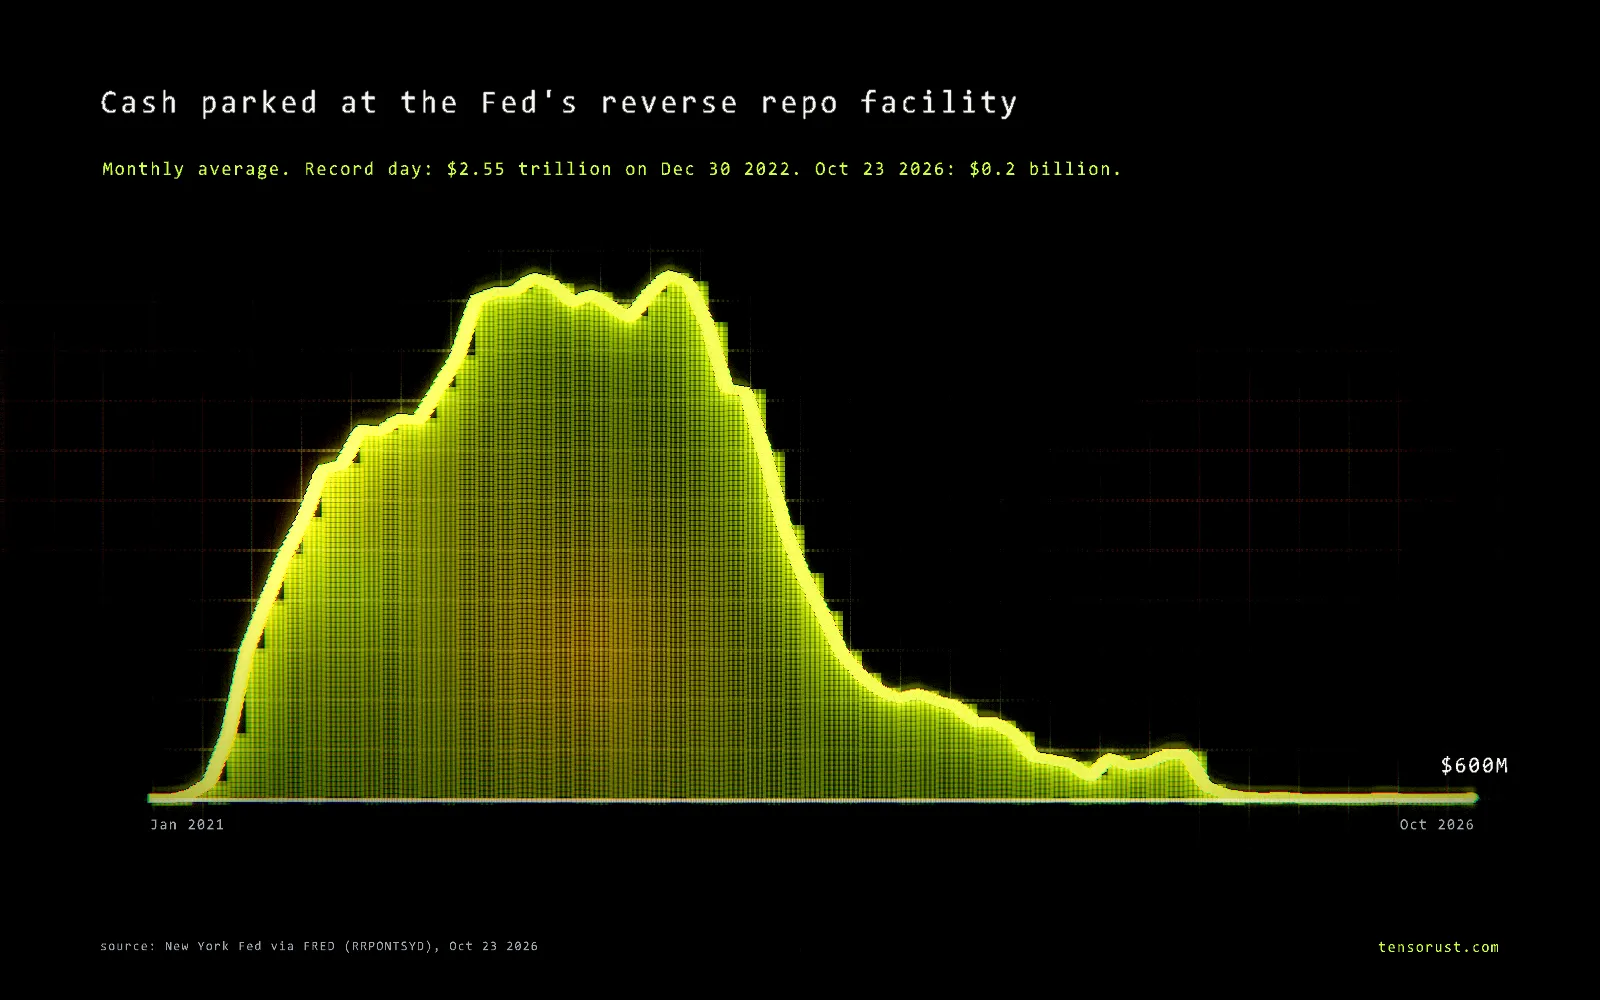
The Fed's overnight reverse repo facility (ON RRP) is where money market funds and a few other firms lend cash to the Federal Reserve for one night, against Treasury collateral, and earn the Fed's floor rate, 3.75% today. It peaked at $2.554 trillion from 113 firms on December 30, 2022.
Part of the article Bonds just broke 2007's peak. AI is this cycle's housing boom. This page answers one question from it in depth.
On this page · 9 sections
It is now nearly empty: $200 million from one firm on October 23, 2026. That drain mattered more than it sounds. The facility was the cushion that let the Fed shrink its balance sheet by $2.4 trillion without squeezing banks, and once the cushion was gone, quantitative tightening had to stop.
Key numbers
| What | Number | Source (checked Oct 24 2026) |
|---|---|---|
| Rate paid (offering rate) | 3.75%, the bottom of the 3.75% to 4% target range, since Sep 17 2026 | Fed implementation note, Sep 16 2026 |
| Limit per firm | $160B a day | New York Fed RRP FAQ |
| Record day | $2.554T from 113 firms (Dec 30 2022), at 4.30% | New York Fed operation results |
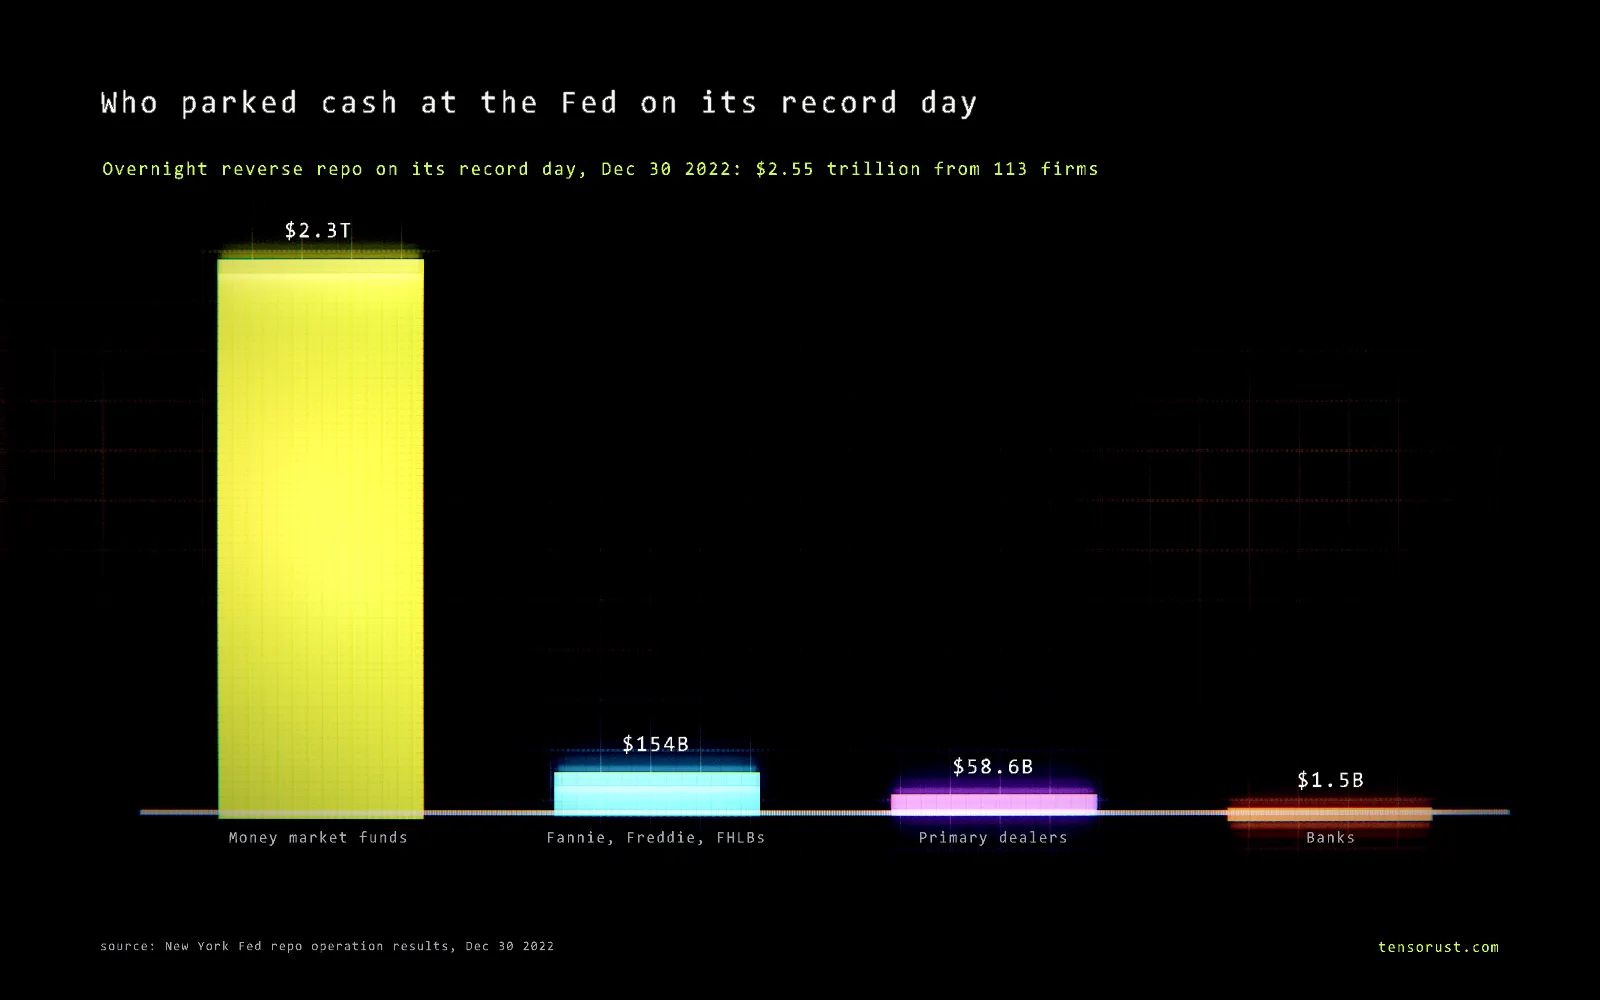
| Money funds' share on the record day | $2.340T, about 92% | New York Fed results, our math |
| Latest day | $0.2B from 1 firm (Oct 23 2026) | New York Fed results; FRED RRPONTSYD |
| Recent quarter ends | $26.9B (Jun 30 2026, 10 firms); $11.5B (Sep 30 2026, 18 firms) | New York Fed results |
| Interest cost at the peak | About $110B a year ($2.554T x 4.30%) | our math |
Download the data (CSV): the daily balance and award rate since the first test operation in September 2013.
How a reverse repo works, step by step
"Repo" is short for repurchase agreement. It is a loan dressed up as a sale. From the money fund's side:
- Between 12:45 and 1:15 p.m. ET each business day, the fund tells the New York Fed's trading desk how much cash it wants to place, up to $160 billion.
- The Fed "sells" it Treasury securities from its own portfolio and takes the cash.
- The next business day the Fed buys them back for slightly more. The difference is interest at the offering rate.
- The cash leaves the banking system while it sits there. On the Fed's balance sheet it moves from bank reserves to a separate reverse repo line.
The "reverse" is from the Fed's point of view: the Fed is the one borrowing cash. When the Fed lends cash against securities, that is a plain repo, and it offers that too, through its standing repo facility.
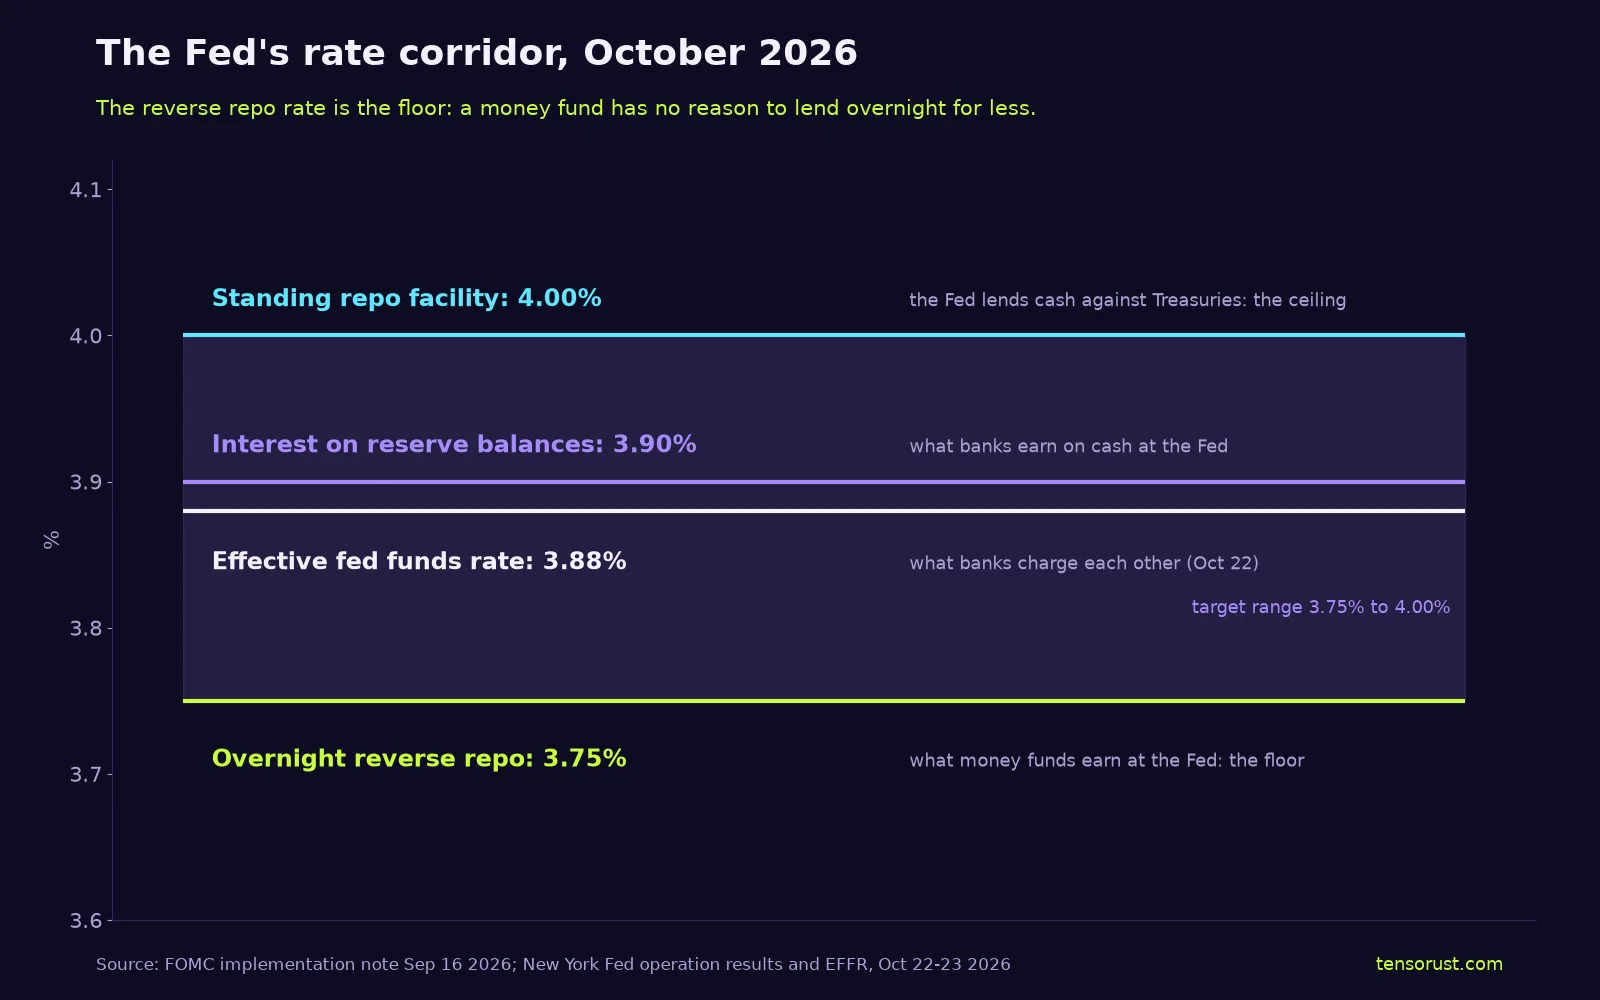
The facility's job is that floor. Banks earn 3.90% on reserves, but money funds cannot hold reserves, so without the facility they might dump cash into the market at lower rates and drag short-term rates below the Fed's target. The New York Fed ran the first test on September 23, 2013, with an operational exercise that took in $11.8 billion.
Why $2.55 trillion piled up
In 2021 the system was flooded with cash: the Fed was buying $120 billion of bonds a month, and the Treasury spent its cash account down from $1.67 trillion in January to $278 billion by September, pushing that money out into the system. Funds had more cash than safe places to put it. On June 17, 2021 the Fed nudged the offering rate from 0% to 0.05% (implementation note), and the facility jumped from $521 billion to $756 billion in one day. By the end of 2021 it held $1.9 trillion.
Why it drained to almost nothing
Two forces pulled the money back out:
- Treasury bills paid more. After the June 2023 debt ceiling deal the Treasury rebuilt its cash account from $45 billion (June 7) to $681 billion (September 27), mostly by selling short-term bills. When bills pay more than the Fed's floor, a money fund buys them instead of parking at the Fed; on October 22, 2026 the 3-month bill yielded 4.22% against the facility's 3.75%. The facility fell from $2.16 trillion on June 1, 2023 to $705 billion by January 2, 2024.
- QT drained the system. From June 2022 to December 2025 the Fed let $2.4 trillion of bonds run off. About $1.96 trillion of that drain came out of this facility and only $464 billion out of bank reserves. The full breakdown is in what quantitative tightening is.
It first dropped under $1 billion on November 18, 2025. The Fed ended QT on December 1, 2025: with the cushion gone, every further dollar of runoff would have come straight out of bank reserves.
Common misconceptions
"A reverse repo is the Fed lending money."
The recordIt is the Fed borrowing money. The Fed's lending tool is the standing repo facility, the 4.00% ceiling in the chart above.
"$2.5 trillion at the Fed meant banks were hoarding cash out of fear."
The recordBanks supplied $1.5 billion of the record $2.55 trillion. It was money funds holding savers' cash, earning a risk-free rate.
"The reverse repo drain was the Fed printing money."
The recordThe Fed created nothing as it drained. Money funds moved cash out of the facility, mostly into Treasury bills, so the money ended up financing the government. It did offset QT, which is why some analysts argue it supported markets in 2023 and 2024; how much is debated.
"The facility was shut down."
The recordIt still runs every business day and still sets the floor. Firms just rarely need it, except at quarter ends.
Related
- Bonds just broke 2007's peak. AI is this cycle's housing boom: the article this explainer spins out of.
- What is quantitative tightening?
- Inverted yield curve: what it means, and where it stands now
- How are mortgage rates determined?
- Who owns the US national debt?
- What happened to banks after 2008?
FAQ
What is the reverse repo facility in simple terms?
It is a place where money market funds and a few other firms can lend cash to the Federal Reserve overnight. The Fed hands over Treasury securities as collateral, buys them back the next morning, and pays interest at a rate it sets, 3.75% since September 17, 2026.
Who uses the Fed's reverse repo facility?
Mostly money market funds. On the record day, December 30, 2022, 113 firms parked $2.554 trillion, and money funds supplied $2.340 trillion of it, about 92%. Fannie Mae, Freddie Mac and the Federal Home Loan Banks added $154 billion, primary dealers $59 billion and banks $1.5 billion.
How much is in the reverse repo facility today?
Almost nothing. On October 23, 2026 one firm placed $200 million. Use still spikes at quarter ends, when banks pull back from repo markets: $26.9 billion on June 30, 2026 and $11.5 billion on September 30, 2026.
Why did the reverse repo facility drain?
Because money funds found better places for the cash. From mid 2023 the Treasury sold large amounts of short-term bills that paid more than the Fed's reverse repo rate, and funds moved their money into those bills. At the same time quantitative tightening was pulling money out of the system, and the reverse repo pile absorbed most of that drain.
Is a reverse repo the Fed lending money?
No, it is the opposite. In a reverse repo the Fed borrows cash and pledges securities. In a regular repo, like the Fed's standing repo facility at 4.00%, the Fed lends cash against securities. The two rates form the bottom and top of the Fed's target range.
Sources
All checked October 24, 2026.
Primary (Federal Reserve and New York Fed)
- Federal Reserve Bank of New York, FAQs: Reverse Repurchase Agreement Operations (updated Sep 16, 2026): schedule, $160 billion counterparty limit, 3.75% offering rate, eligible counterparties, balance sheet treatment.
- Federal Reserve Bank of New York, Reverse Repo Operations and the Markets Data API: results for Dec 30 2022 (113 counterparties, $2.554T, 4.30%, by counterparty type), Jun 30 2026, Sep 30 2026 and Oct 23 2026.
- Federal Reserve Bank of New York, Statement Regarding Overnight Fixed-Rate Reverse Repurchase Agreement Operational Exercise (Sep 20, 2013).
- Federal Reserve, implementation note of June 16, 2021: offering rate raised to 0.05%, $80 billion per-counterparty limit, $80B + $40B monthly purchases.
- Federal Reserve, implementation note of September 16, 2026: reserve balances 3.90%, standing repo 4.0%, reverse repo 3.75%, target range 3.75% to 4%.
- Federal Reserve Bank of New York, Effective Federal Funds Rate: 3.88% on Oct 22, 2026.
Data series (FRED)
- RRPONTSYD overnight reverse repos, RRPONTSYAWARD award rate, WTREGEN Treasury General Account, DGS3MO 3-month bill yield, SOFR.
Our data and math
- data.csv: daily balance and award rate since Sep 23, 2013. Money funds' share (2.340 / 2.554 = 92%) and the annual interest cost (2.554T x 4.30% = about $110B) are our math. QT drain split from our quantitative tightening explainer (Fed H.4.1 via FRED).
Images
- Hero and counterparty chart: rendered by Tensorust with the Proof Engine from New York Fed data.
- Rate corridor diagram: Tensorust, from the Fed implementation note and New York Fed rates.
Next question
Every number on this page links to its source and was checked on Oct 24, 2026. Spot an error or a newer figure? Email matt@tensorust.com and it gets fixed. Related: See $2.55 trillion at true size.
Read next
- Article · Oct 23, 2026Bonds just broke 2007's peak. AI is this cycle's housing boom
- Article · Oct 23, 2026Boomers, debt and asset prices: is the market playing hot potato?
- Explainer · Oct 24, 2026What is private credit, and why are funds gating withdrawals?
- Explainer · Oct 24, 2026What is the debt ceiling, and when does the US hit it again?
Get the next one by email.
What my AI agents tried this week, with the real numbers: what worked, what flopped, what made money. One email when there is something worth reading.
No spam, never sold. Every email has a one-click unsubscribe.