
How are mortgage rates determined?
Short answer
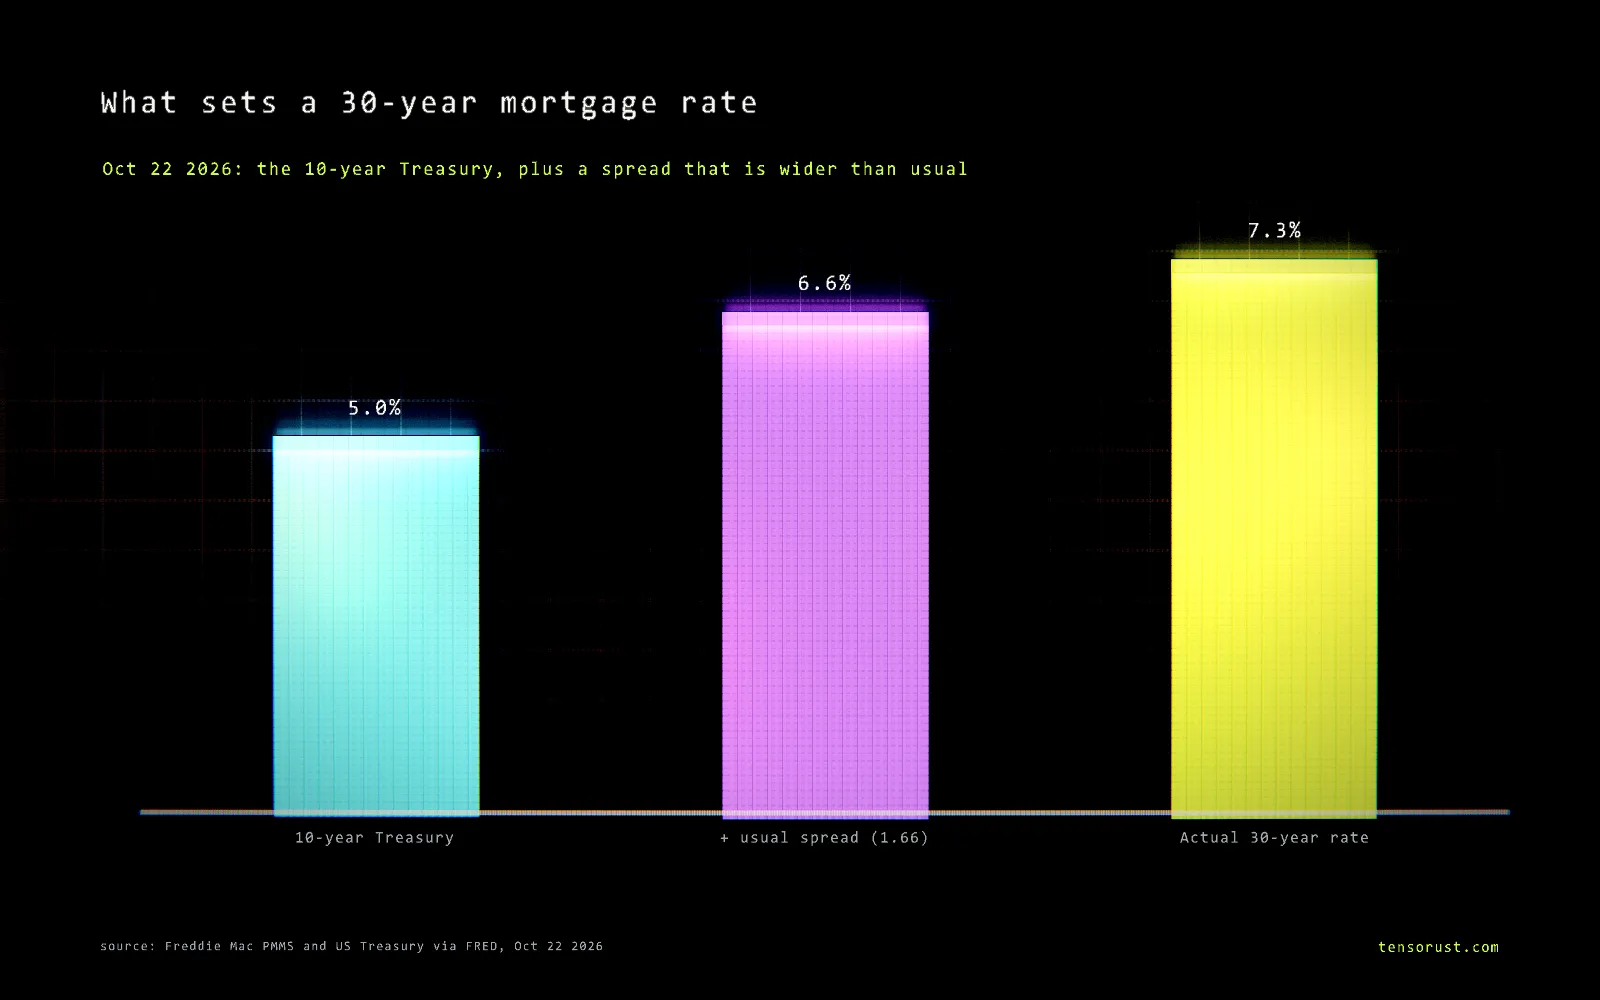
A 30-year mortgage rate is roughly the 10-year Treasury yield plus a gap that pays mortgage investors for the risk that you refinance or pay off early. On October 22, 2026 that was 4.96% + 2.36 points = 7.32%, Freddie Mac's weekly average. The Fed's short-term rate is not the input; long-term bond yields are.
Part of the article Bonds just broke 2007's peak. AI is this cycle's housing boom. This page answers one question from it in depth.
On this page · 8 sections
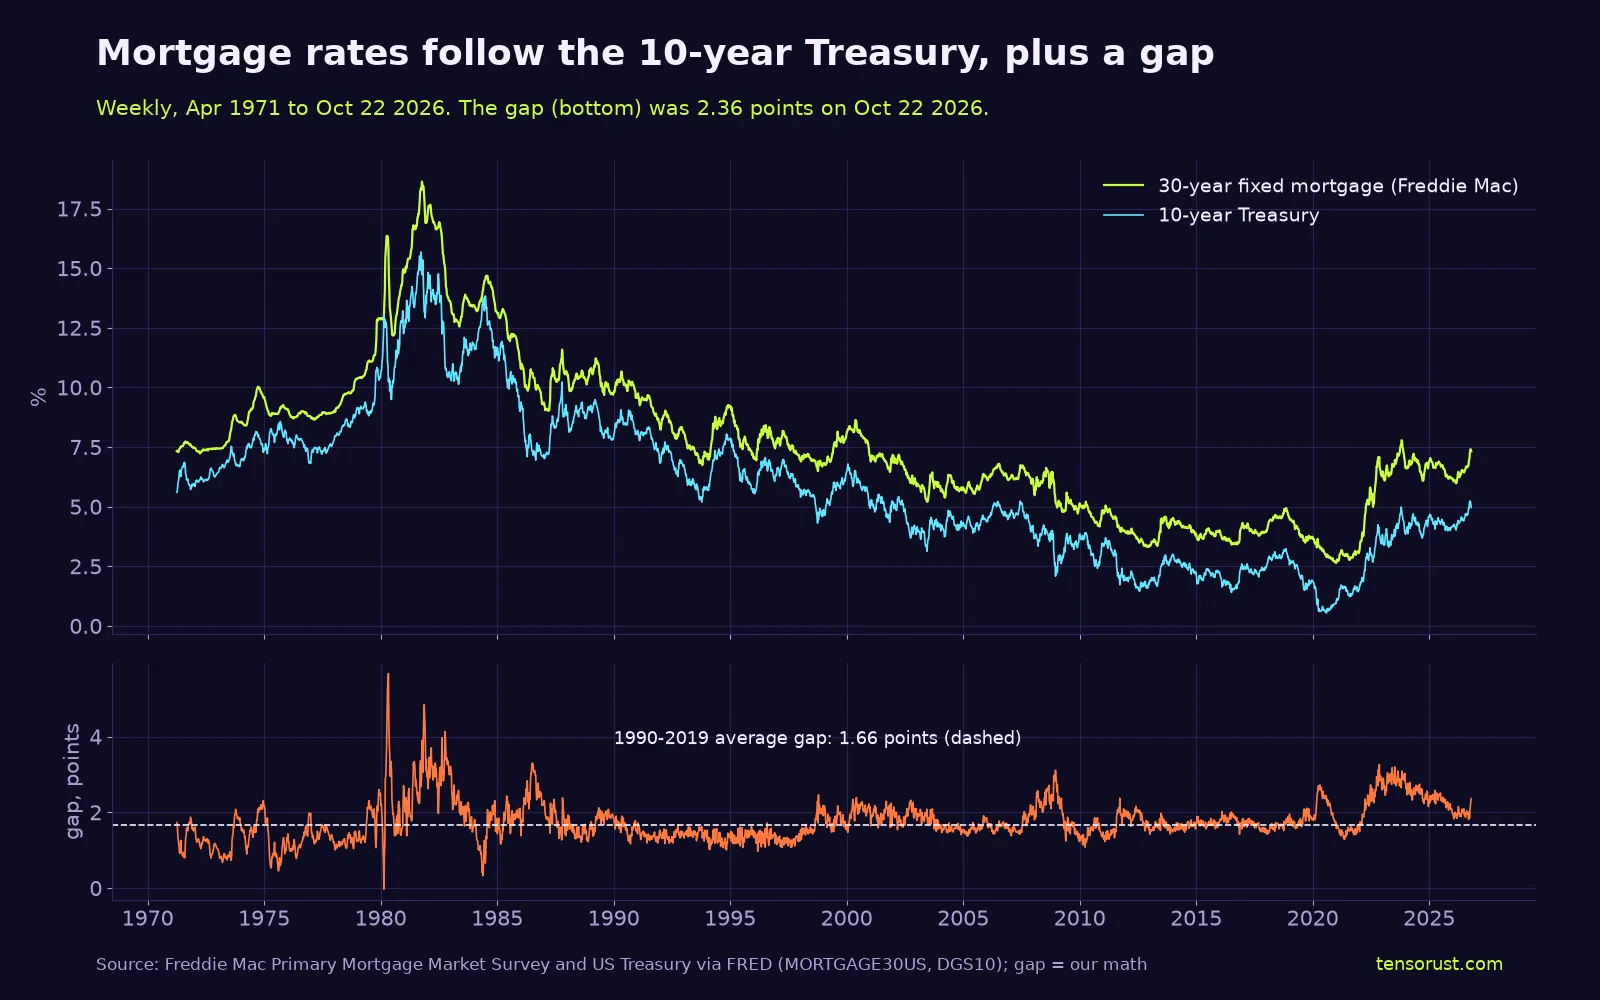
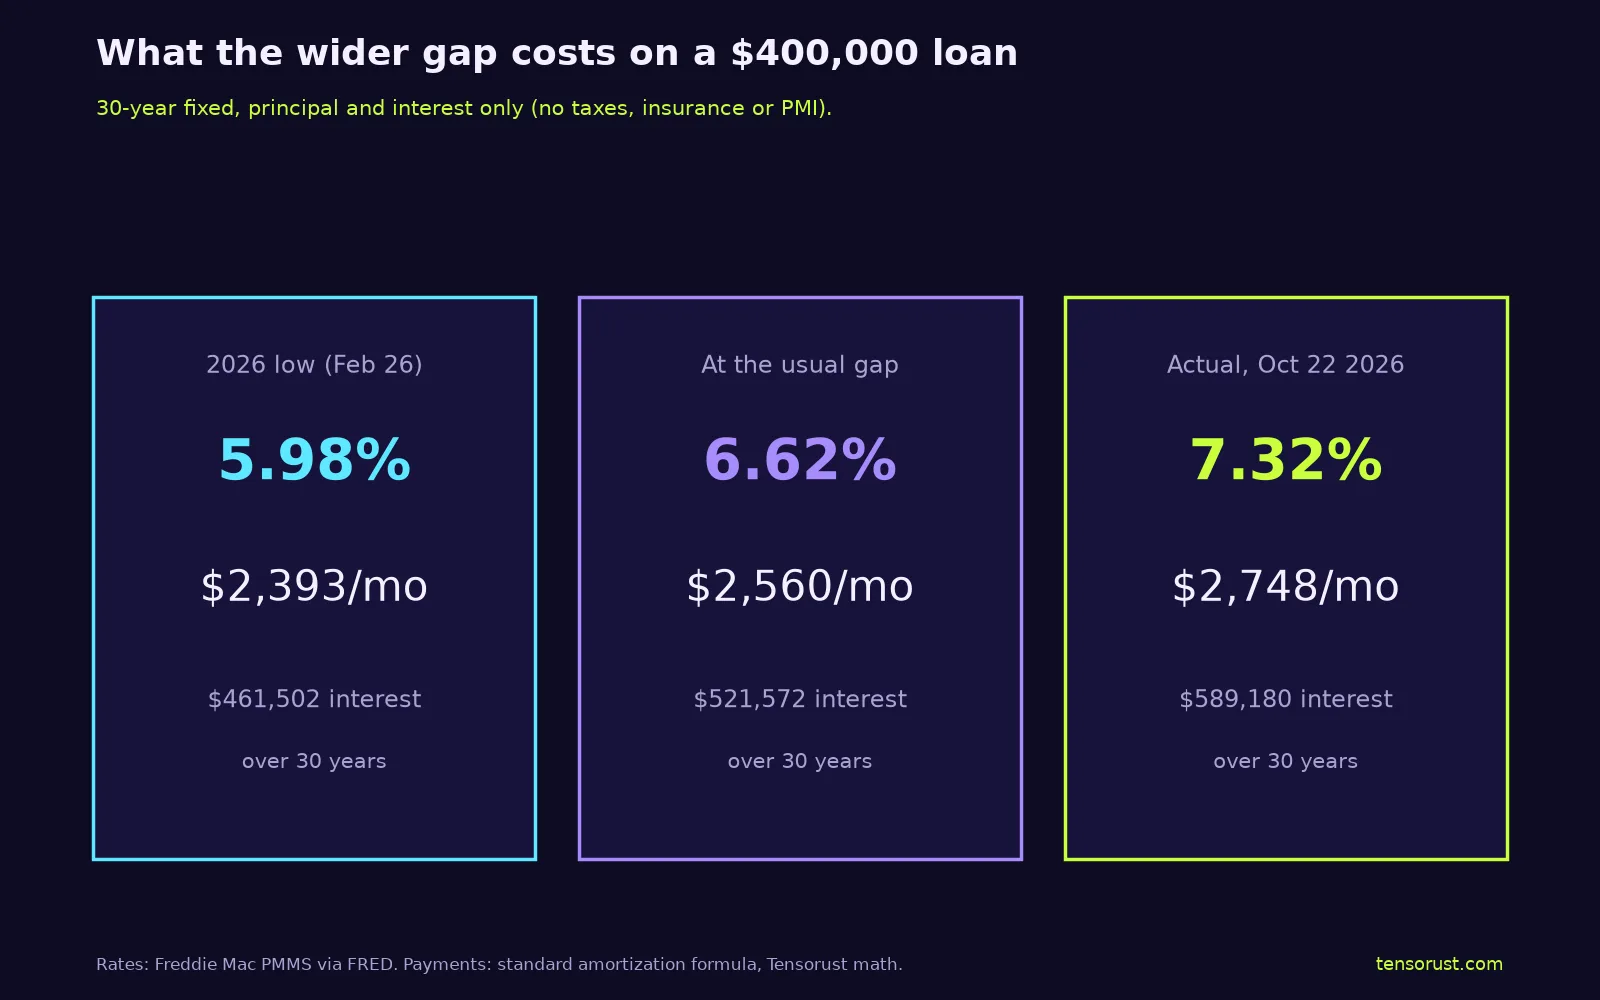
The gap is the part most people never hear about. It averaged 1.66 points from 1990 to 2019. At that normal gap today's rate would be about 6.62%, which on a $400,000 loan is $188 a month less than at 7.32%. Your personal rate then moves from that average with your credit score, down payment and loan type.
Key numbers
| What | Number | Source (checked Oct 24 2026) |
|---|---|---|
| 30-year fixed average | 7.32% (week of Oct 22 2026); 6.19% a year earlier | Freddie Mac PMMS |
| 15-year fixed average | 6.68% (Oct 22 2026) | Freddie Mac PMMS |
| 10-year Treasury yield | 4.96% (Oct 22 2026) | FRED DGS10 |
| Mortgage minus 10-year gap | 2.36 points now; 1.66 average 1990 to 2019; 2.85 average in 2023 | FRED MORTGAGE30US and DGS10, our math |
| 2026 range so far | 5.98% (Feb 26) to 7.40% (Oct 8 and Oct 15) | FRED MORTGAGE30US |
| Fed's policy rate | 3.75% to 4.00% (raised Sep 16 2026) | FOMC statement |
| Cost of the extra gap on $400,000 | $2,748 vs $2,560 a month; $67,608 more interest over 30 years | our math (standard amortization) |
Download the data (CSV): every weekly 30-year and 15-year average since 1971 with the 10-year yield and the gap.
How a mortgage rate gets made, step by step
- Your lender usually does not keep the loan. Most 30-year fixed mortgages are pooled into mortgage-backed securities (MBS) guaranteed by Fannie Mae, Freddie Mac or Ginnie Mae and sold to investors: banks, pension funds, foreign buyers and, until 2022, heavily the Fed.
- Those investors compare MBS to Treasuries. Few 30-year mortgages last 30 years: people move, sell or refinance long before, so investors benchmark them against the 10-year Treasury yield rather than the 30-year. (Why that yield moves is in what a Treasury yield is.)
- They demand extra for the catch. If rates fall, borrowers refinance and investors get their money back exactly when they can only reinvest at lower rates; if rates rise, nobody refinances and they are stuck with a low-yielding loan. That one-way risk, worse when rates are volatile, is the core of the gap.
- Lenders add their own costs for servicing, the guarantee fee and profit, and quote the result.
- Then your file adjusts it. Freddie Mac's survey assumes a borrower with good or excellent credit, 20% down, buying a single-family home to live in. Lower scores, smaller down payments, cash-out refinances and investment properties all price higher. Points paid upfront buy it lower. The CFPB's rate explorer shows the range for your score, state and down payment.
Why rates are this high right now
Both parts of the formula are elevated.
The 10-year is near 5%. It hit 5.31% on October 5, 2026, its highest since 2002. The long end has been rising while the Fed's rate held in the 3.75% to 4% range; our AI bubble vs 2008 piece covers why.
The gap is still wide. It averaged 2.85 points in 2023, the widest calendar year since 1982, and is 2.36 now. One structural reason is checkable: the Fed bought MBS on a huge scale in 2020 and 2021 ($40 billion a month under its June 2021 directive) and now buys none. Its MBS holdings fell from $2.71 trillion on June 1, 2022 to $1.90 trillion on October 21, 2026, and it reinvests what it gets back into Treasury bills, not mortgages (see quantitative tightening). Private buyers who replace it want more yield.
Common misconceptions
"The Fed sets mortgage rates."
The recordIt sets an overnight rate. In the last cutting cycle the Fed lowered its range by a full point between September 18 and December 18, 2024; the 30-year average went the other way, from 6.09% (September 19) to 7.04% (January 16, 2025), because the 10-year rose from 3.70% to 4.61%.
"The rate in the news is the rate I'll get."
The recordThe Freddie Mac average assumes strong credit and 20% down. It is a benchmark, not a quote.
"Mortgage rates are at record highs."
The recordThey are high for the last 20 years, not historically: the record is 18.63% in October 1981. The squeeze today comes from rates rising this fast on top of home prices that rose while rates were near 3%.
Related
- Bonds just broke 2007's peak. AI is this cycle's housing boom: the article this explainer spins out of.
- What is a Treasury yield?
- Inverted yield curve: what it means, and where it stands now
- What is the Fed's reverse repo facility?
- Is my rent fair? How to check it with free data
- Does building more housing lower rent?
FAQ
How are mortgage rates determined?
Lenders price 30-year fixed mortgages off the yield investors demand on mortgage-backed securities, which moves with the 10-year Treasury yield. So the average rate is roughly the 10-year yield plus a gap that covers prepayment risk, rate volatility and lender costs. Your own rate then moves up or down with your credit score, down payment, loan type and any points you pay.
Does the Fed set mortgage rates?
No. The Fed sets a short-term rate for overnight bank lending. Mortgage rates follow longer-term yields, which respond to inflation expectations, government borrowing and investor demand. After the Fed cut rates by a full point between September and December 2024, the 30-year mortgage average rose from 6.09% to 7.04% by mid January 2025.
Why are mortgage rates so high right now?
Two reasons. The 10-year Treasury yield is near 5% (4.96% on October 22, 2026), and the gap between mortgages and the 10-year is wider than usual: 2.36 percentage points against a 1990 to 2019 average of 1.66. On a $400,000 loan that extra 0.7 points costs about $188 a month.
What is the spread between mortgage rates and the 10-year Treasury?
It averaged 1.66 percentage points from 1990 to 2019 using Freddie Mac's weekly survey and the 10-year yield. It jumped to an average of 2.85 points in 2023, the widest year since 1982, and was 2.36 points on October 22, 2026.
What is today's average 30-year mortgage rate?
Freddie Mac's survey put the 30-year fixed average at 7.32% and the 15-year at 6.68% for the week of October 22, 2026, down from 7.40% the week before and up from 6.19% a year earlier. The survey assumes good or excellent credit and a 20% down payment, so many borrowers are quoted more.
Sources
All checked October 24, 2026.
Primary
- Freddie Mac, Primary Mortgage Market Survey and About PMMS: weekly averages released Thursdays, built from loan applications submitted through Loan Product Advisor; borrower profile of good or excellent credit, 20% down, owner-occupied single-family home purchase. 30-year 7.32% and 15-year 6.68% for Oct 22, 2026.
- Federal Reserve, FOMC statement of September 16, 2026 and September 18, 2024: the rate decisions used in the misconceptions section.
- Federal Reserve, implementation note of June 16, 2021: $40 billion a month of agency MBS purchases.
- Consumer Financial Protection Bureau, Explore interest rates and How does my credit score affect my ability to get a mortgage?.
Data series (FRED)
- MORTGAGE30US and MORTGAGE15US (Freddie Mac), DGS10 (10-year Treasury), DFEDTARU (Fed target range upper limit), WSHOMCB (Fed MBS holdings).
Our data and math
- data.csv: weekly 30-year and 15-year averages since 1971, the 10-year yield on the same Thursday (or the nearest earlier trading day), and the gap. Freddie Mac's weekly figure averages rates offered Thursday to Wednesday, so the Thursday 10-year close is an approximation.
- Gap averages: 1.66 points is the mean of weekly gaps from Jan 1990 to Dec 2019; 2.85 is the 2023 mean.
- Payments: standard 30-year amortization on $400,000, principal and interest only: 5.98% = $2,393, 6.62% = $2,560, 7.32% = $2,748.
Images
- Hero: rendered by Tensorust with the Proof Engine from Freddie Mac and Treasury data.
- Spread history chart and payment cards: Tensorust, from FRED data.
Next question
Every number on this page links to its source and was checked on Oct 24, 2026. Spot an error or a newer figure? Email matt@tensorust.com and it gets fixed. Related: See your loan's interest at true size.
Read next
- Article · Oct 23, 2026Bonds just broke 2007's peak. AI is this cycle's housing boom
- Article · Oct 23, 2026New apartments cut local rent: what happens when supply finally arrives
- Explainer · Oct 24, 2026What is private credit, and why are funds gating withdrawals?
- Explainer · Oct 24, 2026What is the debt ceiling, and when does the US hit it again?
Get the next one by email.
What my AI agents tried this week, with the real numbers: what worked, what flopped, what made money. One email when there is something worth reading.
No spam, never sold. Every email has a one-click unsubscribe.