
What is quantitative tightening?
Short answer
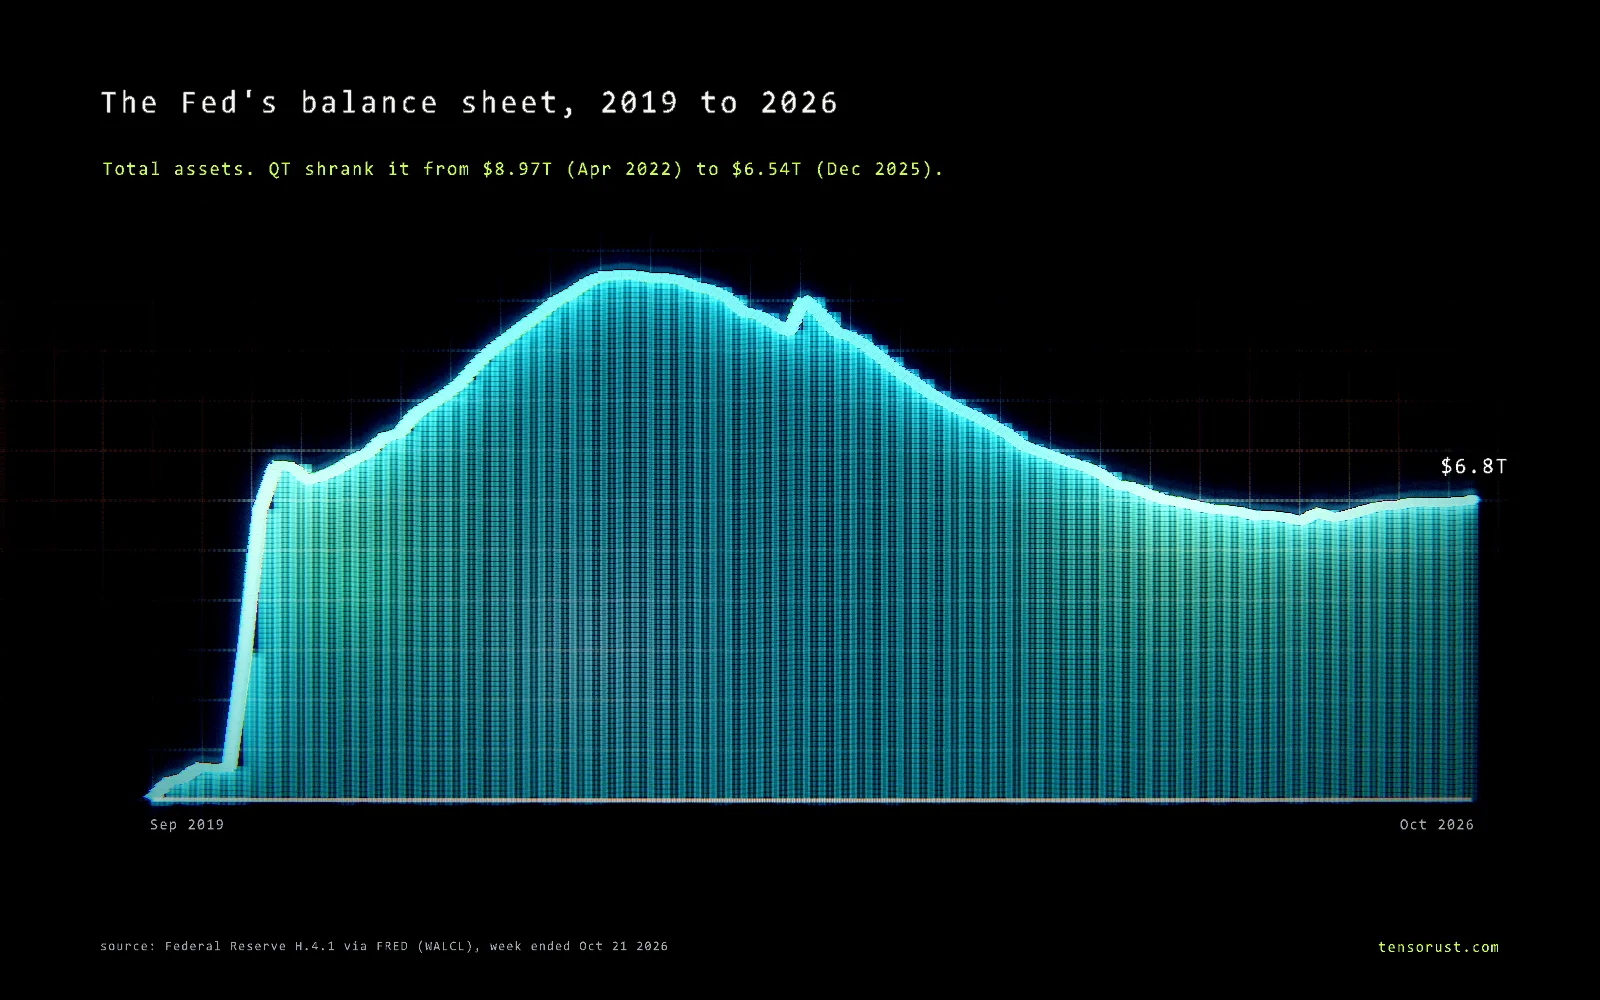
Quantitative tightening (QT) is the Federal Reserve shrinking its balance sheet by letting the bonds it owns mature without buying new ones, which pulls money back out of the financial system. The Fed's QT ran from June 1, 2022 to December 1, 2025 and cut its assets from a peak of $8.965 trillion to $6.536 trillion, a drop of $2.43 trillion (27%).
Part of the article Bonds just broke 2007's peak. AI is this cycle's housing boom. This page answers one question from it in depth.
On this page · 9 sections
QT is over. Since December 2025 the Fed has been rolling over everything that matures and, through August 2026, bought about $215 billion of extra Treasury bills to keep bank reserves from getting too thin. On October 21, 2026 its assets stood at $6.754 trillion.
Key numbers
| What | Number | Source (checked Oct 24 2026) |
|---|---|---|
| Balance sheet peak | $8.965T (Apr 13 2022) | Fed H.4.1 via FRED, WALCL |
| QT start and first caps | Jun 1 2022: $30B Treasuries + $17.5B MBS a month, doubling to $60B + $35B after three months | Fed, Plans for Reducing the Size of the Balance Sheet, May 4 2022 |
| First slowdown | Treasury cap $60B to $25B from June 2024 | FOMC statement, May 1 2024 |
| Second slowdown | Treasury cap $25B to $5B from April 2025 | FOMC statement, Mar 19 2025 |
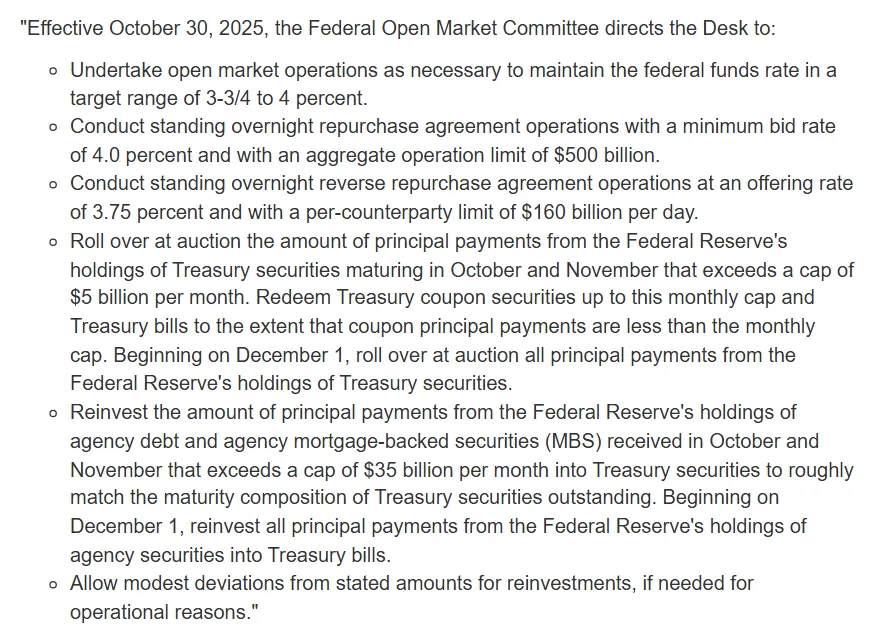
| QT ended | Dec 1 2025 (decided Oct 29 2025) | FOMC statement, implementation note |
| Low point | $6.536T (Dec 3 2025): down $2.43T, or 27%, from the peak | FRED WALCL, our math |
| Treasuries and mortgage bonds run off | $1.58T and $653B (Jun 1 2022 to Dec 3 2025) | FRED TREAST, WSHOMCB |
| Reserve management bill purchases | ~$215B, Dec 12 2025 to Aug 13 2026; none since | New York Fed purchase schedules |
| Balance sheet now | $6.754T (week ended Oct 21 2026) | Fed H.4.1, Oct 22 2026 |
Download the data (CSV): weekly total assets, Treasuries, bills, mortgage bonds and bank reserves since 2019.
How QT works, step by step
When the Fed does quantitative easing (QE), it creates bank reserves and uses them to buy Treasuries and mortgage-backed securities (MBS). It did that on a huge scale in 2020: assets went from $4.31 trillion in March 2020 to the $8.965 trillion peak two years later. QT runs the same machine backwards, but quietly:
- A bond the Fed owns matures (or, for MBS, homeowners pay down their mortgages).
- The Treasury pays the Fed back. Normally the Fed would buy a new bond with that money.
- Under QT, it doesn't, up to a monthly cap. The money the Treasury paid simply stops existing as reserves, and the Treasury has to sell that much more debt to private investors instead.
- The Fed never had to sell anything. It was runoff, not a fire sale. The caps set the speed: up to $95 billion a month at full pace from September 2022, then slower from June 2024 and again from April 2025.
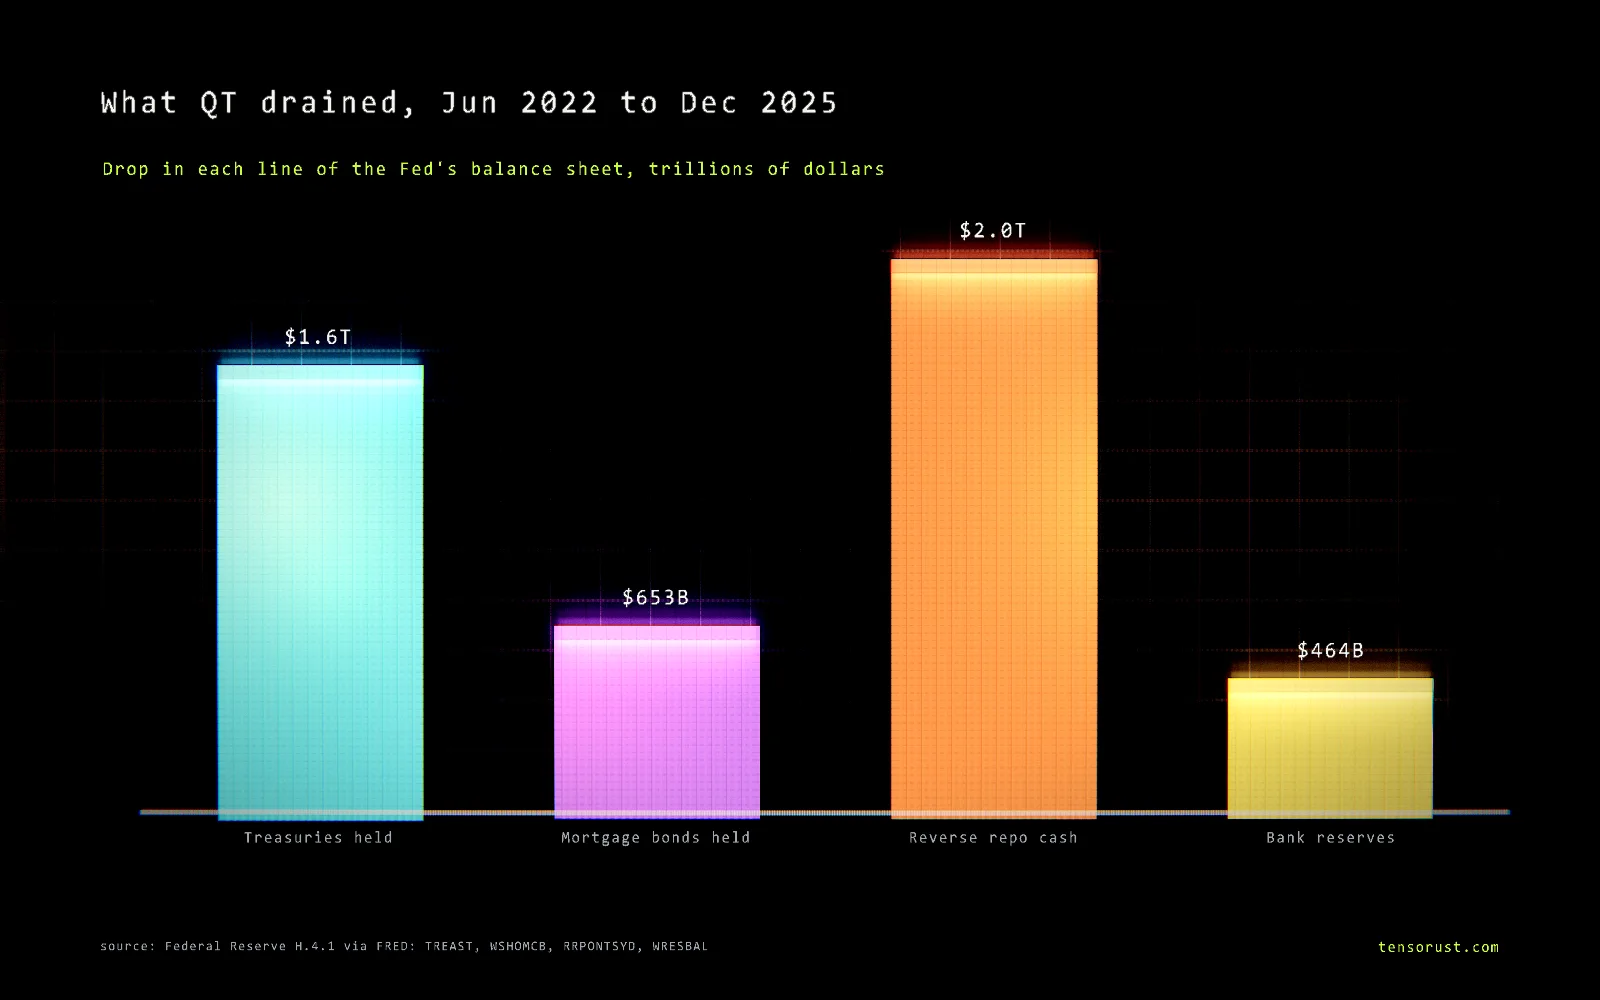
The money had to come from somewhere on the other side of the Fed's books. In June 2022 money market funds had $1.97 trillion parked overnight at the Fed's reverse repo facility, cash that was doing nothing in the economy. By December 3, 2025 that pile was down to $2.5 billion. Bank reserves fell far less, from $3.32 trillion to $2.86 trillion. That is why a $2.4 trillion drain did not break the banking system, and also why QT had to stop: once the spare cash was gone, every further dollar would have come straight out of bank reserves.
Why the Fed stopped when it did
It has done this before. The Fed's first QT shrank its assets from $4.46 trillion in October 2017 to about $3.76 trillion by August 2019, when it ended two months early. A month later, on September 17, 2019, the overnight repo rate (SOFR) jumped from 2.43% to 5.25% in a day because banks no longer had cash to spare, and in October 2019 the Fed started buying bills again.
This time it stopped first. On December 10, 2025 the Fed said reserves had "declined to ample levels" and told the New York Fed to buy Treasury bills as needed. The Desk started at $40 billion a month from December 12, said the pace would stay elevated for a few months ahead of April's tax season, then cut it to $25 billion and $10 billion, and planned no extra purchases from August 14, 2026 on.
Is the Fed still doing quantitative tightening?
No, but one part of the old program lives on. The Fed still owns $1.895 trillion of mortgage bonds, down $187 billion in the past year, because it no longer replaces them with new MBS: every dollar homeowners repay is reinvested into Treasury bills. So the balance sheet is slowly swapping 30-year mortgage risk for short-term government debt. Treasury bill holdings went from $196 billion a year ago to $568 billion on October 21, 2026.
Meanwhile rate policy went the other way. The Fed cut rates in September, October and December 2025, then raised the federal funds range to 3.75% to 4% on September 16, 2026. The balance sheet and the policy rate are separate tools, and right now they are pointing in different directions.
Common misconceptions
"QT means the Fed is selling bonds."
The recordIt never sold any. QT was runoff: the Fed simply did not replace bonds as they matured, up to a monthly cap.
"QT ended, so the Fed is easing again."
The recordEnding QT is not cutting rates, and the Fed raised rates in September 2026. The extra bill purchases are about keeping the plumbing working; the Fed called the identical 2019 purchases "purely technical measures" that "do not represent a change in the stance of monetary policy."
"QT drained trillions from banks."
The recordMostly not. Of the roughly $2.4 trillion that came out, about $1.96 trillion came from the reverse repo facility, money funds' spare cash, and $464 billion from bank reserves.
"The Fed's balance sheet is back to normal."
The recordAt $6.75 trillion it is still about 1.8 times its pre-pandemic size of $3.77 trillion (September 2019). Banks also hold far more reserves than before: $2.96 trillion on October 21, 2026 against $1.46 trillion in September 2019, a level the Fed now calls "ample."
Related
- Bonds just broke 2007's peak. AI is this cycle's housing boom: the article this explainer spins out of.
- What is a Treasury yield, and why are yields rising?
- How do interest rates affect the national debt?
- Who owns the US national debt?
- What happens if China sells its US Treasuries?
- What happened to banks after 2008?
FAQ
What is quantitative tightening in simple terms?
It is the Federal Reserve shrinking the pile of bonds it bought during crises. Instead of reinvesting the money when a Treasury or mortgage bond it owns matures, the Fed lets some of it run off, which takes that money out of the financial system. It is the reverse of quantitative easing, when the Fed creates money to buy bonds.
Is the Fed still doing quantitative tightening?
No. The Fed ended QT on December 1, 2025, after deciding on October 29, 2025 to conclude it. Since then it rolls over every maturing Treasury, reinvests mortgage bond payments into Treasury bills, and bought about $215 billion of extra bills between December 2025 and August 2026 to keep bank reserves ample. It made no extra purchases from August 14, 2026 through at least November 13, 2026.
How much did QT shrink the Fed's balance sheet?
Total assets fell from a peak of $8.965 trillion on April 13, 2022 to $6.536 trillion on December 3, 2025, a drop of $2.43 trillion or 27%. Treasury holdings fell $1.58 trillion and mortgage-backed securities $653 billion between June 1, 2022 and December 3, 2025.
Does quantitative tightening raise interest rates?
It pushes in that direction for longer-term rates, because the Fed stops being a buyer and private investors have to absorb more bonds. Economists disagree on how much. The Fed's main rate tool is still the federal funds rate, which it sets separately; in September 2026 it raised that rate to 3.75% to 4% after QT had already ended.
Are the Fed's reserve management purchases quantitative easing?
The Fed says no. It buys short-term Treasury bills to keep enough reserves in the banking system, not long-term bonds to push down long rates, and in 2019 it called the same kind of purchases purely technical measures that did not change the stance of policy. Critics note the balance sheet still grows, which is true: it rose by about $218 billion from the December 2025 low to October 2026.
Sources
All checked October 24, 2026.
Primary (Federal Reserve and New York Fed)
- Federal Reserve, Plans for Reducing the Size of the Federal Reserve's Balance Sheet (May 4, 2022): start date June 1, 2022 and the monthly caps.
- Federal Reserve, FOMC statements of May 1, 2024 (Treasury cap $60B to $25B) and March 19, 2025 (Treasury cap $25B to $5B).
- Federal Reserve, FOMC statement and implementation note of October 29, 2025: QT concludes December 1, 2025; MBS principal reinvested into Treasury bills.
- Federal Reserve, implementation note of December 10, 2025 and FOMC statement: reserves judged ample, purchases of Treasury bills to maintain them.
- Federal Reserve Bank of New York, Statement Regarding Reserve Management Purchases Operations (Dec 10, 2025) and Treasury purchase schedules: $40B a month from Dec 12, 2025, then $25B and $10B, none from Aug 14, 2026.
- Federal Reserve, H.4.1 Factors Affecting Reserve Balances, October 22, 2026: total assets, Treasury bills, MBS, reserves for the week ended Oct 21, 2026.
- Federal Reserve, FOMC statements of September 20, 2017, July 31, 2019 and October 11, 2019: the first QT and the 2019 bill purchases ("purely technical measures").
- Federal Reserve, FOMC statements of September 17, 2025 and September 16, 2026: rate decisions.
Data series (Federal Reserve Bank of St. Louis, FRED)
- WALCL total assets, TREAST Treasuries held, WSHOBL bills held, WSHOMCB MBS held, WRESBAL reserve balances, RRPONTSYD overnight reverse repos, SOFR.
Our data
- data.csv: weekly H.4.1 series since January 2019. Differences and percentages (2.43T = 8.965 - 6.536; 27% = 2.43 / 8.965; 1.58T = 5.771 - 4.189; 653B = 2.707 - 2.054; ~$215B = 4 x 40 + 25 + 3 x 10) are our math.
Images
- Hero and bar chart: rendered by Tensorust with the Proof Engine from FRED data.
- Implementation note excerpt: screenshot of the public Federal Reserve page, Oct 24, 2026.
Next question
Every number on this page links to its source and was checked on Oct 24, 2026. Spot an error or a newer figure? Email matt@tensorust.com and it gets fixed. Related: See $2.4 trillion at true size.
Read next
- Article · Oct 23, 2026Bonds just broke 2007's peak. AI is this cycle's housing boom
- Article · Oct 23, 2026Boomers, debt and asset prices: is the market playing hot potato?
- Explainer · Oct 24, 2026What is private credit, and why are funds gating withdrawals?
- Explainer · Oct 24, 2026What is the debt ceiling, and when does the US hit it again?
Get the next one by email.
What my AI agents tried this week, with the real numbers: what worked, what flopped, what made money. One email when there is something worth reading.
No spam, never sold. Every email has a one-click unsubscribe.