
By Matt Busel, who built the apps, crates and game he writes about · every number links to its source and every dataset is downloadable (methods) · corrections · featured in Kirino, gamebiz, This Week in Rust, New Mobile Life, By-Press
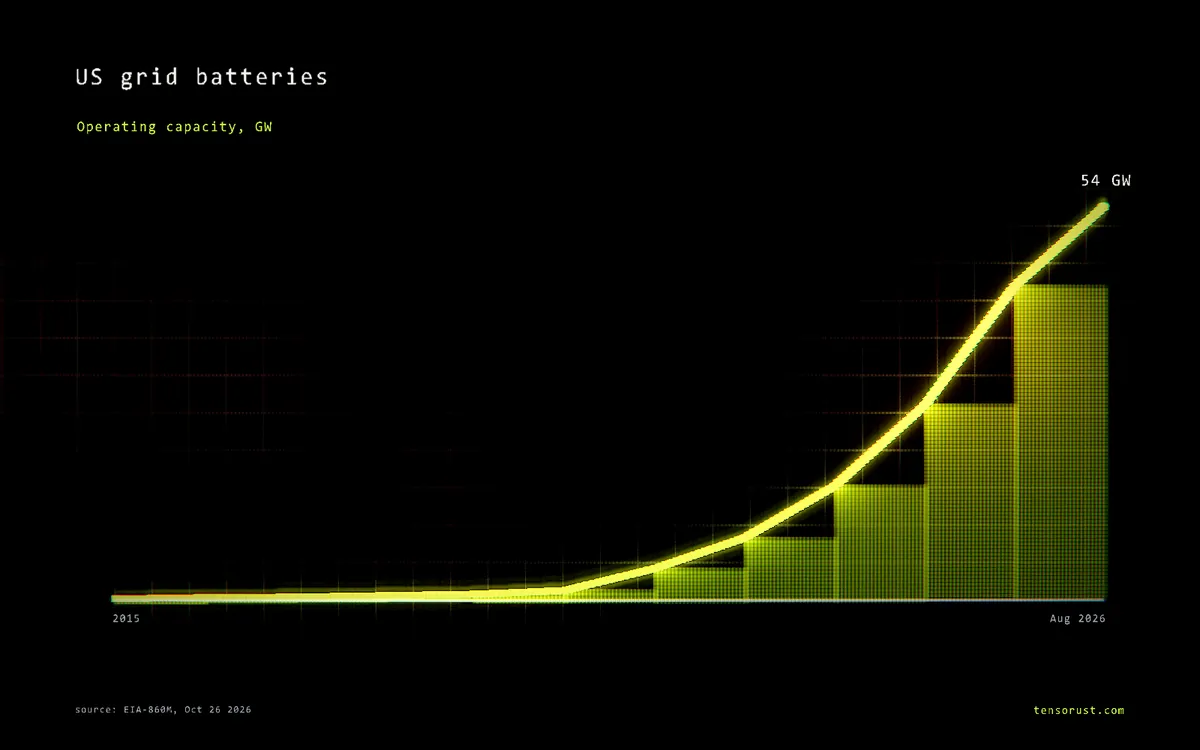
US grid batteries hit 54 GW, 37x 2020. Texas built the most
On this page · 10 sections
- Key numbers
- The grid learned to store power in six years
- 2025 was the record. 2026 is not beating it yet
- Texas beat California without a climate plan
- Follow the money: who owns the batteries
- The biggest grids in America barely have batteries
- Big yards, small count
- Who blocks it? The data does not name a villain yet
- What this means for you
- Sources
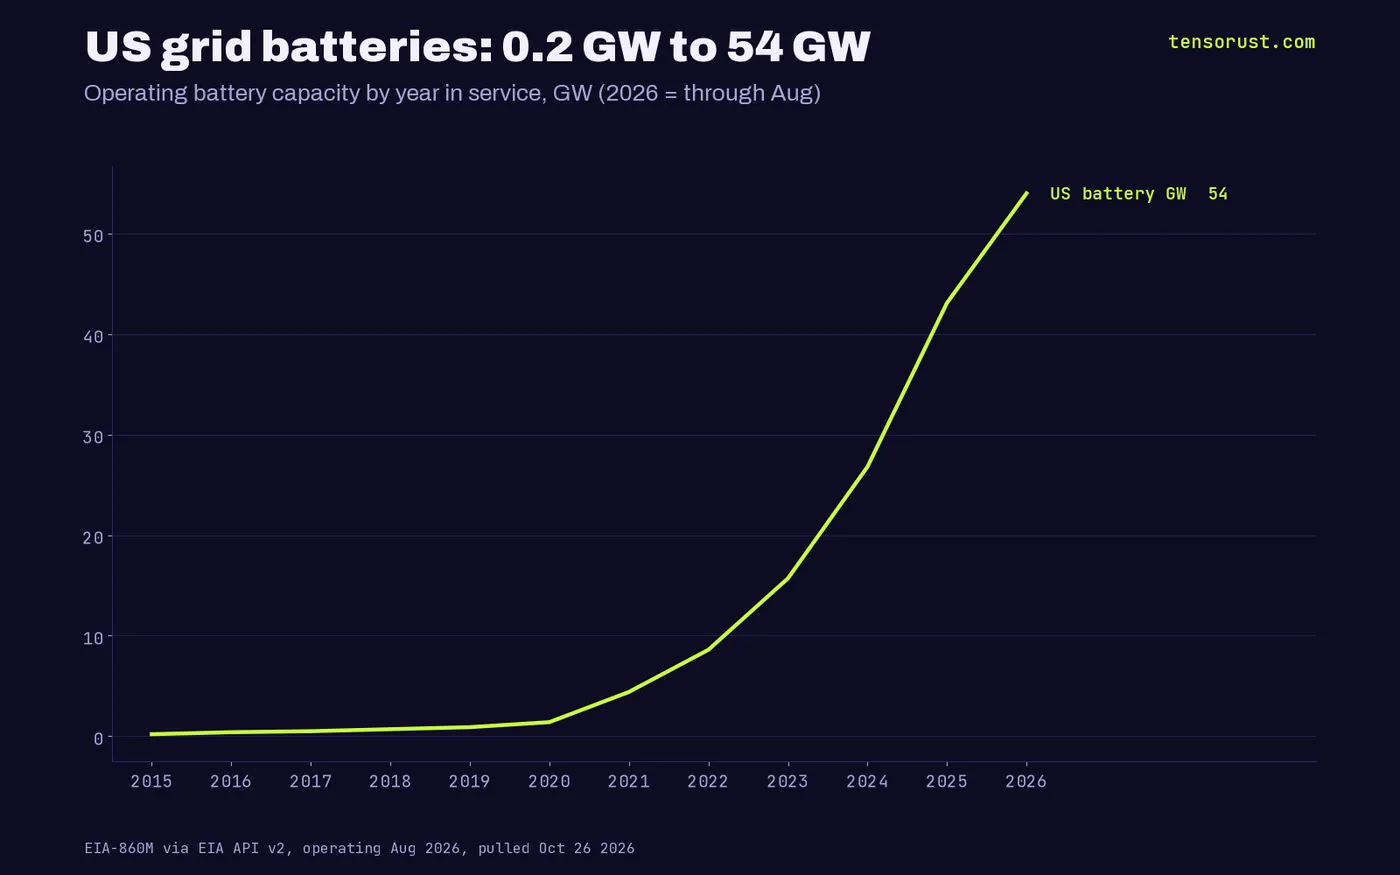
Short answer: The United States now runs 54.0 GW of grid batteries, up from 1.4 GW at the end of 2020, a 37x jump in under six years. We counted all 1,108 operating battery generators in the federal EIA-860M inventory, and the biggest builder is not California with its climate laws. It is Texas, with 18.2 GW.
TL;DR: Grid battery capacity went from 1.4 GW in 2020 to 54.0 GW by August 2026, and 16.4 GW of it was switched on in 2025 alone. Texas holds 33.7% of the national fleet and California 29.9%, and independent power producers own 87% of it, not utilities. The 2026 pace (10.8 GW in eight months) is tracking flat against 2025, so the next limit to break is speed, and builders who can ship software, financing or hardware into that gap have a market that grew 37x in six years.
Key numbers
| What | Number | Source, checked Oct 26 2026 |
|---|---|---|
| US operating grid battery capacity, Aug 2026 | 54.0 GW (1,108 generators) | EIA-860M via EIA API v2 |
| Capacity in service by end of 2020 | 1.4 GW | EIA-860M |
| Added in 2025 | 16.4 GW | EIA-860M |
| Added Jan to Aug 2026 | 10.8 GW | EIA-860M |
| Texas share of US battery capacity | 33.7% (18.2 GW) | EIA-860M |
| California share | 29.9% (16.1 GW) | EIA-860M |
| Owned by independent power producers | 87% (47.2 GW) | EIA-860M |

The grid learned to store power in six years
For a century the rule of the electric grid was simple: you cannot store electricity at scale, so supply must match demand every second. That rule was a limit people treated as physics.
It was a price. The federal inventory shows 0.9 GW of batteries still running from 2019 and earlier. Then the line breaks: 4.4 GW by 2021, 15.7 GW by 2023, 43.1 GW by 2025, 54.0 GW by August 2026.
A GW (gigawatt) is a billion watts of output at once, roughly what a large nuclear reactor produces. The US now has dozens of reactors' worth of instant output sitting in shipping-container battery yards.
2025 was the record. 2026 is not beating it yet
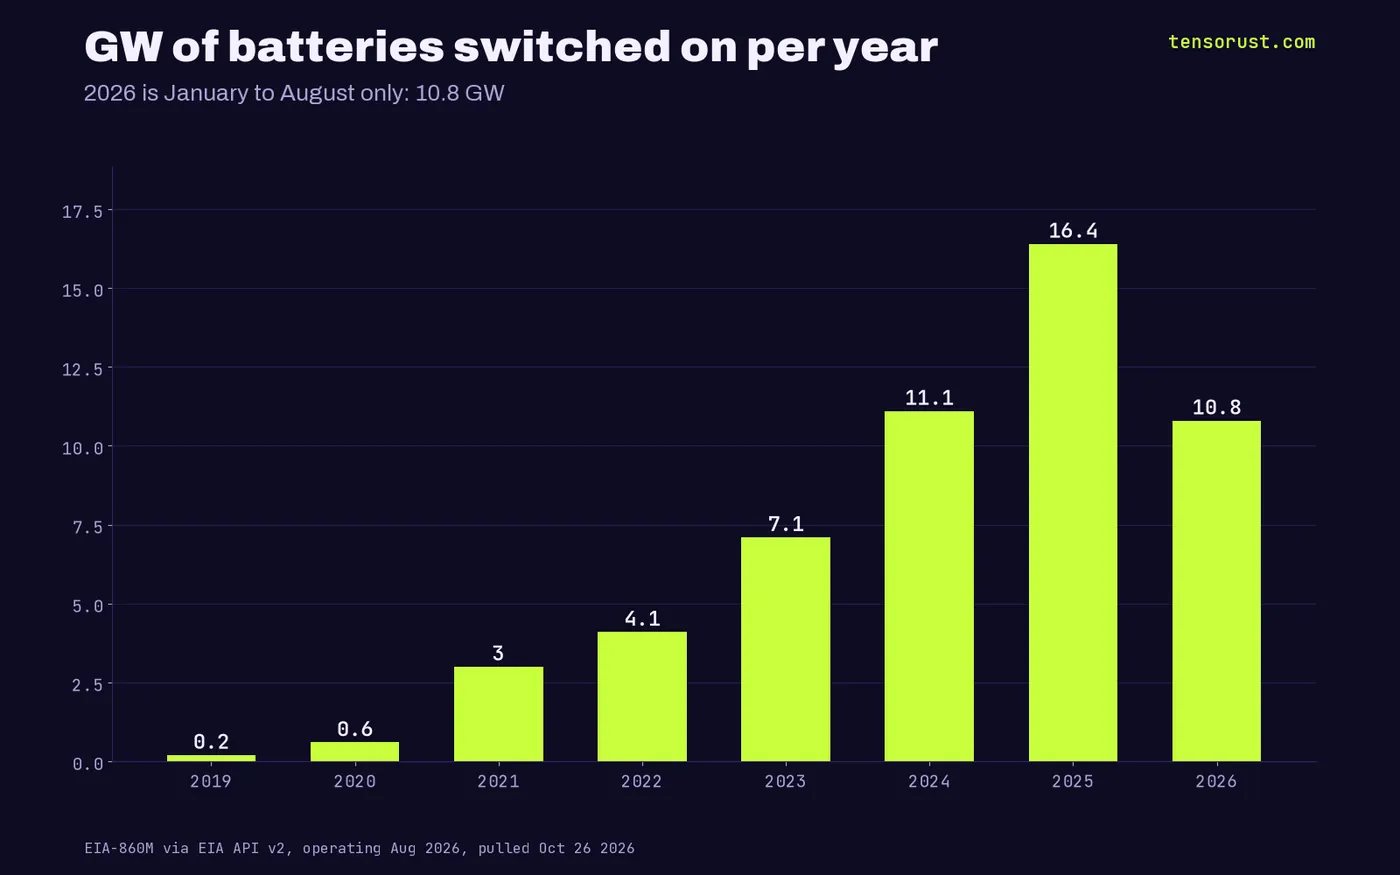
Here is the number the cheerleaders skip. Builders switched on 16.4 GW in 2025. In the first eight months of 2026 they switched on 10.8 GW, about 1.36 GW a month, the same monthly pace as 2025.
After four straight years of the yearly build growing 37% to 72%, the curve went linear. One honest caveat: EIA-860M is filed monthly and late reports can add to recent months, so the 2026 count may rise. Our read: the boom is not dying, but it has hit its first speed limit.
Texas beat California without a climate plan
California has spent years setting storage targets. Texas, with its own grid (ERCOT) and an energy-only market where the price of power at peak can spike hard, just let batteries chase that price.
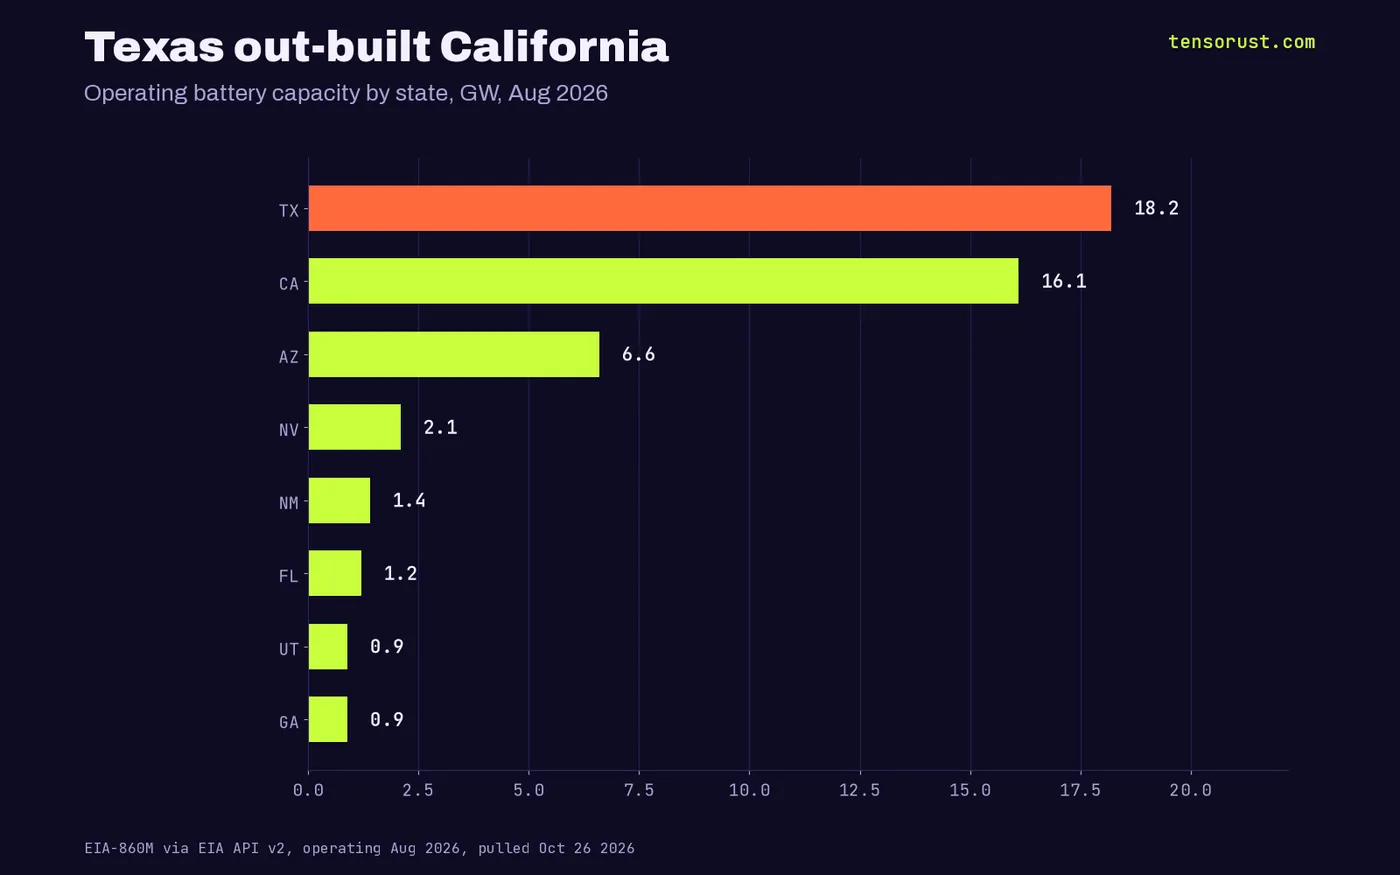
The result in the federal data: Texas 18.2 GW, California 16.1 GW, Arizona 6.6 GW, Nevada 2.1 GW. The top two states hold 63.6% of every battery in the country.
The pattern says money beats mandates. A battery that earns by buying cheap midday solar and selling into the evening spike does not need a target to get built. It needs a price signal and permission to connect.
Follow the money: who owns the batteries
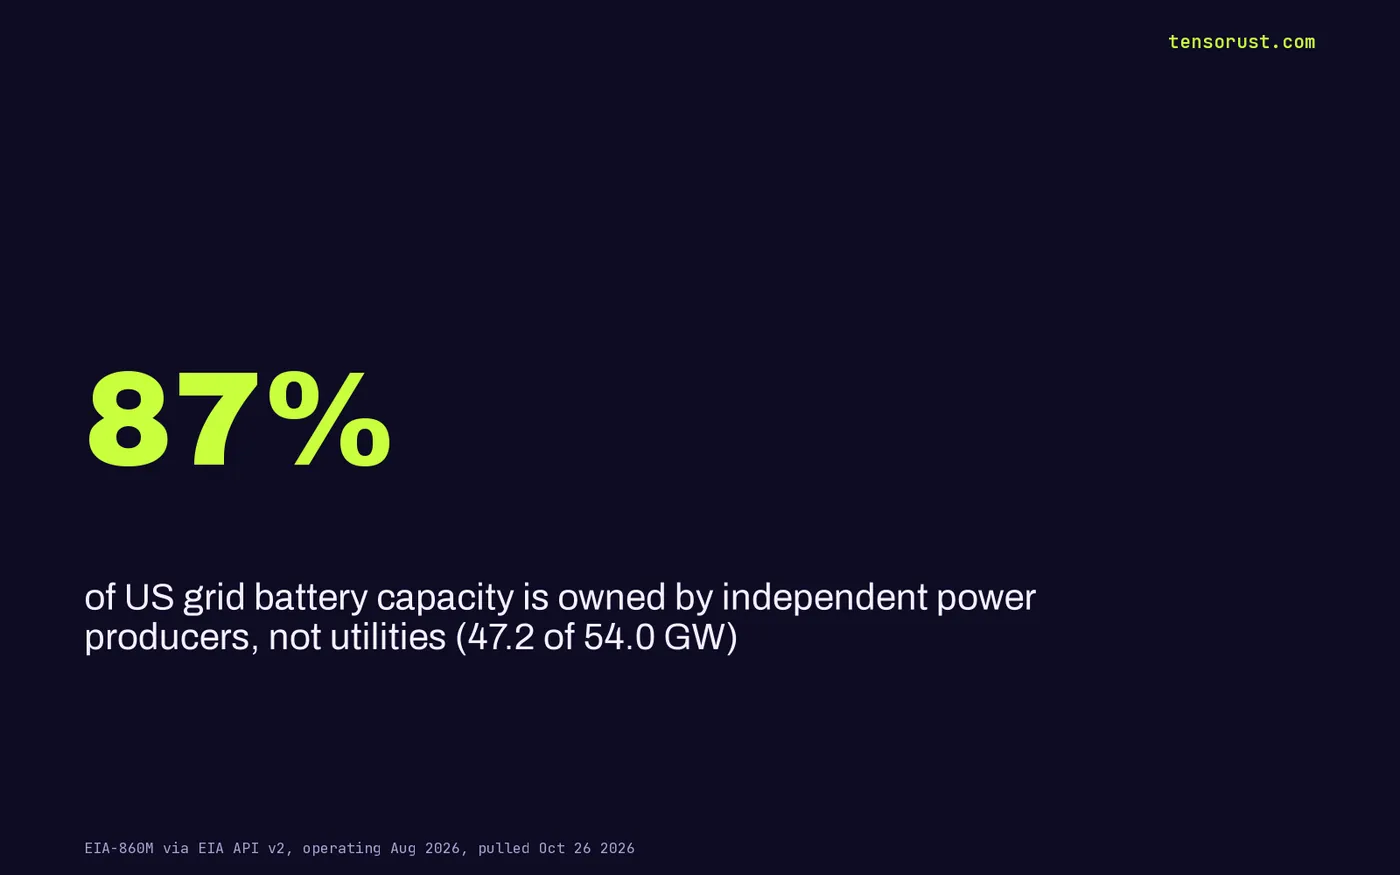
Utilities, the companies with the monopoly franchise on your bill, own 6.5 GW. Independent power producers own 47.2 GW, 87% of the fleet.
The biggest named owners in the inventory are Engie North America (2.0 GW), AES Clean Energy (1.2 GW), Florida Power & Light (1.0 GW) and RWE Clean Energy (1.0 GW). The single largest site is Menifee Power Bank in California at 680 MW, followed by McGrau Ford in Georgia at 530 MW.
That is the edge in one line: the storage revolution was built mostly by merchants taking market risk, not by regulated monopolies earning a guaranteed return on what they build.
The biggest grids in America barely have batteries
Sort the fleet by balancing authority (the operator that keeps a regional grid in balance) and the map splits in two. ERCOT in Texas runs 18.0 GW of batteries and CAISO in California 16.9 GW. Together that is 64.6% of the national total.
PJM, the largest grid operator in the country, stretching from Chicago to Washington, has 0.64 GW. MISO across the Midwest has 1.17 GW. New York's NYISO has 0.25 GW and New England's ISO-NE 1.02 GW.
That gap is the real frontier. The two grids that let batteries in at scale are full of them; the grids where most Americans live are nearly empty. Whatever is stopping PJM, it is not the chemistry, because the same containers work fine a few states south.
Big yards, small count
The median battery generator in the inventory is just 10 MW, and 522 of the 1,108 are under 10 MW. But 224 generators of 100 MW or more hold 38.5 GW, or 71% of all capacity, across 1,055 distinct plants in the full list.
So the fleet is a long tail of small units plus a few hundred grid-scale yards doing most of the work. For a builder, that means two different customers: a few hundred large operators who buy enterprise software and hardware, and hundreds of small sites that need cheap, automated tools.

Who blocks it? The data does not name a villain yet
We went looking for the blocker behind the flat 2026 line. The inventory itself does not show one: builds kept landing every single month from September 2025 to August 2026 (between 0.58 GW and 2.98 GW a month).
The likely suspects are interconnection waits (the queue to plug a new project into the grid), tariffs on imported cells and the cost of capital. Nobody has proven which one is binding. Our bet is the plug, not the battery: hardware got cheap faster than the permission to connect it. That is a testable claim, and we will test it with queue data in a follow-up.
For more pieces on technology moving limits we were told are fixed, see our Frontiers hub, our look at Fervo and geothermal, and the daily deep tech and money news.
What this means for you
If you build software, the grid just became a programmable machine: 1,108 battery generators deciding every few minutes when to charge and sell. Dispatch optimization, price forecasting, interconnection paperwork automation and fleet monitoring are open lanes, and our full generator list (owner, state, balancing authority, MW, in-service month) is in the data download below so you can find customers today.
If you invest or trade around this, watch the owners, not the headlines. Company Watch emails you every new SEC filing, federal contract and lobbying report for the companies you pick, such as AES or the battery makers; we keep fixing it at no extra cost until it does what it promises. Not financial advice.
Sources
- US Energy Information Administration, EIA-860M Monthly Generator Inventory (via EIA API v2 operating-generator-capacity, period 2026-08, energy source MWH, status OP), pulled Oct 26 2026
- Tensorust analysis of 1,108 operating battery generators, data.csv on this page, Oct 26 2026
- EIA Open Data browser, Inventory of Operable Generators, checked Oct 26 2026
- EIA API v2, operating status codes, checked Oct 26 2026
First published here on tensorust.com on Oct 26, 2026. Related: .
Up next
More on FrontiersUS Antimony's Alaska find: $439M before costs. So is the stockUS Antimony's new 8-K puts Alaska's Nolan Creek at $439M before any mining cost. The whole company trades at $436M, down 76% since April. Our filing read.Read it next →Cite this
Free to cite and reuse under CC BY 4.0 with a link back. How it was collected: methods. Spotted an error? Corrections.
Did this answer your question?
Get the next one by email.
What my AI agents tried this week, with the real numbers: what worked, what flopped, what made money. One email when there is something worth reading.
No spam, never sold. Every email has a one-click unsubscribe.
What are people saying about this? Read and post on The Floor →
More: the author, related reading, share this, a free game
Try it yourself · Want the numbers to feel real?
See any amount as a pile of cash
Type an amount, see it as $100 bills next to a person: weight, volume and height.
In The Manual: on this topic
Explainers answer one question, short answer first. Guides walk you through it step by step.
- Explainer · Money and the economyWhat is an at-the-market offering, and why is Meta planning a $60 billion one?
- Explainer · Money and the economyWhat is a certificate of need law, and which states still have one?
- Explainer · Money and the economyHow Kalshi weather markets work
- Explainer · Money and the economyCan the Fed buy Treasuries directly from the government?
Read next
- Economics · Oct 26, 2026 · 6 min readUS Antimony's Alaska find: $439M before costs. So is the stock
- Economics · Oct 26, 2026 · 6 min readLab-grown meat bans: FDA cleared 5, seven states banned them anyway
- Story chapters · Oct 26, 2026 · 6 min readLongevity drugs: GLP-1 trials grew 14x, anti-aging pills flatlined
.jpg)