
Who pays the most federal income tax?
Short answer
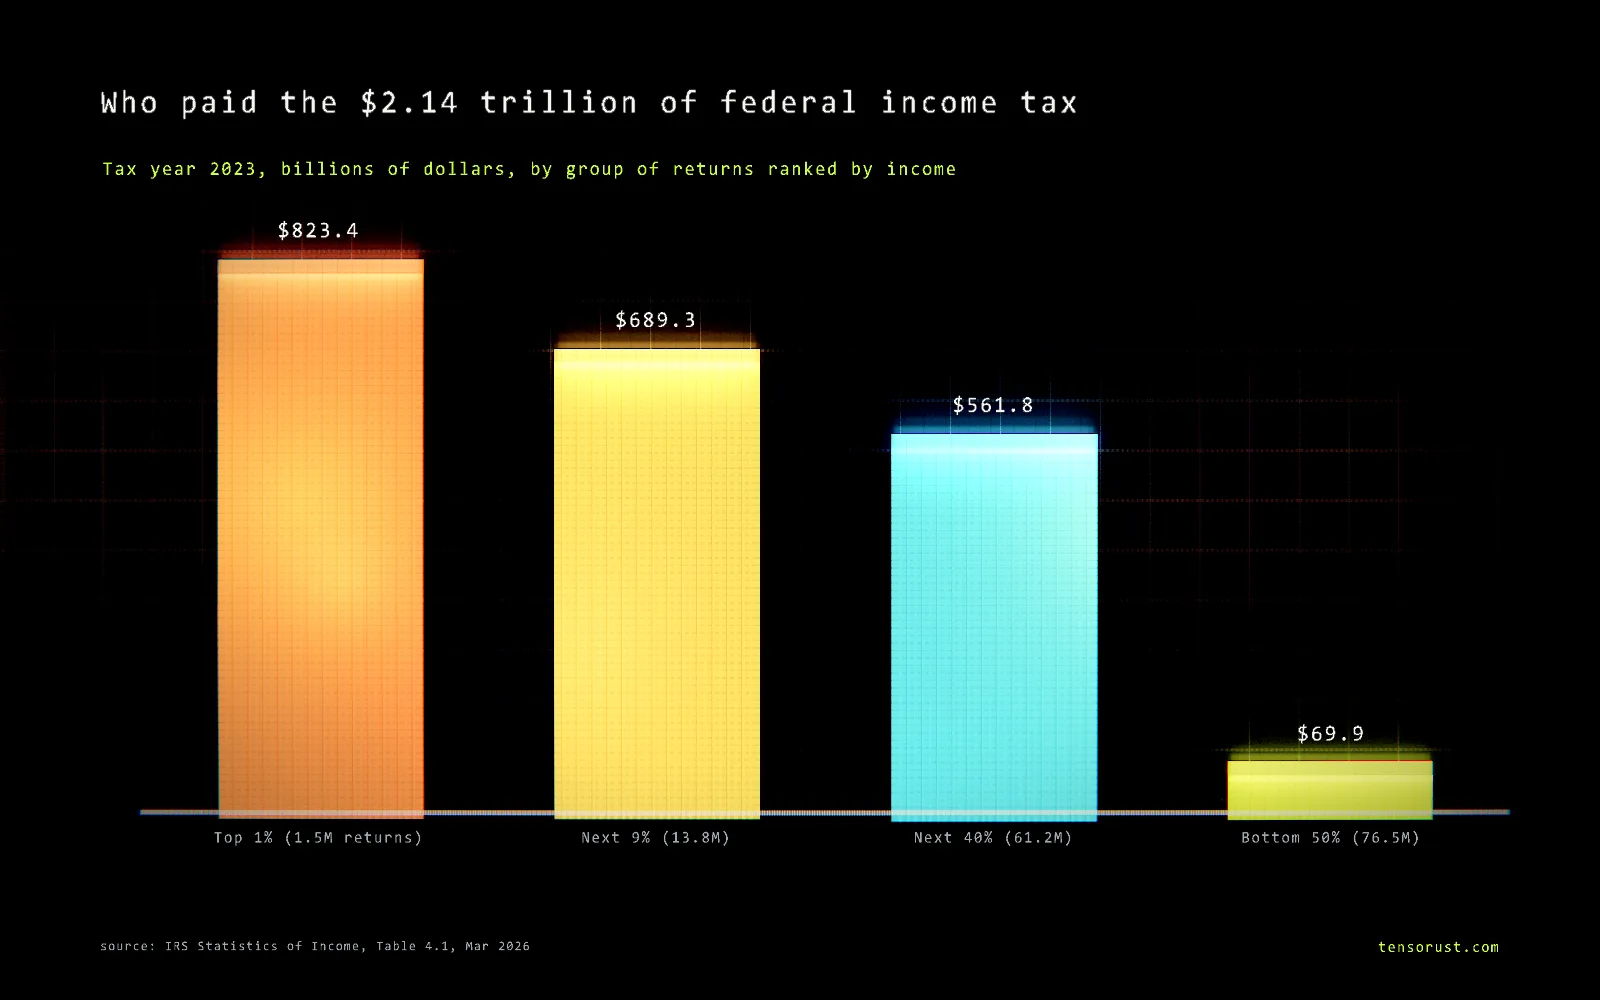
The top 1% of earners. In tax year 2023 (the latest IRS data) the 1.53 million returns with adjusted gross income above $675,602 paid $823.4 billion, or 38.4% of all federal income tax, while reporting 20.6% of the income. The top 10% paid 70.5%. The bottom half paid 3.3%.
Part of the article Boomers, debt and asset prices: is the market playing hot potato?. This page answers one question from it in depth.
On this page · 10 sections
The sharpest way to see it: the richest 1,531 returns (the top 0.001%, income above $78.6 million) paid $74.9 billion, more than the 76.5 million returns in the bottom half put together ($69.9 billion). That is income tax only; counting every federal tax, the top 1%'s share is lower, about 27%.
Key numbers
| What | Number | Source (checked Oct 24 2026) |
|---|---|---|
| All federal income tax, tax year 2023 | $2,144.4 billion on 153.1 million returns | IRS SOI Table 4.1 (Pub. 1304, March 2026) |
| Top 1%: entry income, tax paid, share | AGI over $675,602; $823.4B; 38.4% of tax on 20.6% of income | same |
| Top 10%: entry income, share | AGI over $187,608; 70.5% of tax on 47.6% of income | same |
| Top 0.001%: returns, entry income, tax | 1,531 returns; AGI over $78.6M; $74.9B (3.49% of all income tax) | same |
| Bottom 50%: tax paid, share | $69.9B; 3.26% of tax on 12.3% of income | same, our subtraction |
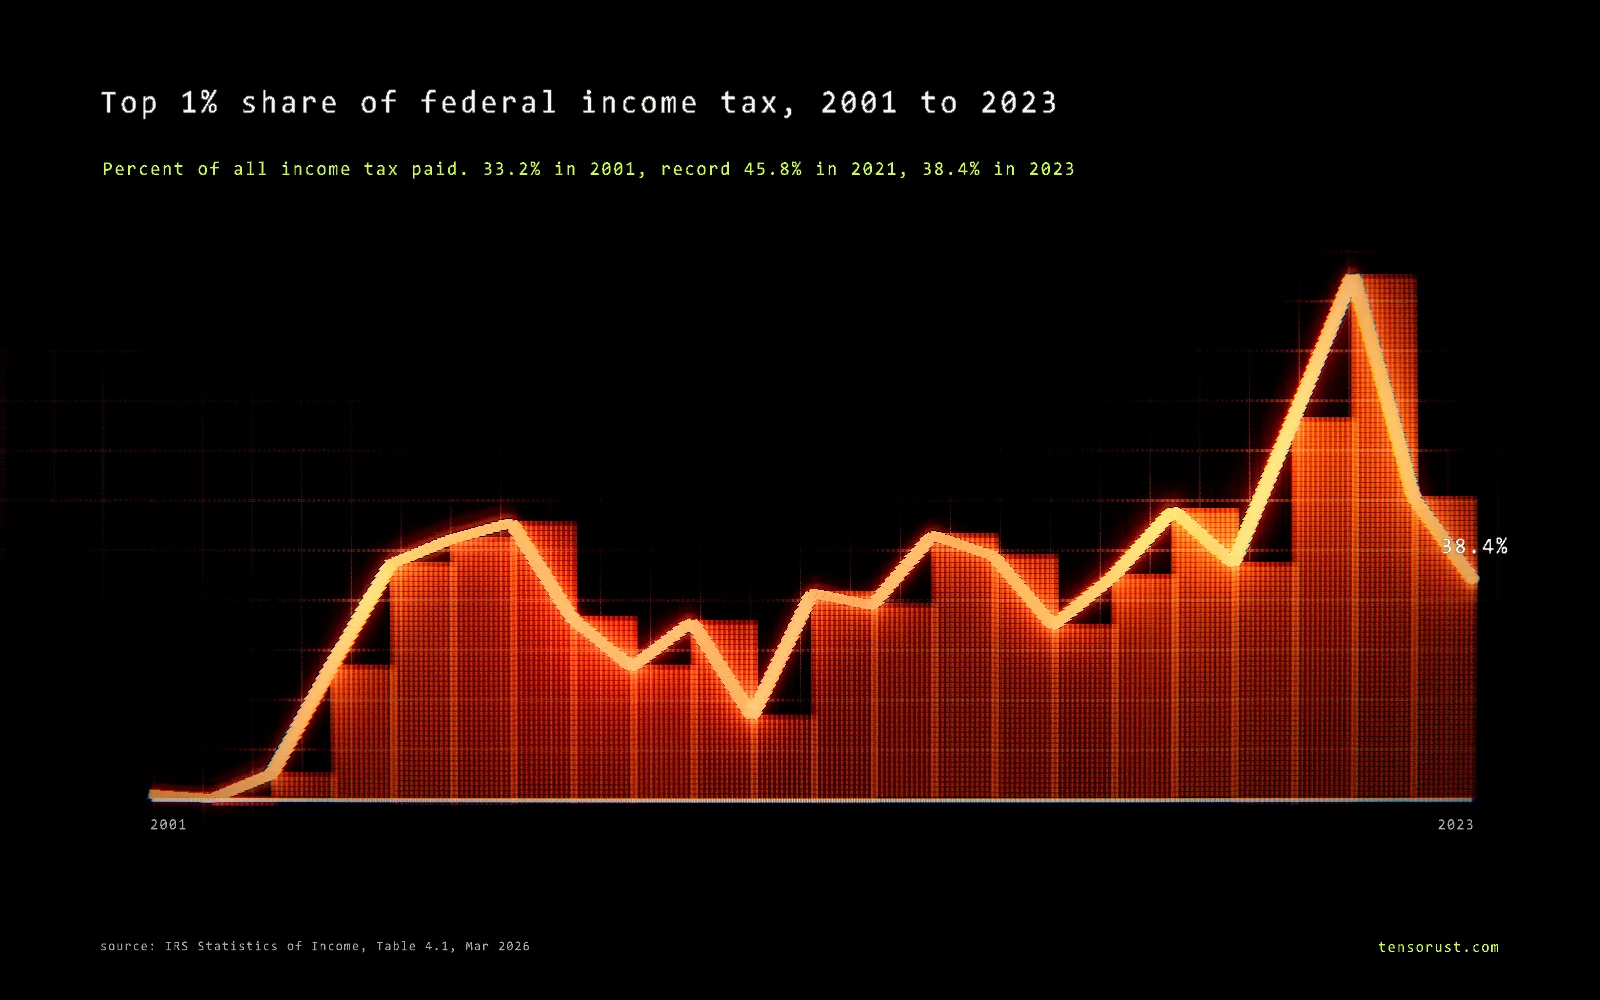
| Top 1% share, 2001 vs record | 33.2% in 2001; record 45.8% in 2021 | same, 2001 to 2023 series |
| Average income tax rate, top 1% vs bottom 50% | 26.3% vs 3.7% of AGI | same |
| Top 1% share of ALL federal taxes | 27.3% on 17.8% of income (2022) | Tax Foundation, Apr 16 2026, from CBO |
Download the data (CSV): every IRS percentile group, 2001 to 2023, with returns, income floor, income, tax, average rate and shares.
Where do you rank?
Type your adjusted gross income (line 11 of Form 1040) to see which 2023 group you would fall in and what that group paid. Nothing leaves your browser.
Your group, its average rate and its share of all income tax show up here.
Groups are cumulative: "top 10%" includes the top 1%. Thresholds are 2023 dollars; incomes have grown since, so a 2026 income ranks a little lower than this says.
The breakdown, by the numbers
The IRS Statistics of Income division ranks every individual return (excluding dependents) by adjusted gross income (AGI) and publishes how much income and tax each slice reported. Splitting its tax year 2023 table into non-overlapping groups:
| Group | Returns | Income starts at | Income tax paid | Share of all income tax | Share of income |
|---|---|---|---|---|---|
| Top 1% | 1.53M | $675,602 | $823.4B | 38.4% | 20.6% |
| Next 9% (top 1% to 10%) | 13.8M | $187,608 | $689.3B | 32.1% | 27.0% |
| Next 40% (top 10% to 50%) | 61.2M | $53,801 | $561.8B | 26.2% | 40.1% |
| Bottom 50% | 76.5M | $0 | $69.9B | 3.3% | 12.3% |
Our subtraction of the IRS cumulative rows; shares may not sum to 100 due to rounding.
Two things drive the top-heavy result. First, income itself is concentrated: the top 1% reported $3.13 trillion of the $15.2 trillion total. Second, the rate schedule is progressive: the standard deduction ($13,850 single, $27,700 married filing jointly for 2023) and refundable credits wipe out tax at the bottom, and brackets rise to 37% at the top.
Why the share swings so much
The top 1%'s share of income tax tracks the stock market more than tax law. It hit 39.8% in 2007, fell to 35.1% by 2011 after the crash, and set a record 45.8% in 2021, when the top 1%'s share of income also peaked at 26.3%. In 2022 and 2023, as markets cooled, both fell back (to 38.4% of tax and 20.6% of income). Capital gains are realized when people choose to sell, so a strong market year inflates the top's income, and its tax bill, all at once.
Do the richest pay the highest rate?
Not quite. Average income tax rates rise steadily up the ladder and then dip at the very top:
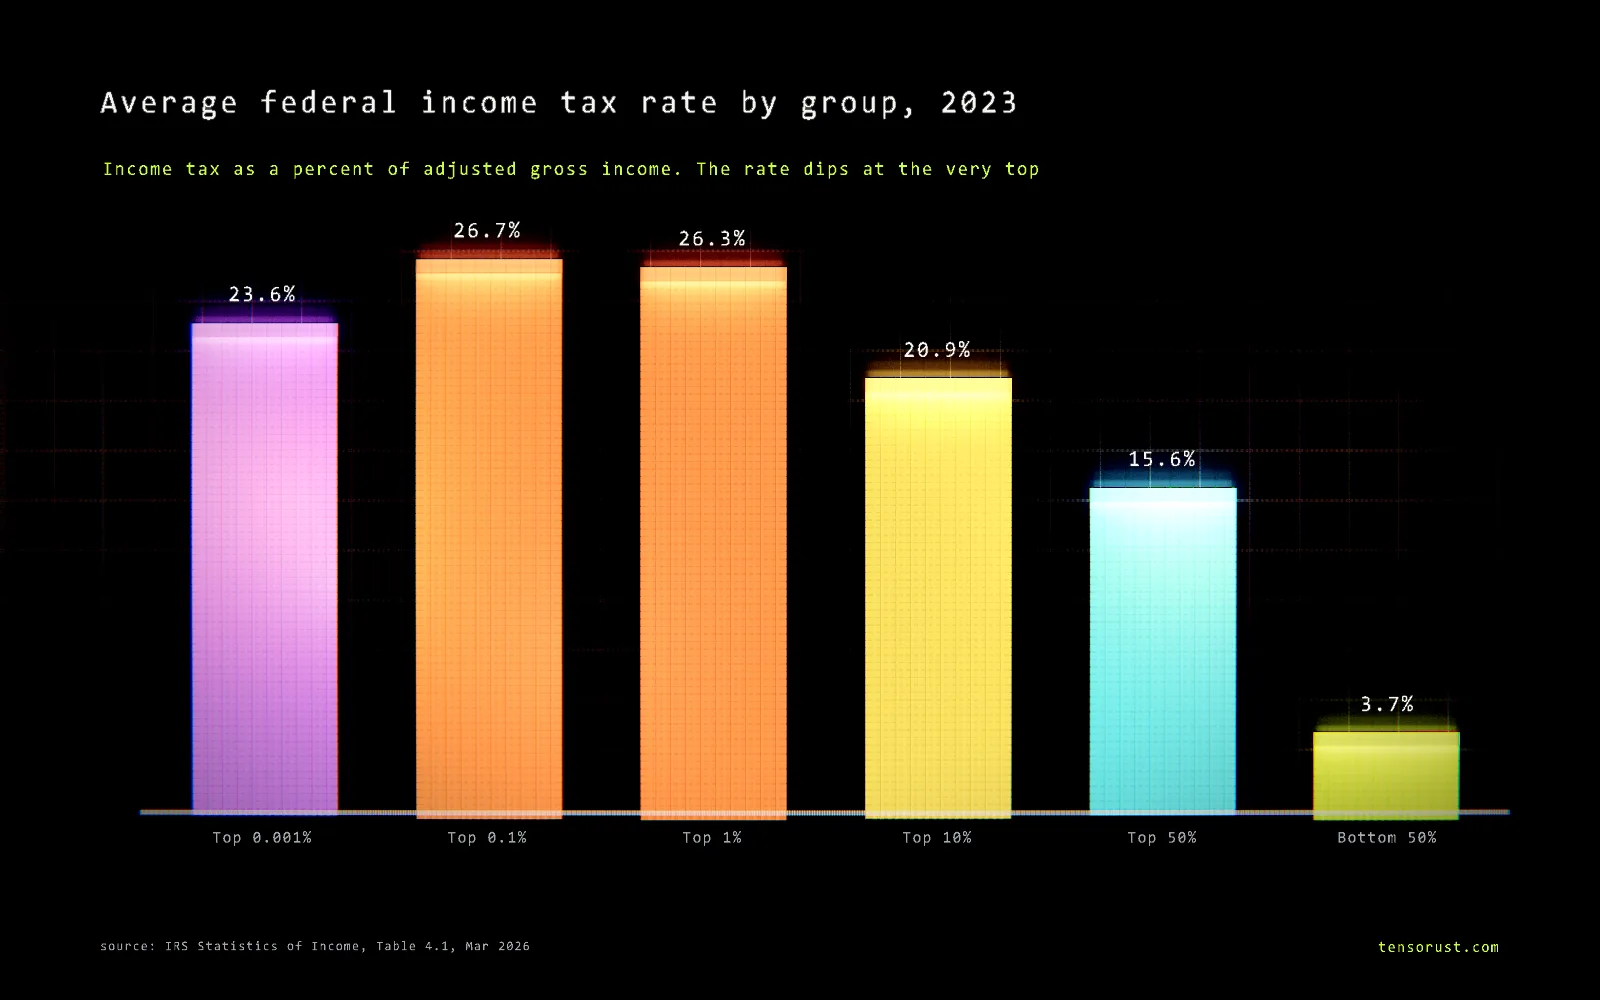
The reason is the mix of income. Wages face brackets up to 37%. Long-term capital gains and qualified dividends top out at 20%, plus the 3.8% net investment income tax, so a return made mostly of investment income pays a lower average rate than a surgeon's or a lawyer's. The richest 1,531 returns still paid an average of about $48.9 million each.
Common misconceptions
"The rich don't pay income tax."
The recordThe record: in 2023 the top 1% paid $823.4 billion, 26.3% of their reported income. What is true: tax is only due on income people realize. Gains on stock never sold are not income on a tax return, so a billionaire's yearly rise in wealth can be mostly untaxed. A 2021 White House study by Greg Leiserson and Danny Yagan estimated an 8.2% income tax rate for the 400 wealthiest families over 2010 to 2018 when unrealized gains count as income (6% to 12% across their checks). Both numbers are right; they divide by different things.
"The top 1% pays almost all federal taxes."
The recordThe record: 38.4% of income tax, but income tax is only about half of federal revenue. Payroll taxes stop at a wage cap and hit the first dollar of wages, so counting everything, the CBO found the top 1% paid 27.3% of all federal taxes in 2022, per the Tax Foundation's summary. Still more than their 17.8% share of income.
"The bottom half pays nothing."
The recordThe record: they paid $69.9 billion of federal income tax in 2023 and far more in payroll taxes, which our bottom 50% explainer breaks down.
Related
- What percent of federal income tax does the bottom 50% pay?
- Prop 40 explained: California's one-time billionaire tax
- How much interest does the US pay on its debt per day?
- Who owns the US national debt?
- Article: our Prop 40 deep dive, with every California billionaire priced
FAQ
Who pays the most federal income tax?
The top 1% of earners. In tax year 2023 the 1.53 million returns with adjusted gross income above $675,602 paid $823.4 billion, 38.4% of all federal income tax, while reporting 20.6% of all income, per IRS Statistics of Income data published in March 2026.
What percentage of federal income tax do the top 10% pay?
70.5% in tax year 2023. Returns with adjusted gross income above $187,608 paid $1.51 trillion of the $2.14 trillion total, on 47.6% of the income.
Do the richest Americans pay a lower tax rate?
On income tax, the very top pays slightly less than the merely rich. In 2023 the top 0.1% paid an average 26.7% of adjusted gross income, the top 1% 26.3%, but the top 0.001% (1,531 returns) paid 23.6%, because more of their income is long-term capital gains and dividends taxed at lower rates. Counting unrealized gains, a 2021 White House study estimated 8.2% for the 400 wealthiest families over 2010 to 2018.
How much income do you need to be in the top 1%?
$675,602 of adjusted gross income in tax year 2023, per the IRS. The top 10% started at $187,608 and the top half at $53,801.
Does the top 1% pay most of all federal taxes?
No. The 38.4% figure is income tax only. Counting payroll, excise and corporate taxes, the Congressional Budget Office found the top 1% paid 27.3% of all federal taxes in 2022 on 17.8% of income, per the Tax Foundation's summary of CBO data.
Sources
All checked October 24, 2026.
Primary
- Internal Revenue Service, Statistics of Income Division, Individual Statistical Tables by Tax Rate and Income Percentile, Table 4.1, tax years 2001 to 2023 (Publication 1304, March 2026): returns, AGI floors, AGI, total income tax, average tax rates and shares for every percentile group.
- Congressional Budget Office, The Distribution of Household Income, 2022 (January 2026): shares of all federal taxes and average federal tax rates.
- IRS, IRS provides tax inflation adjustments for tax year 2023: standard deduction and bracket thresholds.
Analysis and credit
- Garrett Watson and Emily Kraschel, Tax Foundation, summary of CBO's 2022 household income data (April 16, 2026): top 1% paid 27.3% of all federal taxes on 17.8% of income.
- Tax Foundation, Who pays federal income taxes, tax year 2023: the same IRS table, summarized.
- Greg Leiserson and Danny Yagan, White House Council of Economic Advisers and OMB, What Is the Average Federal Individual Income Tax Rate on the Wealthiest Americans? (September 23, 2021): 8.2% for the 400 wealthiest families, 2010 to 2018, counting unrealized gains.
Our data
- data.csv: IRS Table 4.1 reshaped to one row per year and group, plus a bottom 50% row we computed as total minus top 50%. The non-overlapping groups (next 9%, next 40%) and the $48.9 million per-return figure ($74.86B / 1,531) are our math.
Images
- All three charts rendered by Tensorust with the Proof Engine from IRS data.
Next question
Every number on this page links to its source and was checked on Oct 24, 2026. Spot an error or a newer figure? Email matt@tensorust.com and it gets fixed.
Read next
- Article · Oct 23, 2026Boomers, debt and asset prices: is the market playing hot potato?
- Article · Oct 23, 2026Prop 40 priced: 223 billionaires, $90B on paper, Zuckerberg $11B
- Explainer · Oct 24, 2026What are bank reserves?
- Explainer · Oct 24, 2026The Fed balance sheet over time, explained
Get the next one by email.
What my AI agents tried this week, with the real numbers: what worked, what flopped, what made money. One email when there is something worth reading.
No spam, never sold. Every email has a one-click unsubscribe.