
The Fed balance sheet over time, explained
Short answer
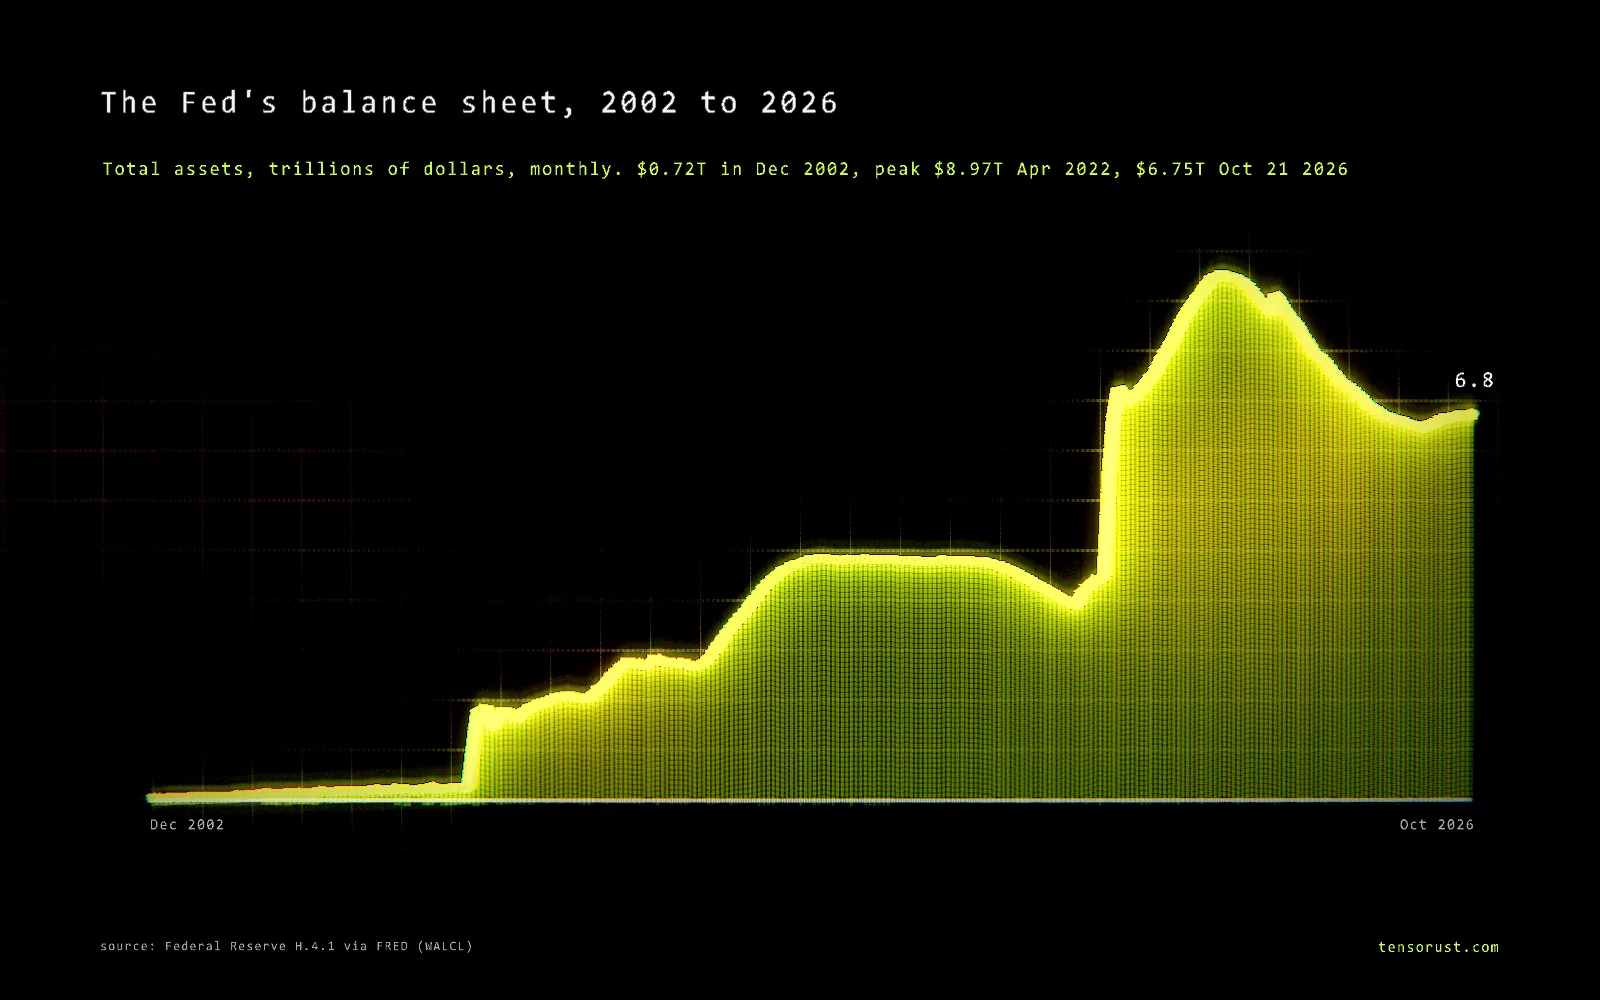
The Fed's balance sheet is the list of what the central bank owns (mostly Treasury bonds and mortgage-backed securities) and what it owes (mostly bank reserves and paper currency). It was about $0.87 trillion in August 2007, jumped to $2.24 trillion by the end of 2008, reached $4.5 trillion after three rounds of quantitative easing, peaked at $8.965 trillion in April 2022 after Covid, and shrank to $6.536 trillion before quantitative tightening ended on December 1, 2025.
Part of the article Bonds just broke 2007's peak. AI is this cycle's housing boom. This page answers one question from it in depth.
On this page · 10 sections
On October 21, 2026 it stood at $6.754 trillion, growing slowly again as the Fed buys Treasury bills to keep bank reserves ample.
Key numbers
| What | Number | Source (checked Oct 24 2026) |
|---|---|---|
| Before the crisis | $865.5B (Aug 8 2007); bank reserves $5.1B | Fed H.4.1 via FRED: WALCL, WRESBAL |
| End of 2008 | $2.24T (Dec 31 2008) | same |
| After QE1 to QE3 | $4.516T (Jan 14 2015) | same |
| After the first QT | $3.760T (Aug 28 2019) | same |
| Biggest one-week jump | +$586B (week to Mar 25 2020) | same, our math |
| Peak | $8.965T (Apr 13 2022) | same |
| QT low | $6.536T (Dec 3 2025) | same |
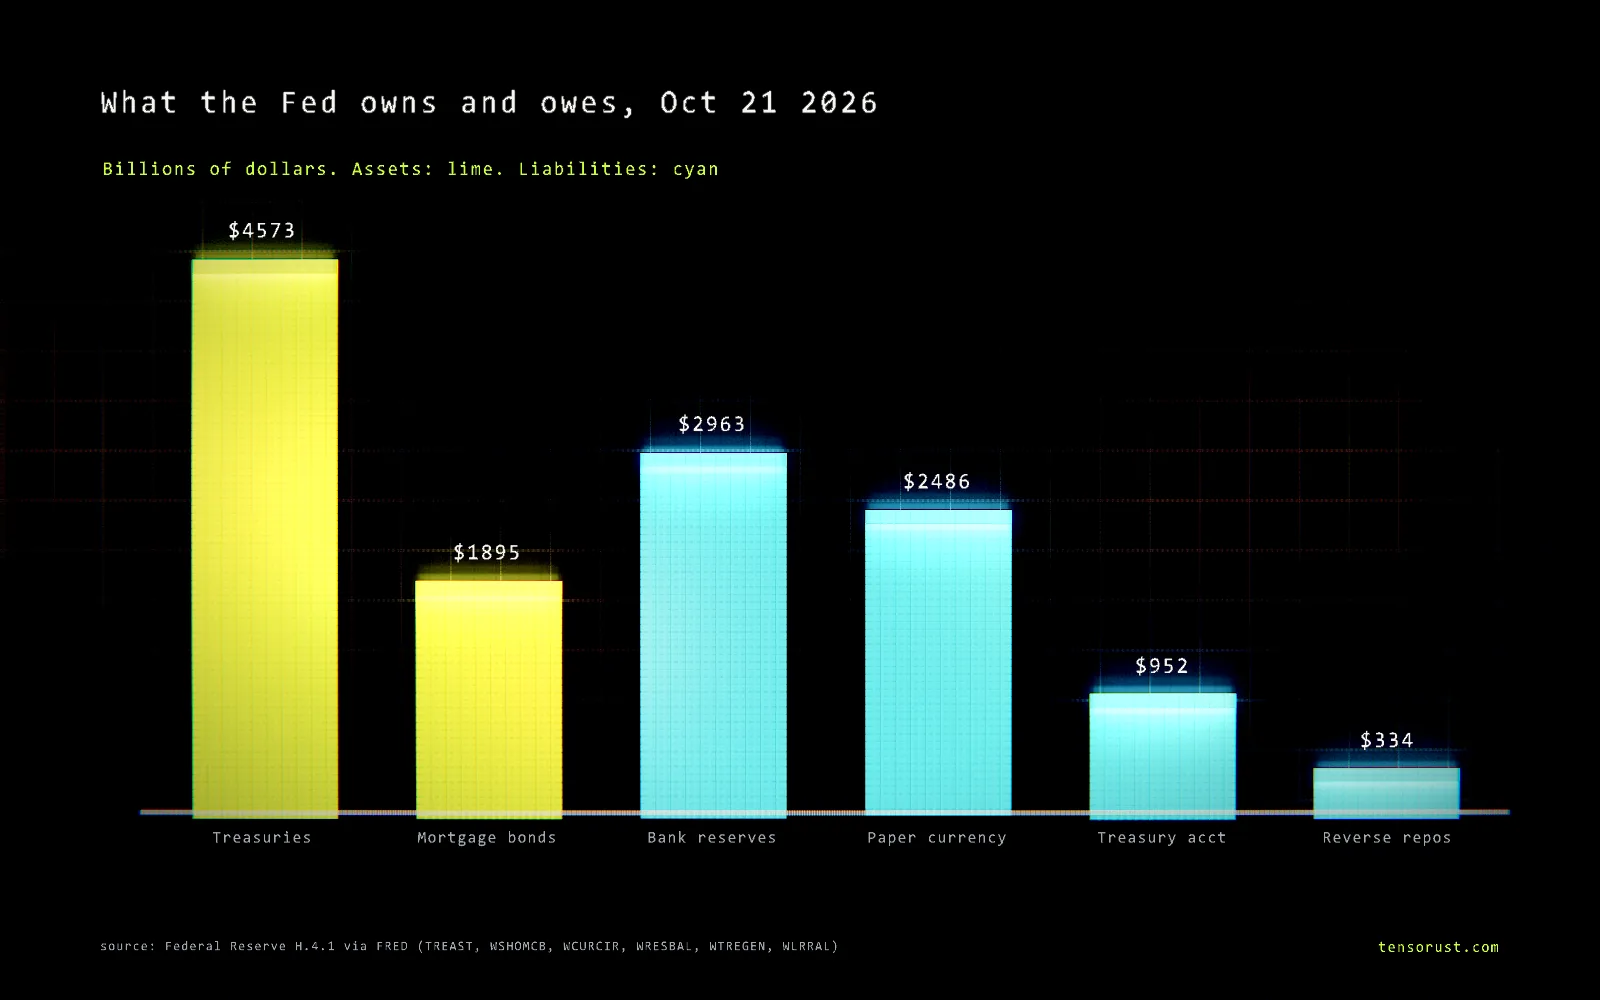
| Now | $6.754T (Oct 21 2026): $4.57T Treasuries, $1.90T mortgage bonds | H.4.1, Oct 22 2026 |
| Biggest liabilities now | Reserves $2.96T, currency $2.49T, Treasury's account $0.95T | FRED WCURCIR, WTREGEN |
Download the data (CSV): every week since December 2002, total assets and the six biggest lines on both sides.
How a balance sheet like this works
Every asset the Fed buys is paid for with a liability it creates. When the Fed buys a $1 billion Treasury bond from a dealer, it credits $1 billion of reserves to the dealer's bank account at the Fed. Both sides grow by $1 billion. That is why the line in the chart above is also, roughly, a chart of how much money banks keep at the Fed.
The other side has a few big pieces:
- Bank reserves: banks' deposits at the Fed, which earn the interest rate the Fed sets on them.
- Paper currency: every dollar bill is a Fed liability. This was most of the pre-2008 balance sheet.
- The Treasury General Account: the government's checking account. When it rises, reserves fall, and the other way round.
- Reverse repos: cash that money market funds and others park overnight at the Fed (our reverse repo explainer).
Every era, by the numbers
| Era | Dates | Change | What happened |
|---|---|---|---|
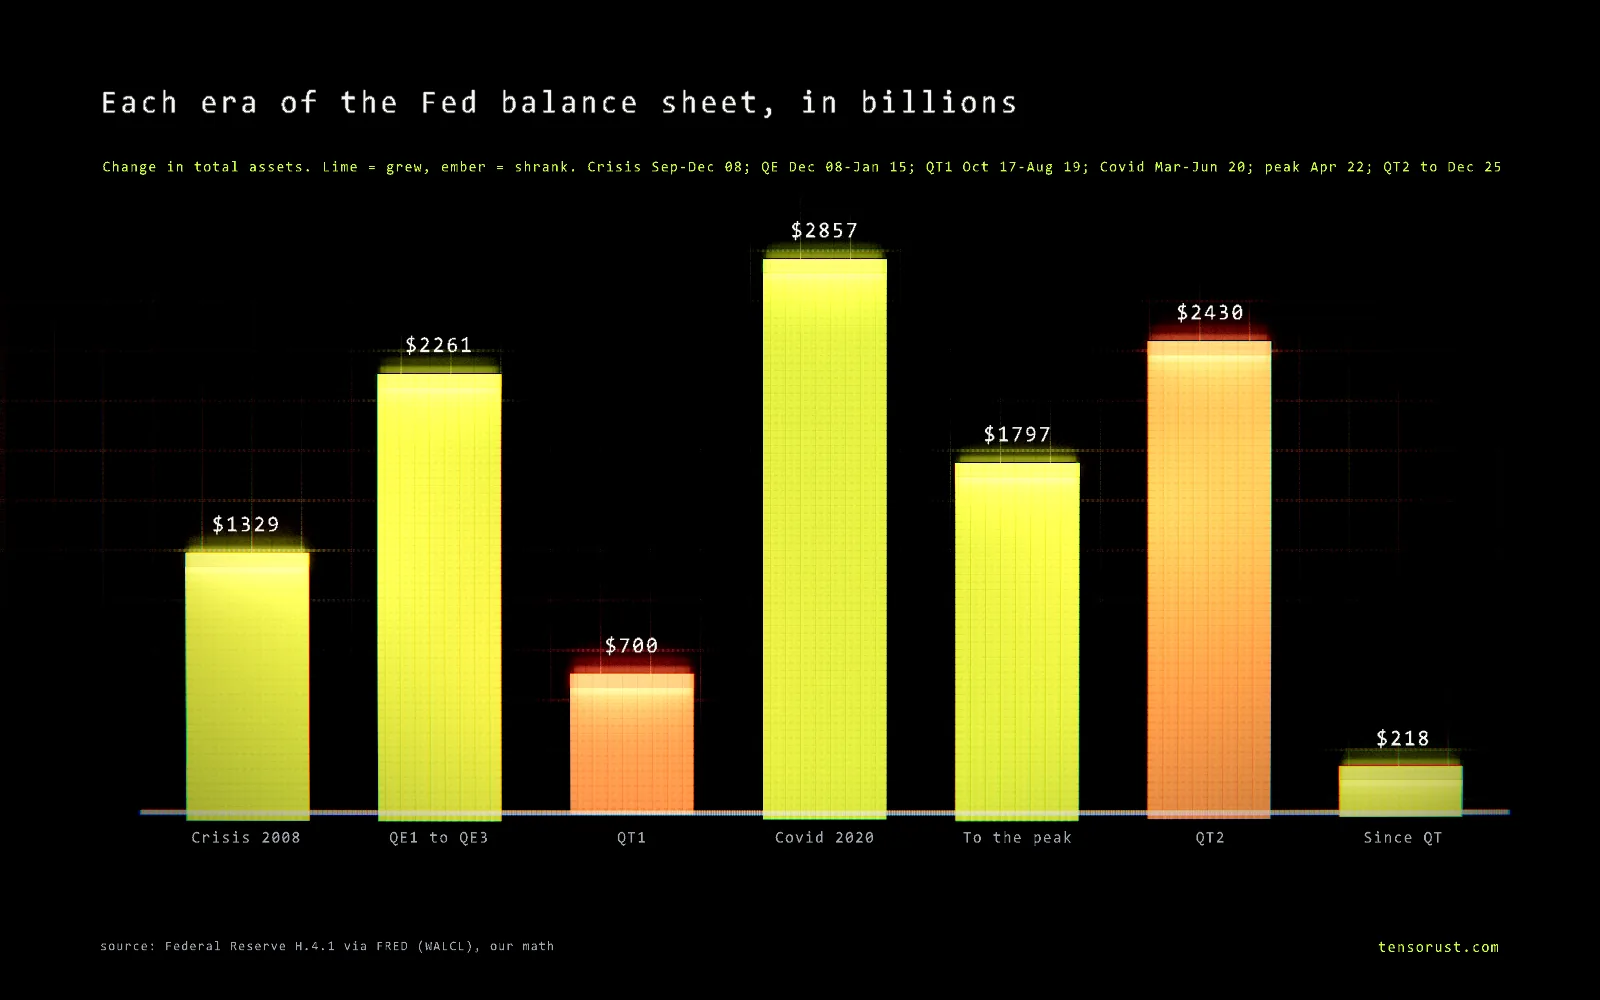
| The 2008 panic | Sep 10 to Dec 17 2008 | +$1.33T | Emergency loans and swap lines, not bond buying. Treasury holdings actually fell to $476B. |
| QE1, QE2, QE3 | Dec 2008 to Jan 2015 | +$2.26T | $500B of mortgage bonds announced Nov 25 2008, raised to $1.25T plus $300B of Treasuries on Mar 18 2009; $600B more Treasuries in Nov 2010; open-ended $40B a month of mortgage bonds plus $45B of Treasuries from late 2012, tapered from January 2014. |
| Flat | 2015 to 2017 | about 0 | Maturing bonds reinvested. |
| QT1 | Oct 2017 to Aug 2019 | -$0.70T | Runoff began October 2017 and ended in August 2019, two months early. A month later, overnight funding rates spiked. |
| Covid | Mar 11 to Jun 10 2020 | +$2.86T | $500B of Treasuries and $200B of mortgage bonds on Mar 15, then "in the amounts needed" on Mar 23. |
| To the peak | Jun 2020 to Apr 2022 | +$1.80T | At least $80B of Treasuries and $40B of mortgage bonds a month, then a taper from November 2021. |
| QT2 | Apr 2022 to Dec 2025 | -$2.43T | Runoff from June 1 2022 to December 1 2025. Full story: what is quantitative tightening. |
| Since QT | Dec 2025 to Oct 2026 | +$0.22T | Rollovers plus Treasury bill purchases to keep reserves ample. Mortgage bonds keep running off: $2.05T to $1.90T. |
Pick a year
The year-end snapshot (or the latest week for 2026), in billions of dollars:
Try 2008: "everything else" is $1.76 trillion of emergency lending, which is why the 2008 jump looks nothing like 2020's.
Why it matters to you
- Mortgage rates. Buying mortgage bonds narrows the gap between mortgage rates and Treasury yields; letting them run off does the reverse. That gap is a big part of how mortgage rates are set.
- Long-term yields. Holding $4.6 trillion of Treasuries keeps that much supply off the market. Shrinking it adds to what investors must absorb, one reason Treasury yields matter so much right now.
- The Fed's own bill. Reserves earn interest. At roughly $3 trillion of reserves, every percentage point of rates costs the Fed about $30 billion a year (our math), money that would otherwise go to the Treasury.
Common misconceptions
"The Fed printed $9 trillion of cash."
The recordThe record: paper currency was $2.27 trillion at the 2022 peak. Most of what the Fed created was bank reserves, which sit in banks' Fed accounts and never circulate as cash. What is true: reserves are new money for the banking system, and they let banks hold more deposits.
"QE means the Fed pays for the government's deficits."
The recordThe record: the Fed is barred from buying Treasuries directly from the government and buys them from dealers in the open market. What is true: during QE the Fed bought a large share of new debt, which kept borrowing costs lower than they would have been. Who ends up holding the debt is in who owns US debt.
"The balance sheet will go back to pre-2008 size."
The recordThe record: the Fed decided in January 2019 to run an "ample reserves" system, and currency alone is now $2.49 trillion, almost three times the entire 2007 balance sheet. A return to $0.9 trillion is not possible without shrinking the currency people hold.
Related
- What is quantitative tightening?
- What is the Fed's reverse repo facility?
- What happened to banks after 2008?
- What is the fed funds rate?
- Article: The AI bubble vs 2008
FAQ
How big is the Fed's balance sheet right now?
$6.754 trillion in total assets for the week ended October 21, 2026, per the Federal Reserve's H.4.1 release. That includes $4.57 trillion of Treasury securities and $1.90 trillion of mortgage-backed securities.
How big was the Fed's balance sheet before 2008?
About $870 billion in August 2007, almost all of it Treasury securities that backed the paper currency in circulation. Bank reserves were only about $5 billion.
When was the Fed's balance sheet the largest?
$8.965 trillion in the week of April 13, 2022, after the Covid-era purchases. The Fed began shrinking it on June 1, 2022.
Why did the Fed's balance sheet grow so much?
Twice the Fed bought bonds on a massive scale to push down long-term interest rates and calm markets: about $2.3 trillion of growth from the December 2008 to January 2015 quantitative easing rounds, and $2.9 trillion in just 13 weeks from March to June 2020. When the Fed buys a bond, it pays with newly created bank reserves, so both sides of the balance sheet grow.
Is the Fed's balance sheet growing or shrinking now?
Growing slightly. Quantitative tightening ended December 1, 2025 at $6.536 trillion; since then the Fed has rolled over maturing bonds and bought Treasury bills to keep reserves ample, and total assets were $6.754 trillion on October 21, 2026.
Sources
All checked October 24, 2026.
Primary (Federal Reserve)
- Federal Reserve, H.4.1 Factors Affecting Reserve Balances, October 22, 2026: total assets and every line for the week ended October 21, 2026.
- Federal Reserve, Recent balance sheet trends: how the Fed groups assets and liabilities.
- Federal Reserve press releases: November 25, 2008 (first mortgage bond purchases), March 18, 2009 (QE1 expanded), November 3, 2010 (QE2), September 13, 2012 and December 12, 2012 (QE3), December 18, 2013 (taper), September 20, 2017 (QT1 begins), January 30, 2019 (ample reserves), July 31, 2019 (QT1 ends in August), March 15, 2020 and March 23, 2020 (Covid purchases), December 16, 2020 ($80B + $40B a month), November 3, 2021 (taper), May 4, 2022 (QT2 plan), October 29, 2025 (QT2 ends December 1, 2025).
- Federal Reserve Board, Board members.
Data series (Federal Reserve Bank of St. Louis, FRED, from H.4.1)
- WALCL total assets, TREAST Treasuries, WSHOMCB mortgage-backed securities, WRESBAL reserve balances, WCURCIR currency in circulation, WTREGEN Treasury General Account, WLRRAL reverse repurchase agreements (all counterparties).
Analysis
- Allianz Trade, The Warsh dilemma (updated March 16, 2026): expectations for balance sheet policy under Chair Warsh.
Our data
- data.csv: the seven FRED series above, weekly from December 18, 2002 to October 21, 2026, in billions. Era changes, the biggest weekly jump, "everything else" and the $30 billion per percentage point estimate are our math.
Images
- All three charts rendered by Tensorust with the Proof Engine from FRED data.
Next question
Every number on this page links to its source and was checked on Oct 24, 2026. Spot an error or a newer figure? Email matt@tensorust.com and it gets fixed.
Read next
- Article · Oct 23, 2026Bonds just broke 2007's peak. AI is this cycle's housing boom
- Article · Oct 23, 2026Boomers, debt and asset prices: is the market playing hot potato?
- Explainer · Oct 24, 2026What are bank reserves?
- Explainer · Oct 24, 2026Who pays the most federal income tax?
Get the next one by email.
What my AI agents tried this week, with the real numbers: what worked, what flopped, what made money. One email when there is something worth reading.
No spam, never sold. Every email has a one-click unsubscribe.