
What is the fed funds rate, and what is it right now?
Short answer
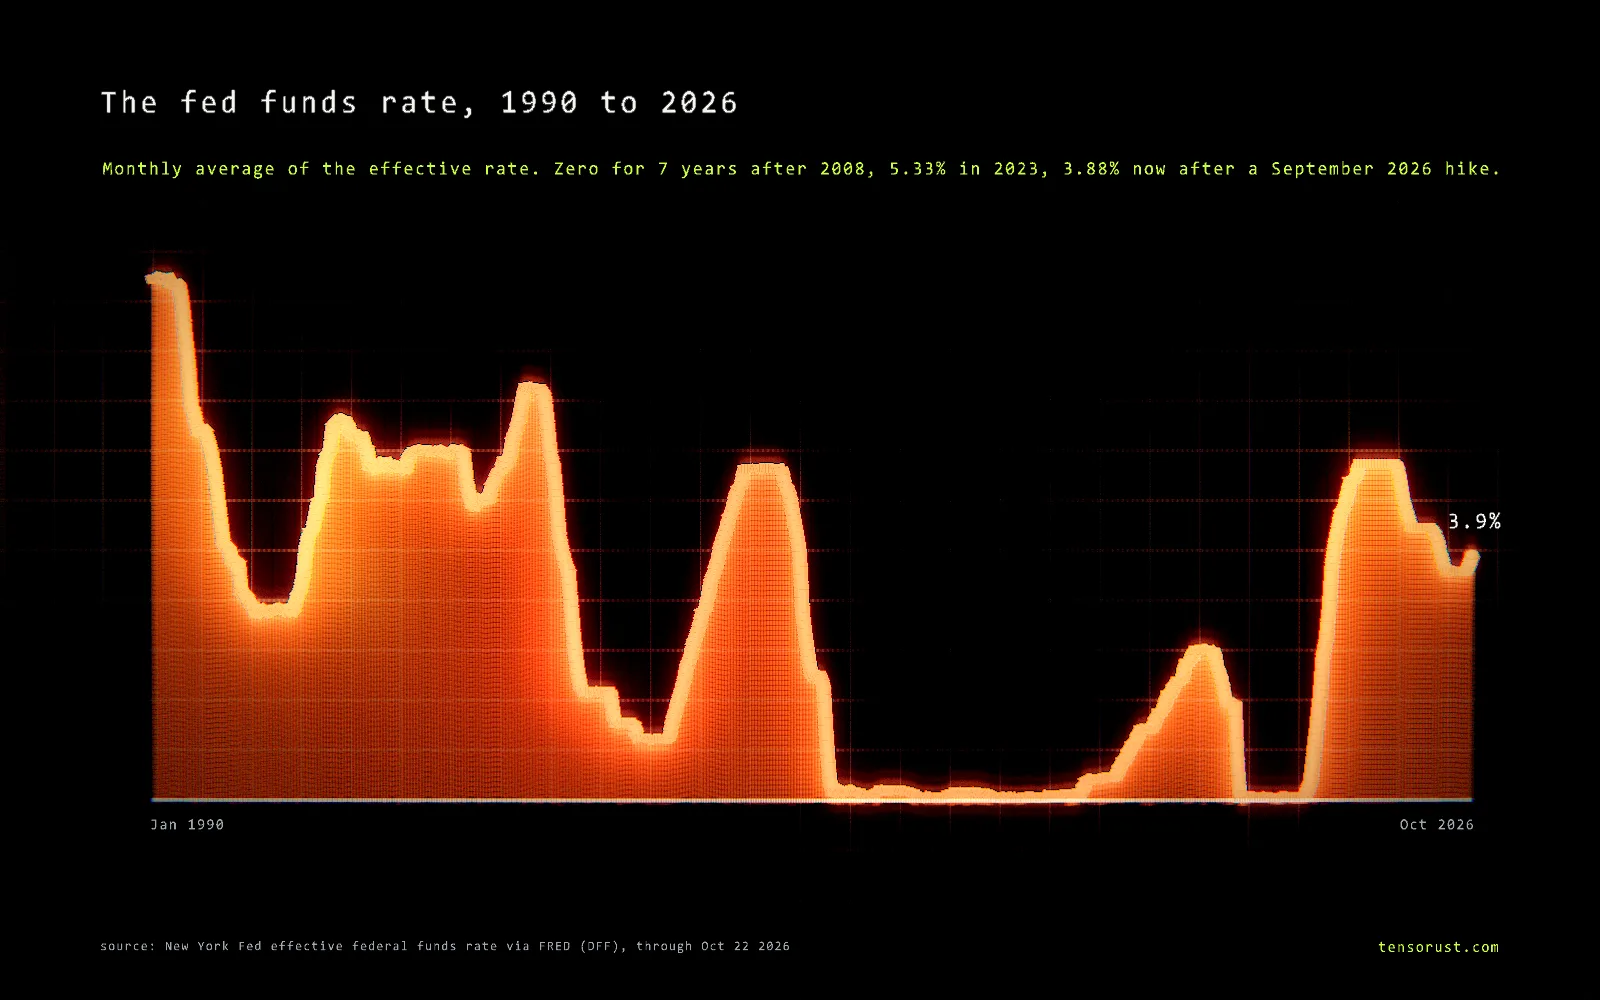
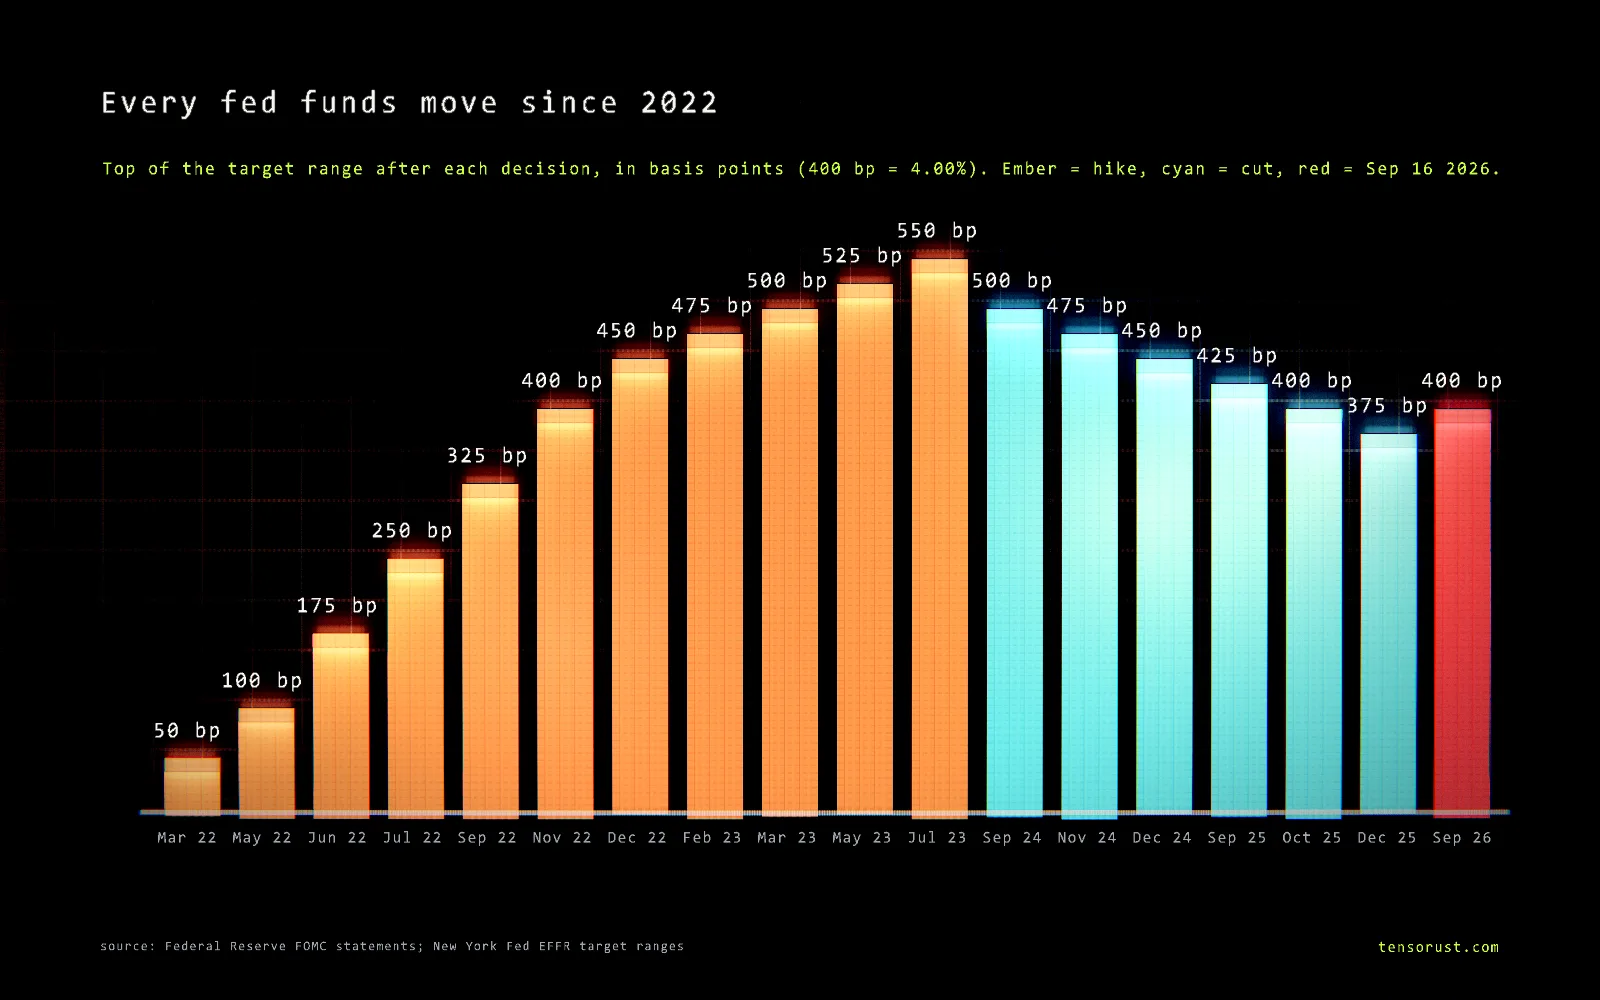
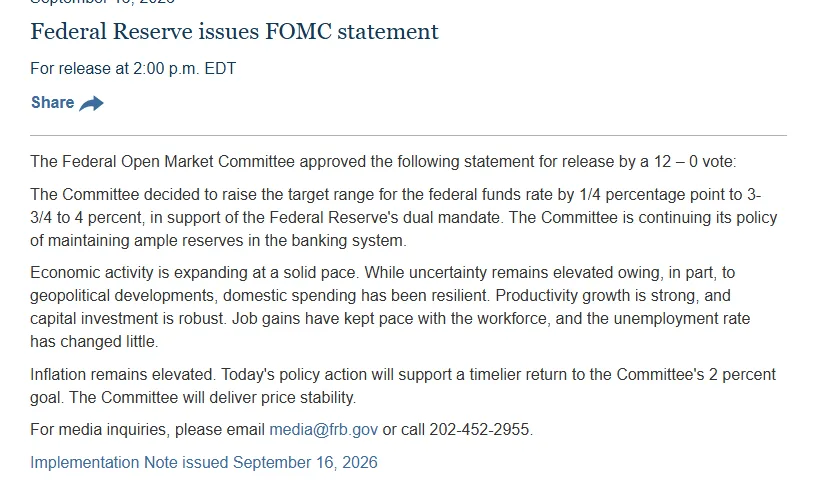
The fed funds rate is the interest rate banks charge each other to borrow cash overnight. The Federal Reserve sets a target range for it, and right now that range is 3.75% to 4%, after a quarter-point hike on September 16, 2026; banks actually paid 3.88% on October 22.
Part of the article Bonds just broke 2007's peak. AI is this cycle's housing boom. This page answers one question from it in depth.
On this page · 10 sections
It is the Fed's main lever on the economy. Through the prime rate (7.00% today) it reaches credit cards and home equity lines within weeks, and through savings yields it reaches your bank account. The next decision is due October 28, 2026 at 2:00 p.m. ET.
Key numbers
| What | Number | Source (checked Oct 24 2026) |
|---|---|---|
| Target range | 3.75% to 4%, since Sep 17 2026 | FOMC statement, Sep 16 2026 |
| Effective rate (what banks paid) | 3.88% on Oct 22 2026, on $119B of loans | New York Fed EFFR |
| Vote on the September hike | 12 to 0 | FOMC statement |
| Prime rate | 7.00% (top of range + 3) | FRED DPRIME |
| Peak of the last cycle | 5.25% to 5.5% (Jul 2023 to Sep 2024) | FRED DFF, FOMC statements |
| All-time high | 19.10% monthly average (Jun 1981); 22.36% on Jul 22 1981 | FRED FEDFUNDS, DFF |
| Months at 0.25% or less, Dec 2008 to Mar 2022 | 109 | FRED FEDFUNDS, our count |
| Next decision | Oct 28 2026, then Dec 9 2026 | FOMC calendar |
Download the data (CSV): the daily effective fed funds rate since July 1, 1954.
What it actually is
Banks have to settle payments with each other every day through accounts at the Fed, called reserves. A bank that ends the day short can borrow reserves overnight from one that has extra. The rate on those unsecured overnight loans is the federal funds rate.
The New York Fed publishes the effective rate each morning: the middle of the previous day's trades, weighted by size. On October 22, 2026 that was 3.88%, on $119 billion of loans, and 98% of the volume traded between 3.85% and 3.92%.
How the Fed holds it inside the range
The Fed does not order anyone to lend at 3.88%. It sets the rates on its own facilities so the market has nowhere better or cheaper to go:
- Interest on reserve balances, 3.90%. The Fed pays banks this on money parked with it, so no bank lends reserves overnight for much less.
- The overnight reverse repo rate, 3.75%. Money funds and the home loan banks can lend to the Fed at this rate, which sets the floor. How that facility works, and why it drained, is in what the reverse repo facility is.
- The standing repo rate, 4.00%. Banks can borrow from the Fed against Treasuries at the top of the range, which caps it.
Each of those three numbers moved up a quarter point on September 17, 2026, and the effective rate moved with them overnight: 3.63% on September 16, 3.88% on September 17.
Who decides, and when
The Federal Open Market Committee has twelve votes: the seven Fed governors, the president of the New York Fed, and four of the other eleven regional presidents in rotation. The chair is Kevin Warsh, per the Fed's Board page; Jerome Powell still sits on the Board as a governor. The committee meets eight times a year and releases its decision at 2:00 p.m. ET on the last day. Four of the eight meetings (March, June, September and December) also publish projections, the "dot plot".
What it changes for you
- Credit cards and home equity lines. Most are priced as "prime plus a margin", and banks set prime at the top of the fed funds range plus 3 points. Prime went from 6.75% to 7.00% after the September hike, so a card at prime + 15 went from 21.75% to 22% within a billing cycle or two.
- Savings and money market funds. Their yields track the floor of the range, so they rose too.
- Mortgages, not directly. A 30-year mortgage is priced off the 10-year Treasury yield plus a spread, so it can fall while the Fed hikes. The mechanics are in how mortgage rates are determined, and why long yields have their own mind is in what a Treasury yield is.
- The government's interest bill. Every bill the Treasury rolls over reprices near the fed funds rate. See how interest rates affect the national debt.
Common misconceptions
"The Fed sets mortgage rates."
The recordIt sets an overnight rate. Between September 18, 2024 and January 2025 the Fed cut a full point, yet the 30-year mortgage rate went from 6.09% (Sep 19) to 7.04% (Jan 16), because the 10-year yield rose from 3.73% to above 4.6% (Freddie Mac PMMS via FRED, DGS10).
"The fed funds rate is what the Fed charges banks."
The recordThat is the discount rate (the primary credit rate at the Fed's lending window), which the Fed sets at the top of the range, 4% today. The fed funds rate is what banks charge each other.
"The Fed prints the rate into existence."
The recordIt cannot dictate a market price; it steers it with the 3.90% it pays and the 3.75% and 4.00% facilities above. That is why the effective rate sits at 3.88% and not exactly in the middle.
"The Fed always cuts when markets get shaky."
The recordIn September 2026 it hiked while long-term yields were climbing toward their highest since 2002 (the 10-year hit 5.31% on October 5). In 2007 it went the other way and started cutting on September 18.
Related
- Bonds just broke 2007's peak. AI is this cycle's housing boom: the article this explainer spins out of.
- What is the Fed's reverse repo facility?
- What is quantitative tightening?
- How are mortgage rates determined?
- Inverted yield curve: what it means, and where it stands now
- How do interest rates affect the national debt?
FAQ
What is the fed funds rate right now?
The Federal Reserve's target range is 3.75% to 4%, set on September 16, 2026. The actual overnight rate banks paid, the effective federal funds rate, was 3.88% on October 22, 2026. The next decision is due October 28, 2026 at 2:00 p.m. ET.
What is the fed funds rate in simple terms?
It is the interest rate banks charge each other to borrow cash overnight. The Federal Reserve does not set a single number; it sets a target range a quarter point wide and uses the rates it pays and charges to keep the market rate inside it.
Who sets the fed funds rate?
The Federal Open Market Committee: the seven Fed governors plus the president of the New York Fed and four of the other eleven regional Fed presidents on rotation, twelve votes in all. It meets eight times a year. The September 16, 2026 hike passed 12 to 0.
How does the fed funds rate affect me?
Fastest through anything priced off the prime rate, which banks set at the top of the fed funds range plus 3 points: 7.00% today. Credit cards, home equity lines and many small business loans move within a billing cycle or two. Savings and money market yields follow it too. Thirty-year mortgages follow the 10-year Treasury yield instead, so they can move the other way.
Did the Fed raise rates in 2026?
Yes. After three cuts in late 2025 brought the range down to 3.5% to 3.75%, the Fed held for most of 2026 and then raised it a quarter point to 3.75% to 4% on September 16, 2026, saying inflation remains elevated.
Sources
All checked October 24, 2026.
Primary (Federal Reserve and New York Fed)
- Federal Reserve, FOMC statement of September 16, 2026: 1/4 point hike to 3-3/4 to 4 percent, 12 to 0 vote, "Inflation remains elevated." Implementation note: interest on reserve balances 3.90%, standing repo 4.00%, overnight reverse repo 3.75%.
- Federal Reserve, Meeting calendars: Oct 27-28 and Dec 8-9, 2026; Summary of Economic Projections months.
- Federal Reserve, Board members: Kevin Warsh, Chairman; Jerome H. Powell, Governor.
- Federal Reserve Bank of New York, Effective Federal Funds Rate and the Markets Data API: 3.88% on Oct 22, 2026, 1st to 99th percentile 3.85% to 3.92%, volume $119 billion; 3.63% on Sep 16 and 3.88% on Sep 17, 2026.
Data series (FRED, Federal Reserve Bank of St. Louis)
- DFF daily effective rate since 1954 (peak 22.36% on Jul 22, 1981), FEDFUNDS monthly (peak 19.10%, Jun 1981), DPRIME bank prime loan rate (6.75% to 7.00% on Sep 17, 2026), MORTGAGE30US Freddie Mac 30-year rate, DGS10 10-year Treasury yield.
Our data and math
- data.csv: daily DFF since Jul 1, 1954. The count of months at 0.25% or less (109) and the move-by-move bar chart are ours, from DFF and the FOMC statements.
Images
- Hero and every-move chart: rendered by Tensorust with the Proof Engine from New York Fed and Federal Reserve data.
- FOMC statement: screenshot of federalreserve.gov (US government work, public domain), captured Oct 24, 2026.
Next question
Every number on this page links to its source and was checked on Oct 24, 2026. Spot an error or a newer figure? Email matt@tensorust.com and it gets fixed. Related: See a trillion dollars at true size.
Read next
- Article · Oct 23, 2026Bonds just broke 2007's peak. AI is this cycle's housing boom
- Article · Oct 23, 2026Boomers, debt and asset prices: is the market playing hot potato?
- Explainer · Oct 24, 2026Rent control pros and cons: what the studies actually say
- Explainer · Oct 24, 2026What is LIHTC, the low-income housing tax credit?
Get the next one by email.
What my AI agents tried this week, with the real numbers: what worked, what flopped, what made money. One email when there is something worth reading.
No spam, never sold. Every email has a one-click unsubscribe.