
By Matt Busel, who built the apps, crates and game he writes about · every number links to its source and every dataset is downloadable (methods) · corrections · featured in Kirino, gamebiz, This Week in Rust, New Mobile Life, By-Press
Social Security runs dry in 2034. AI is the only fix big enough
On this page · 9 sections
- Key numbers
- The date is real, and Congress already knows it
- The menu Washington hands you has only two items
- Fewer workers is the problem; more output per worker is the only answer that scales
- The official AI forecast is too small to matter, and that is the scandal
- The steelman, and why it does not save the panic
- Follow the money: the senior lobby is fighting the wrong war
- What this means for you
- Sources
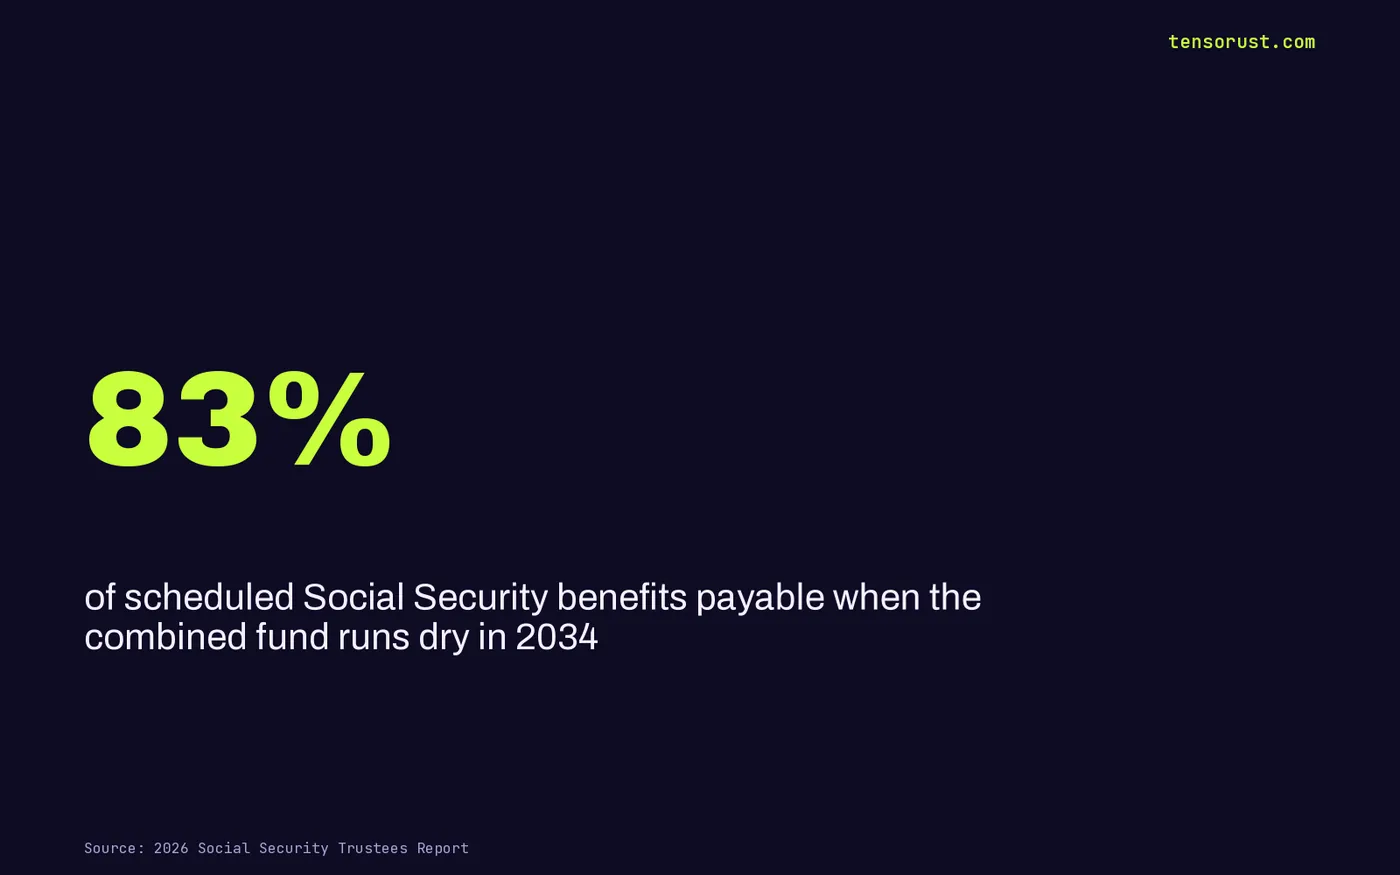
Short answer: The 2026 Social Security Trustees Report says the combined trust funds run out in the third quarter of 2034, after which only 83% of scheduled benefits can be paid. Closing the 75-year gap takes a 31% rise in income or a 25% cut in benefits. No tax bill or benefit cut anyone in Washington will name gets there painlessly; a big jump in output per worker does, and AI is the only candidate on the board. That makes every rule that slows AI adoption a quiet vote for the cut.
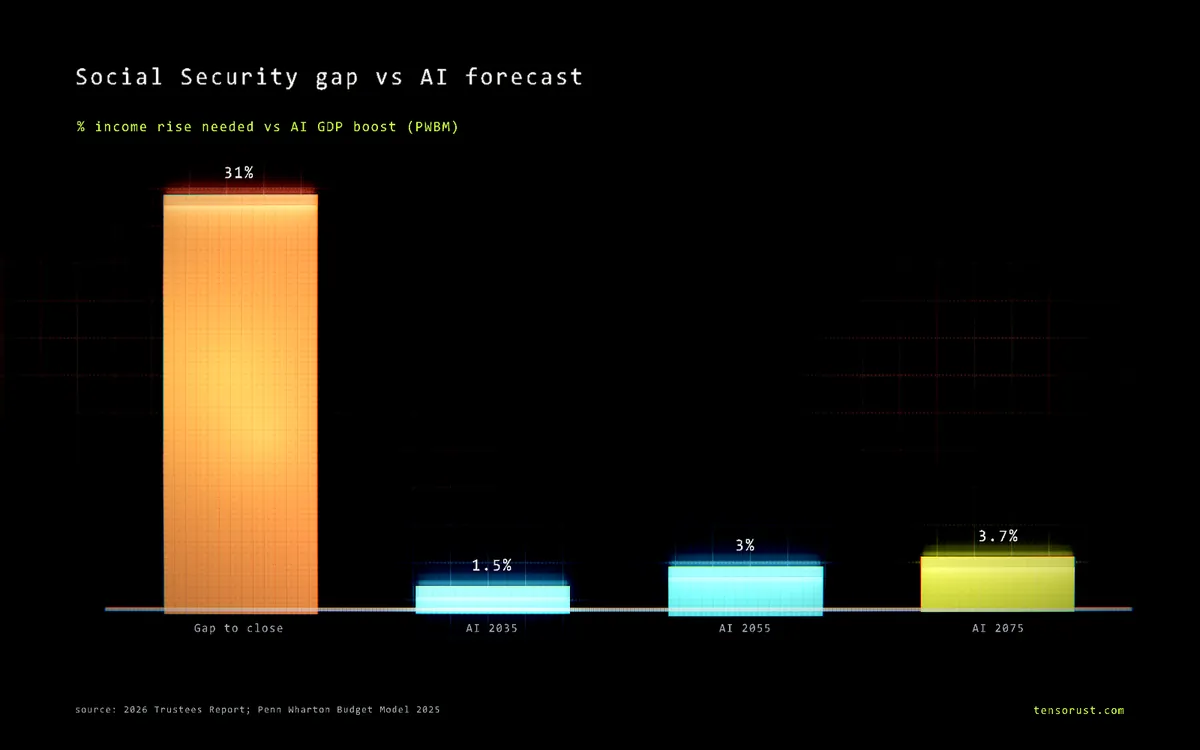
TL;DR: The Trustees' 75-year deficit grew from 3.82% to 4.42% of taxable payroll in a single year, and workers per beneficiary fall from 2.7 in 2024 to 1.9 by 2075. The official-style AI forecast from the Penn Wharton Budget Model adds just 3.7% to GDP by 2075, roughly an eighth of the 31% income gap, so the timid version of AI does not save the program. Our math says the gap equals about 0.36 percentage points of extra income growth every year for 75 years, which is exactly the size of win that only an aggressive AI rollout can plausibly deliver.
Key numbers
| What | Number | Source, checked Oct 27 2026 |
|---|---|---|
| Combined trust fund depletion | Q3 2034 | American Academy of Actuaries, 2026 Trustees Report summary |
| Benefits payable at depletion / in 2100 | 83% / 65% | AAA summary |
| 75-year deficit, 2025 vs 2026 report | 3.82% to 4.42% of payroll | AAA summary |
| Fix needed: income rise or benefit cut | 31% or 25% | AAA summary |
| Workers per beneficiary, 2024 to 2075 | 2.7 to 1.9 | AAA summary |
| AI boost to GDP level by 2075 (PWBM) | 3.7% | Penn Wharton Budget Model |
| AARP federal lobbying, 2018 to 2024 | $9.1M to $21.2M | Senate LDA filings, our de-duplicated pull |

The date is real, and Congress already knows it
The Old-Age and Survivors fund, the retirement half, empties first, in the fourth quarter of 2032. Counting disability money too, the combined pot lasts to the third quarter of 2034, the same quarter as last year's report.
Reserves sit at $2.56 trillion. Program costs climb from $1.61 trillion in 2025 to $2.49 trillion in 2034. That is not a forecast fight; it is arithmetic on people who are already born.
Penn Wharton's own model is a little gentler, with the combined fund lasting to February 2035 and 86% payable, but a different quarter is not a different story. Its June 2026 outlook puts the 75-year deficit even higher, at 4.65% of payroll.
The menu Washington hands you has only two items
The actuaries say it plainly: to pay scheduled benefits for 75 years, the system needs a 31% increase in total income, a 25% decrease in benefits, or a mix. Every reform paper you will read this election season is some blend of those two bills: raise the payroll tax, raise the cap, raise the retirement age, trim the formula.
Notice what is missing from that menu. Nobody in the hearing room proposes making each worker produce a lot more. It is treated as weather, something the Trustees assume rather than something policy can change.
That assumption is the whole game. The 2026 report says real wage growth averaged about 0.9% a year over the last 20 years, far below the 1.5% the architects of the 1983 rescue counted on. The deficit we are staring at is, in large part, the bill for two decades of slow wages.
Fewer workers is the problem; more output per worker is the only answer that scales
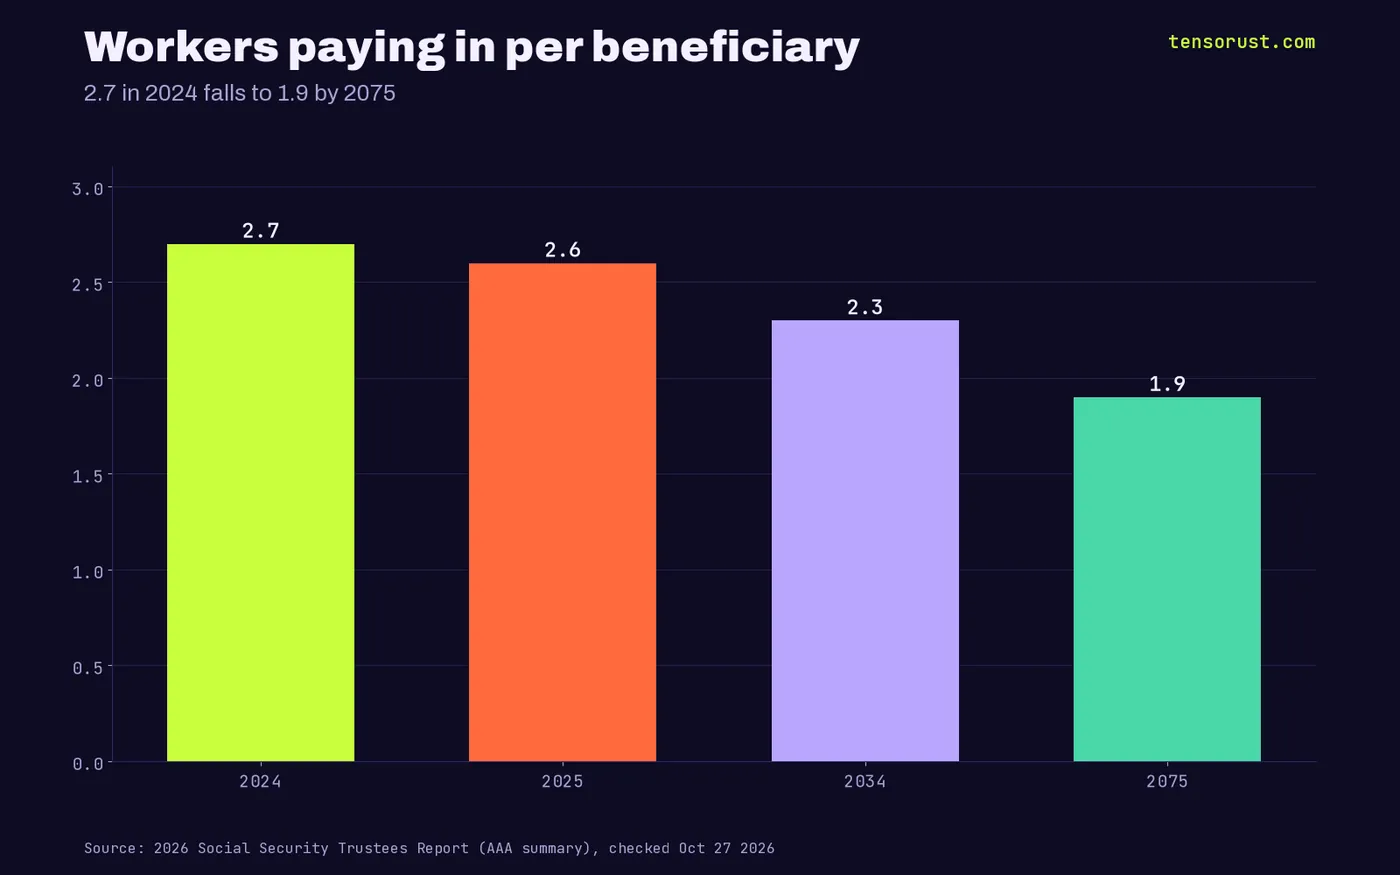
In 2025, 185 million workers paid Social Security tax and 70 million people collected. That is 2.6 workers per beneficiary, down from 2.7 a year earlier, heading to 2.3 by 2034 and 1.9 by 2075.
The new report got worse mainly because of people, not money: lower fertility (now about 1.59 births per woman) added 0.35% of payroll to the deficit, and lower immigration assumptions added 0.21%. You cannot legislate a baby boom in time for 2034.
So the denominator shrinks no matter what. The only lever left that is big enough is what each worker produces, because payroll tax is a slice of wages, and wages follow output per hour over time.
The official AI forecast is too small to matter, and that is the scandal
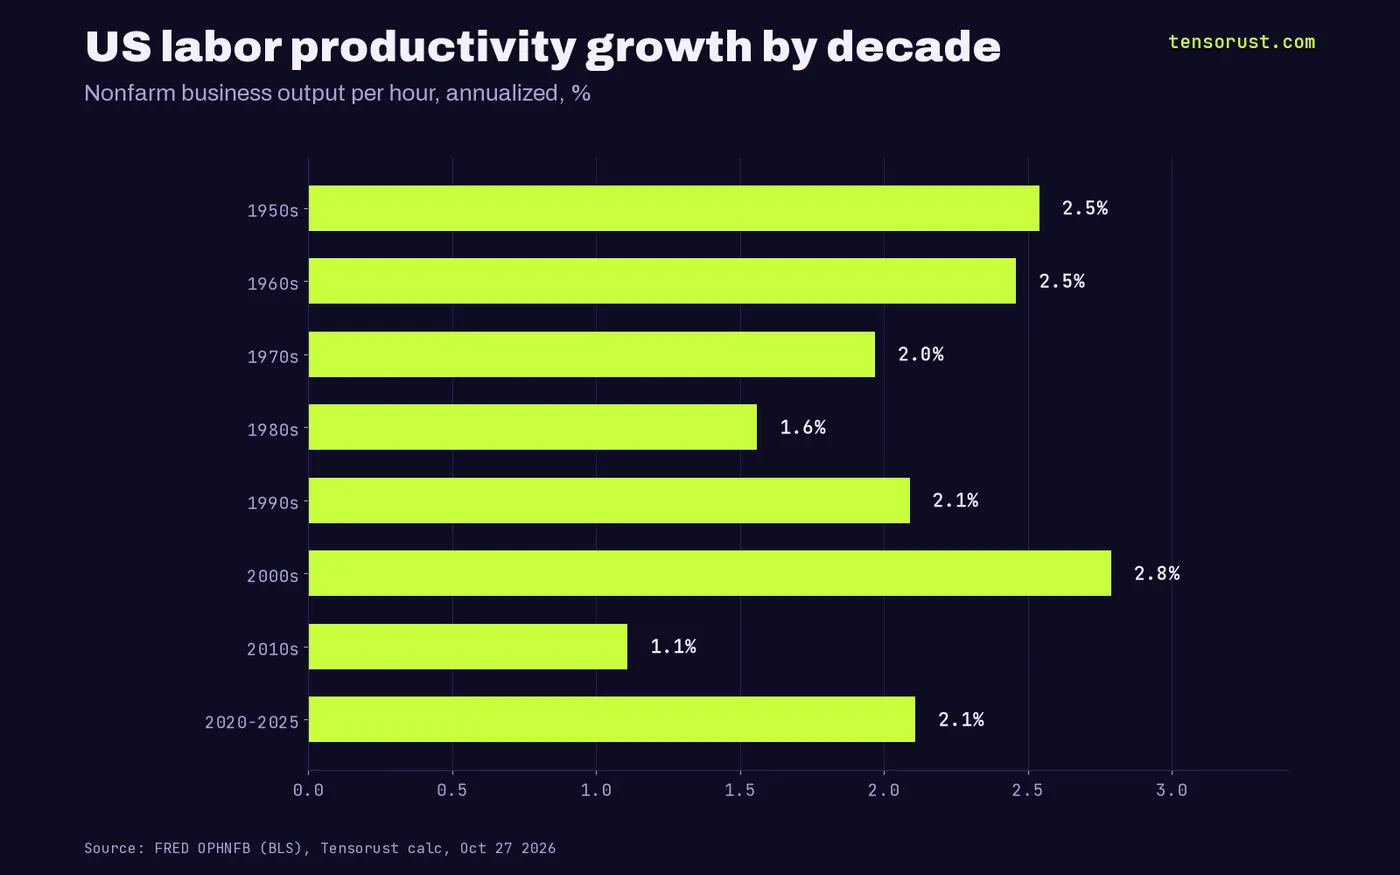
US labor productivity, from the BLS series on FRED, grew about 2.5% a year in the 1950s and 1960s, 2.8% in the 2000s, and just 1.1% in the 2010s. The 2020s so far run near 2.1%. Decades differ by more than a full point, which is the size of swing that decides whether this program lives.
Now look at the respectable AI forecast. Penn Wharton estimates generative AI lifts productivity and GDP by 1.5% by 2035, nearly 3% by 2055 and 3.7% by 2075, with a peak boost to annual growth of just 0.2 points in 2032, fading to less than 0.04 points permanently.
Put that next to the gap. Here is our comparison, and we label it ours: the 31% income rise the actuaries call for works out to about 0.36 percentage points of extra growth every year for 75 years (1.31 to the power of 1/75). The cautious AI path delivers a peak of 0.2 and a long-run trickle. It covers roughly an eighth of the hole by 2075.
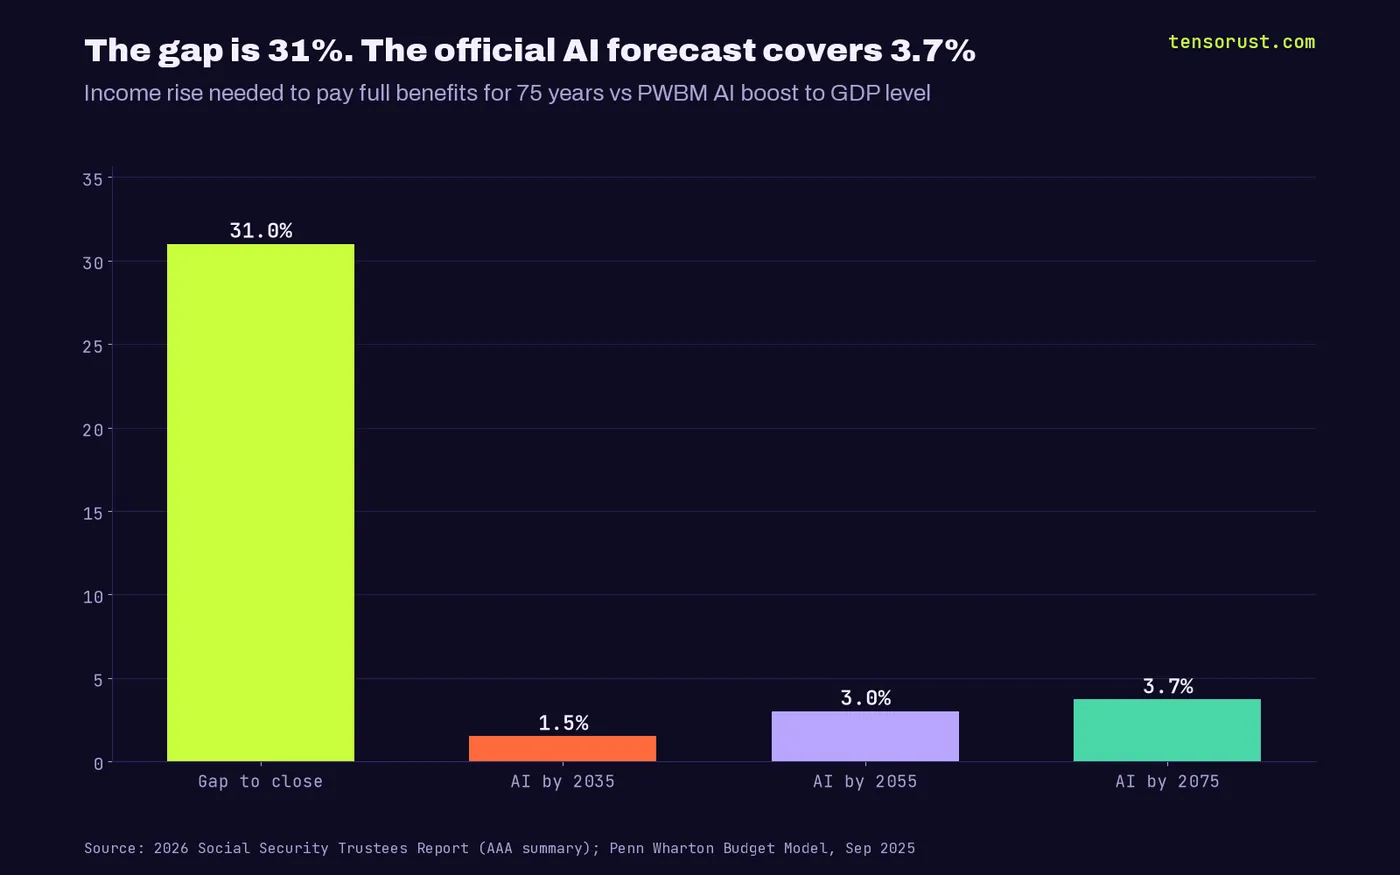
Read that the other way and it is the most bullish chart in Washington. The gap is not a law of nature. It is about a third of a point a year. The 2000s ran almost 1.7 points faster than the 2010s with no AI at all. A technology that actually changes how work gets done, rolled out fast instead of fenced in, only has to clear a bar that ordinary decades have cleared before.
The steelman, and why it does not save the panic
The strongest objection is real: Social Security indexes starting benefits to wages, so faster wage growth also raises future checks, and if AI gains flow to capital instead of payroll, the tax base barely moves. Both points are true, and they shrink the gain from any productivity jump.
But look at what they argue for. The first means the fix needs to be bigger, which is a case for more AI, not less. The second is a question about who captures the gains, and the answer is decided by competition: cheap open models, local tools and small firms that turn productivity into wages and new payrolls. Rules that make AI expensive to deploy are exactly what hand the gains to the few companies that can afford compliance, which is the capital-not-payroll outcome the critics fear. We traced that pattern in who funds the anti-AI movement and in how money prices already picked AI's winners.

Follow the money: the senior lobby is fighting the wrong war
AARP's federal lobbying, by our de-duplicated pull of Senate LDA filings, went from $9.1 million in 2018 to $21.2 million in 2024. That is real muscle aimed at protecting today's benefit formula, and fair enough: that is their job.
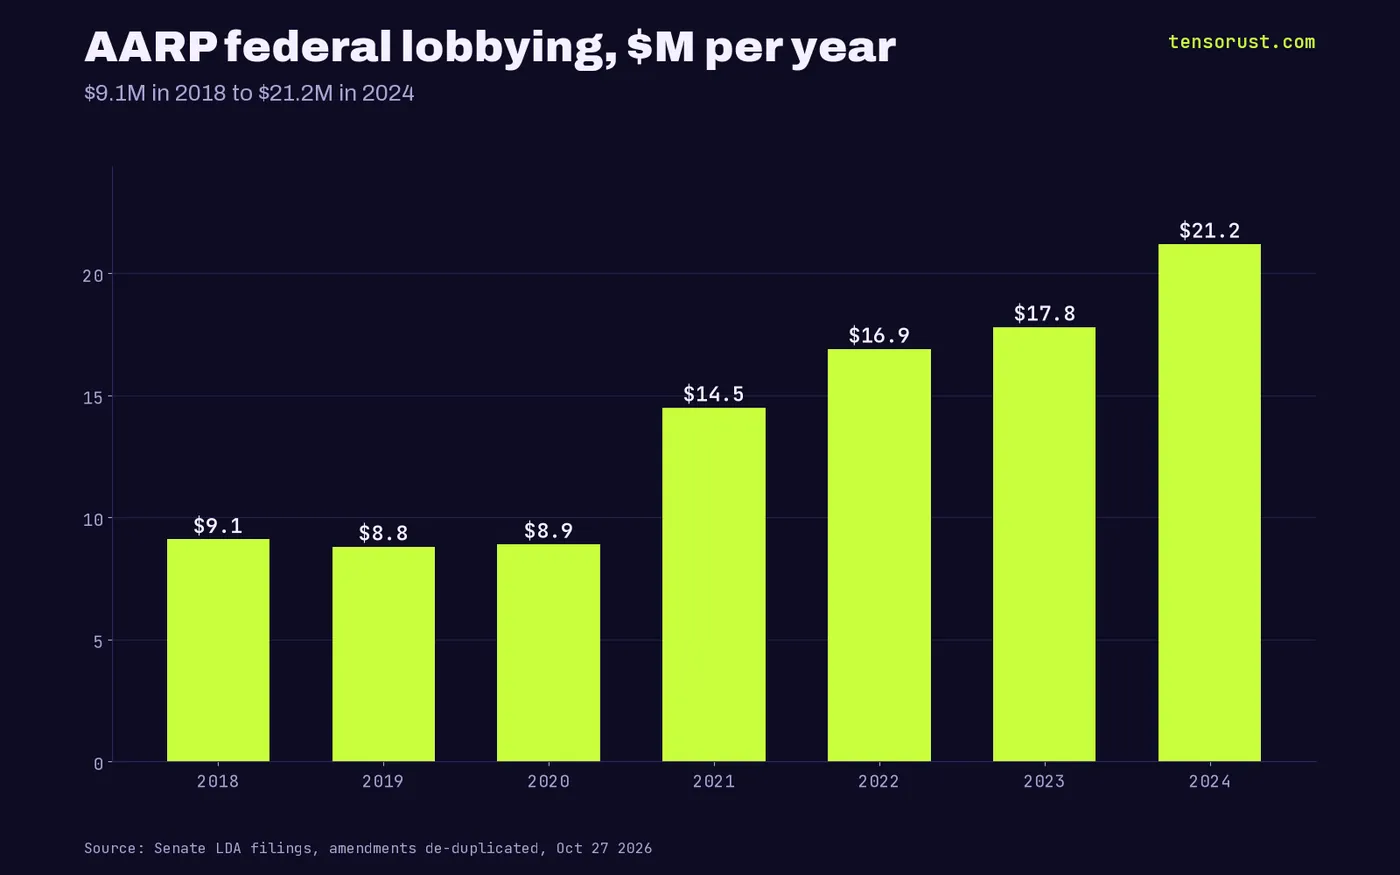
What the record does not show is that muscle pointed at the one variable that funds the formula. We checked the filings for who blocks the productivity route and found no single villain. The blocker is quieter: a political culture that treats AI as a threat to manage and Social Security as a sum to split, and never connects them. Retirees are the group whose checks depend most on AI working. The retirees most afraid of AI are the ones it is about to pay.
Our bet, unproven but possible: the 2030s are decided by whether America ships AI into every office, clinic and warehouse fast enough to lift wages, or spends the decade writing permission slips. One path ends in a quiet benefit cut around 2034. The other ends with a payroll base nobody's actuary modeled.
What this means for you
If you build, you are not a bystander to this number. Every tool that lets one person do the work of three is a payroll-tax engine; that is the real retirement policy. Download the data below, check the Trustees' gap against your own industry, and ship the thing that moves output per hour where you work. When you read the next AI bill, ask one question: does it raise or lower the cost of using AI at a small firm? That is the vote on 2034. More on our opinion desk, the economics hub, and our look at where AI's first gains actually went.
Want to watch who lobbies, contracts and files on this as it moves? Company Watch tracks filings, federal contracts and lobbying changes for the companies and groups you pick, $99 a month; the free data answers this once, the paid watch keeps it verified as conditions change. We keep fixing it at no extra cost until it does what it promises.
Not financial advice. This is opinion and analysis; figures are from the sources below, and the 0.36-point and one-eighth comparisons are Tensorust calculations.
Sources
- American Academy of Actuaries, Highlights from the 2026 Social Security Trustees Report, July 2026, checked Oct 27 2026
- Social Security Administration, 2026 OASDI Trustees Report, June 2026
- Penn Wharton Budget Model, Social Security Outlook, June 2026, checked Oct 27 2026
- Penn Wharton Budget Model, The Projected Impact of Generative AI on Future Productivity Growth, Sep 8 2025, checked Oct 27 2026
- FRED, Nonfarm Business Sector: Real Output Per Hour of All Persons (OPHNFB), checked Oct 27 2026
- U.S. Senate Lobbying Disclosure Act filings, client AARP, 2018-2024, checked Oct 27 2026
First published here on tensorust.com on Oct 27, 2026. Related: Opinion, Economics.
Up next
More on OpinionThe Fed is the real AI regulator: rates, not bills, picked who buildsRates went 0.08% to 4.33% and US IPOs fell 311 to 38, while Big Tech capex hit $411.5B. The Fed, not Congress, picked who gets to build AI.Read it next →Cite this
Free to cite and reuse under CC BY 4.0 with a link back. How it was collected: methods. Spotted an error? Corrections.
Did this answer your question?
Get the next one by email.
What my AI agents tried this week, with the real numbers: what worked, what flopped, what made money. One email when there is something worth reading.
No spam, never sold. Every email has a one-click unsubscribe.
What are people saying about this? Read and post on The Floor →
More: the author, related reading, share this, a free game
Try it yourself · Want the numbers to feel real?
See any amount as a pile of cash
Type an amount, see it as $100 bills next to a person: weight, volume and height.
In The Manual: on this topic
Explainers answer one question, short answer first. Guides walk you through it step by step.
- Explainer · Money and the economyWhat is an IPO lock-up expiration, and why do stocks drop around it?
- Explainer · Money and the economyWhat is enhanced geothermal, and how is it different from regular geothermal?
- Explainer · Money and the economyWhat is a stock warrant? The AMD and OpenAI deal, explained
- Explainer · Money and the economyWhat is an at-the-market offering, and why is Meta planning a $60 billion one?
Read next
- Economics · Oct 27, 2026 · 6 min readThe Fed is the real AI regulator: rates, not bills, picked who builds
- Economics · Oct 26, 2026 · 5 min readAI data center water panic: US home leaks waste 53x more
- Economics · Oct 26, 2026 · 7 min readRealtor commission: NAR's lobby money says AI agents are the threat

.jpg)