
By Matt Busel, who built the apps, crates and game he writes about · every number links to its source and every dataset is downloadable (methods) · corrections · featured in Kirino, gamebiz, This Week in Rust, New Mobile Life, By-Press
Water privatization: private water costs 59% more than city water
On this page · 9 sections
- Key numbers
- The water bill already beat inflation by a mile
- Private water is the expensive water, and nobody disputes the gap
- How the markup works: your town's purchase price becomes your rate base
- Follow the money: the roll-up is speeding up
- The crisis is real, and it is also the pitch
- Who pushes the rules, and the twist nobody expects
- What this means for you
- Sources
Short answer: Investor-owned water utilities charge about 59% more for water than city-owned systems, and the "crumbling pipes" crisis is now the sales pitch for buying more of them. The tap that comes from your own town is still the cheapest water in America, and the fight over who owns the meter is the real story behind every lead-pipe headline.
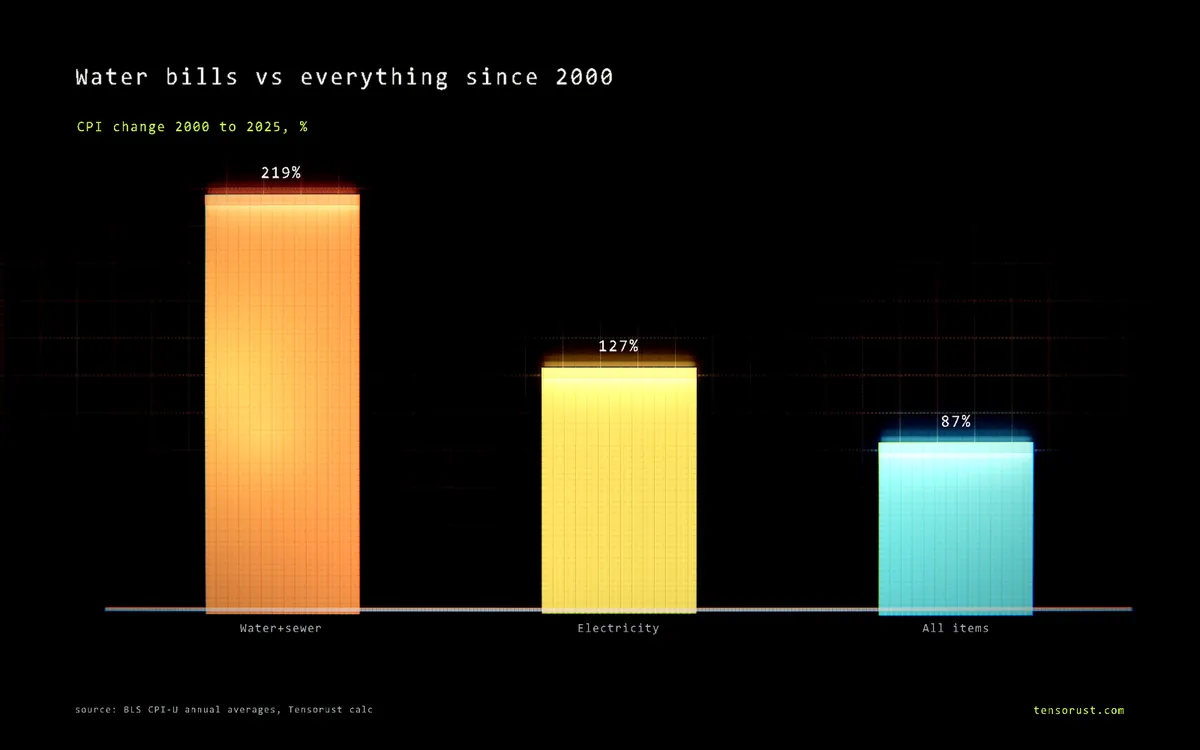
TL;DR: Since 2000 the US price index for water and sewerage maintenance is up 219%, against 87% for everything else and 127% for electricity (BLS). American Water, the largest investor-owned water company, closed 31 small-system buyouts in 2024 and 2025, has 20 more pending worth $582 million, and agreed in October 2025 to merge with Essential Utilities. The deals run on one quiet rule: in some states the price a utility pays for your town's pipes goes into the base it earns a 9.6% to 10.95% return on, and you pay that return in your bill.
Key numbers
| What | Number | Source, checked Oct 27 2026 |
|---|---|---|
| Water and sewerage CPI, 2000 to 2025 | +219% | BLS CUUR0000SEHG01 |
| All-items CPI, 2000 to 2025 | +87% | BLS CUUR0000SA0 |
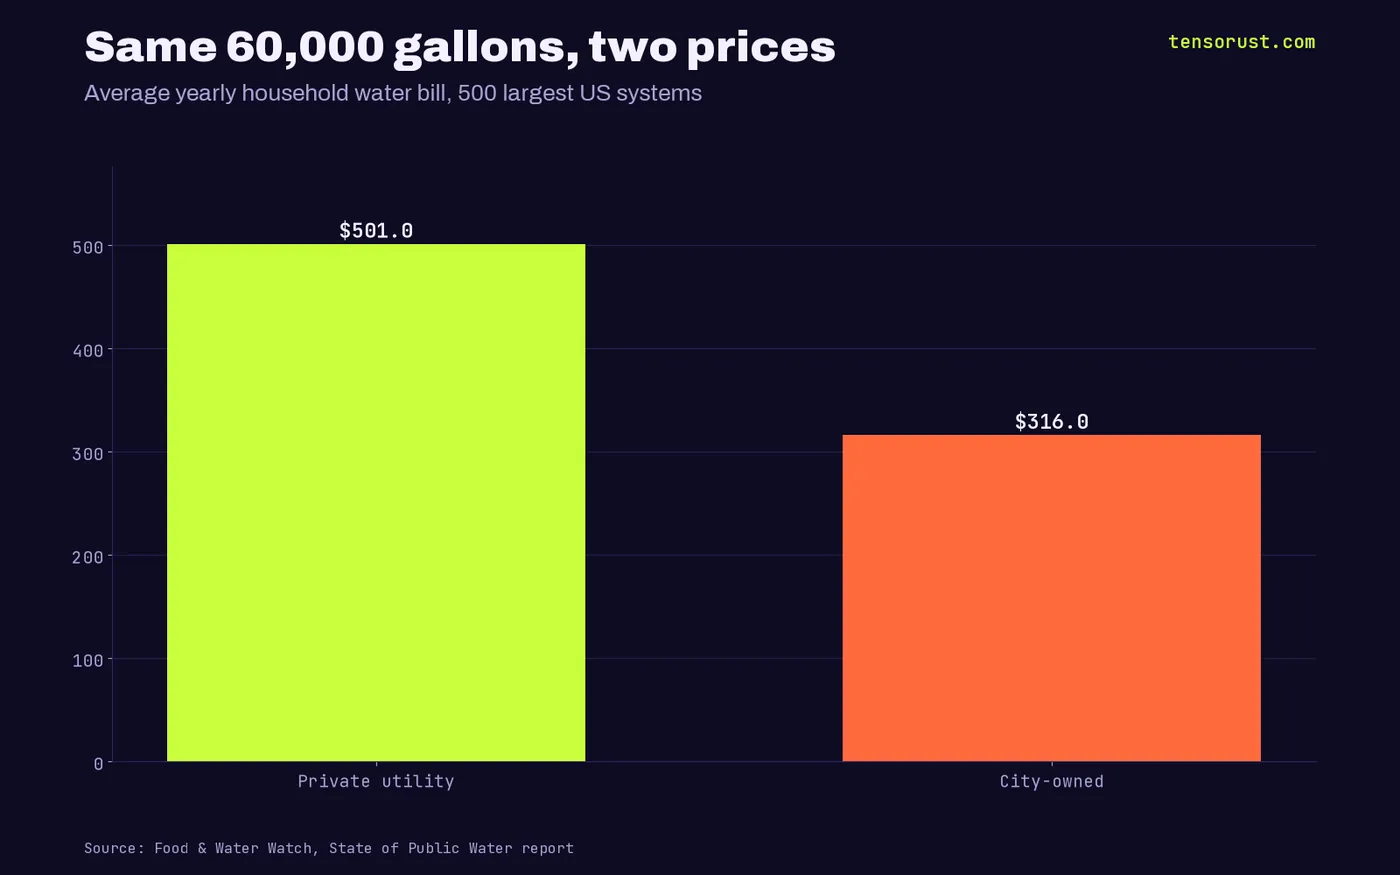
| Average yearly water bill, private vs city (60,000 gallons) | $501 vs $316 | Food & Water Watch |
| Authorized return on equity in American Water's 2025 rate orders | 9.60% to 10.95% | American Water 10-K, FY2025 |
| American Water pending buyouts, end of 2025 | 20 deals, $582M, 104,300 customers | American Water 10-K, FY2025 |
| American Water 10-year spending plan | $46B to $48B | American Water 10-K, FY2025 |
| EPA 20-year drinking water need | $625B | EPA 7th DWINSA |

The water bill already beat inflation by a mile
Everyone knows the power bill went up. Almost nobody noticed the water bill went up faster.
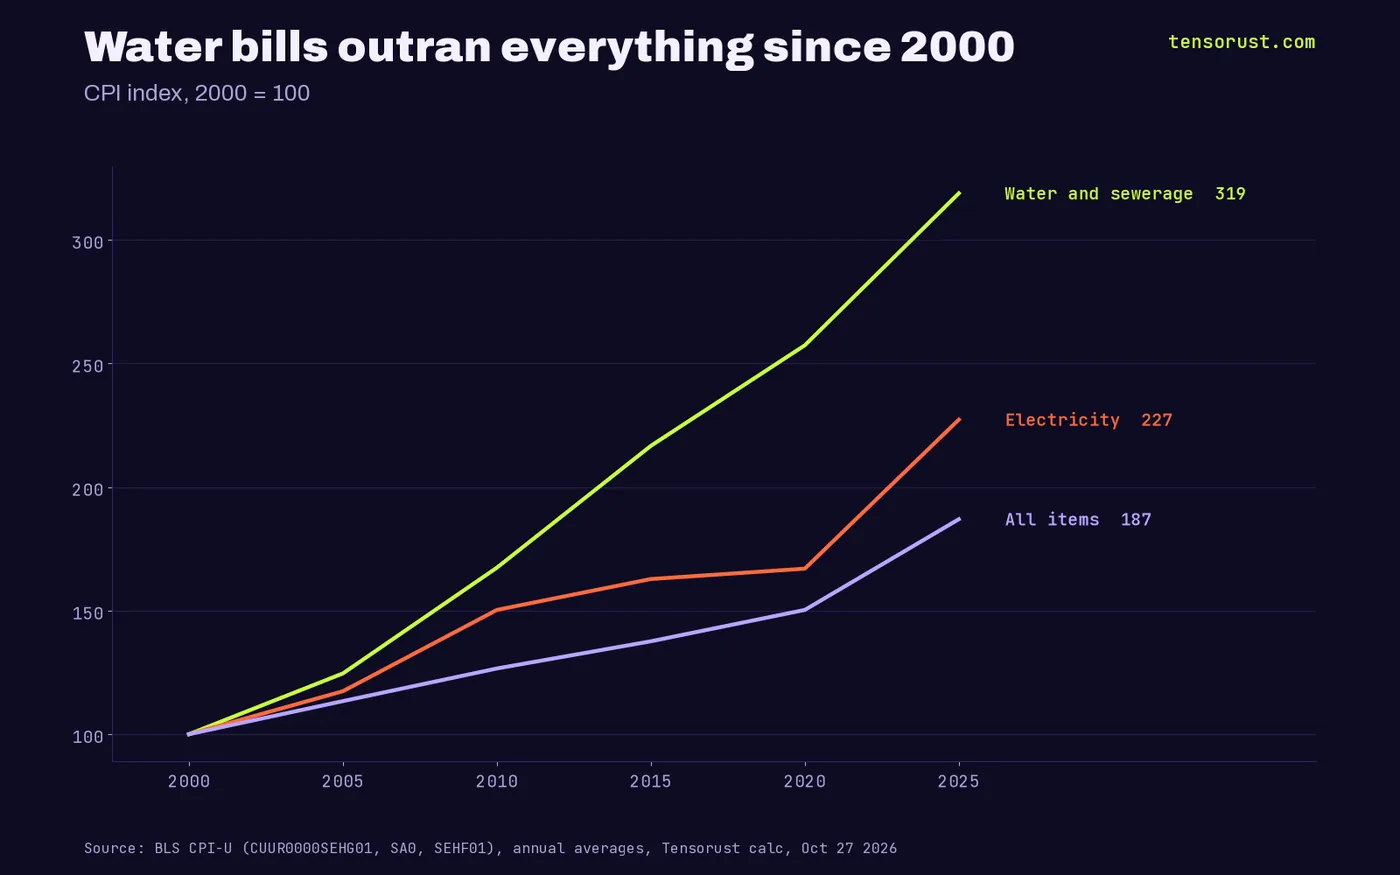
We pulled the Bureau of Labor Statistics consumer price series for water and sewerage maintenance back to 2000. Indexed to 2000, it ends 2025 at 319. Electricity ends at 227. All items ends at 187.
So the water line rose 219% while prices in general rose 87%. That gap is the opening every buyer walks through: a town that cannot raise rates fast enough to keep up starts listening to whoever offers a check.
Private water is the expensive water, and nobody disputes the gap
Food & Water Watch compiled the rates of the 500 largest community water systems in the US. For the same 60,000 gallons a year, private for-profit companies charged households an average of $501. Local governments charged $185 less, about $316.
That is a 59% premium on water. On sewer service the group found 63%.
Yes, Food & Water Watch is an activist group with a side. The number is still the cleanest public comparison anyone has published, and the industry has spent years arguing about why the gap exists, not whether it does. The why is the interesting part.
How the markup works: your town's purchase price becomes your rate base
Here is the machine, in plain words. A regulated utility earns a set return on its "rate base," the money it has sunk into pipes and plants. A bigger rate base means a bigger guaranteed profit, collected from your bill. We walked through the same engine for electricity in the 10% guarantee hidden in your power bill.
Water used to be valued the old way: what the pipes cost, minus wear. A 60-year-old city system is worth little on that math. American Water's own annual report spells out the fix it backs: "state legislation that enables the consolidation of the largely fragmented water and wastewater industries through third-party fair market valuations of purchased property."
The same filing says the quiet part: some states "allow the respective public utility commissions to use fair market value to set ratemaking rate base instead of the traditional depreciated original cost." Translation: the buyer can pay your town an appraised price, then charge you a return on that price for decades.
And the return is not small. The rate orders listed in American Water's 2025 report authorize returns on equity from 9.60% (the low end) to 10.95% (the high end). Kentucky got 9.70% on a $667 million rate base. Food & Water Watch puts the average municipal bond rate at about 4%, against a private cost of capital of 7.5% to 14%. Over 30 years that makes private financing 1.5 to 2.5 times as expensive.
Follow the money: the roll-up is speeding up
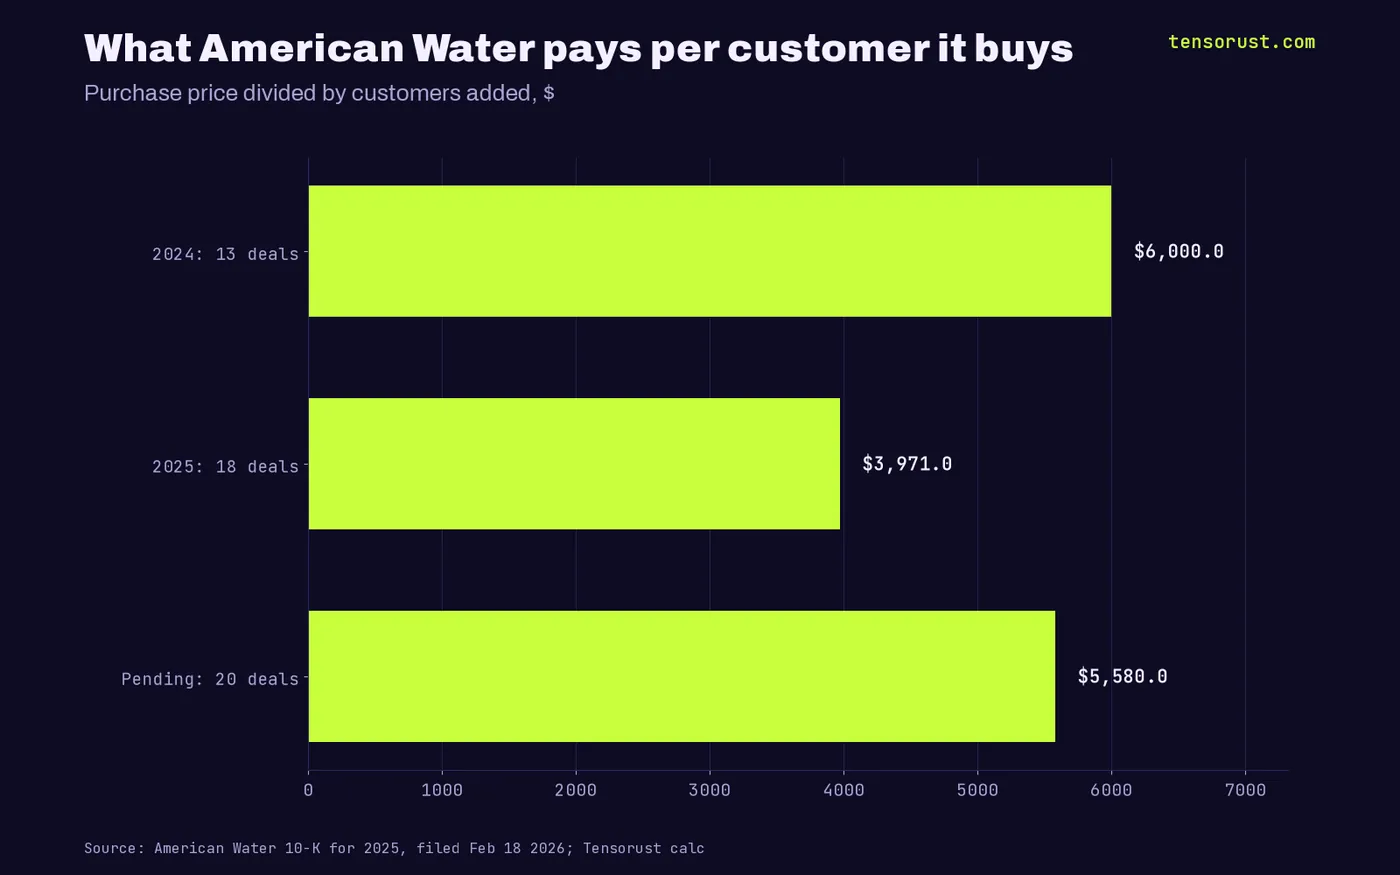
American Water serves about 14 million people in 24 states. In 2024 it closed 13 acquisitions of water and wastewater systems for $417 million, adding about 69,500 customers. In 2025 it closed 18 more for $83 million, adding about 20,900.
At the end of 2025 it had 20 more deals signed and waiting: $582 million for about 104,300 customers. That works out to about $5,580 paid per customer, near the $6,000 per customer of 2024 (our math from the 10-K).
Then the big one. On October 26, 2025, American Water agreed to combine with Essential Utilities, its largest investor-owned rival, in a stock-for-stock deal it expects to close by the end of the first quarter of 2027. The 10-K also names who else is bidding for your town's pipes: "infrastructure funds, multi-utility companies and others."
The spending plan is the tell. American Water says it will invest $19 billion to $20 billion over five years and $46 billion to $48 billion over ten. Every dollar of that is rate base. Rate base is what the return is paid on.
The crisis is real, and it is also the pitch
Here is the steelman, and it is strong. EPA's 7th Drinking Water Infrastructure Needs Survey says US systems need $625 billion over 20 years: $422.9 billion for pipes and mains, $107 billion for treatment, $56.1 billion for storage, $25.2 billion for source water. A town of 3,000 people cannot float that. Lead lines and new contaminant rules land hardest on exactly the systems that can least afford them.
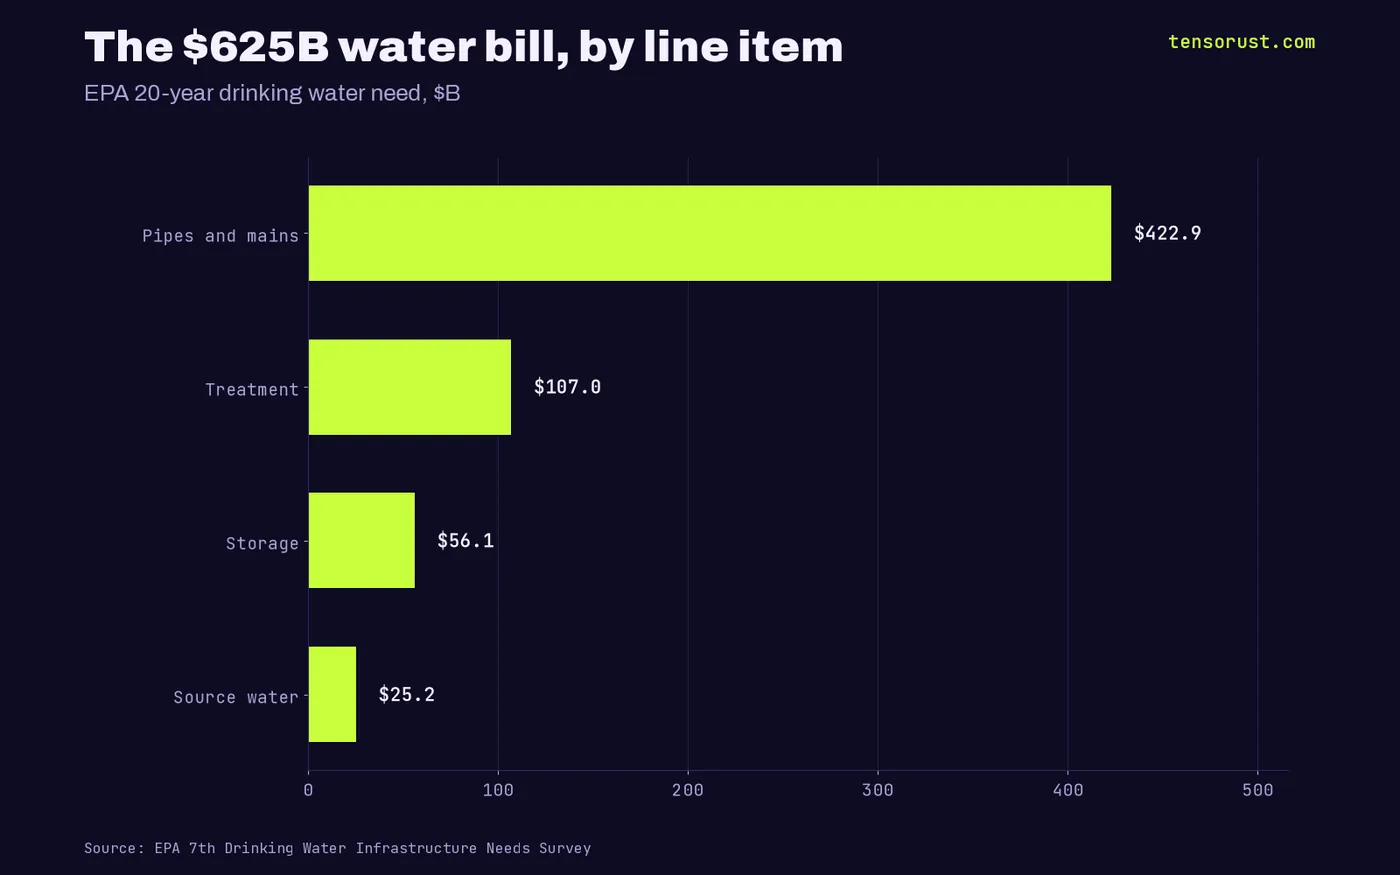
All true. Now look at what the fix costs. The need is the same whoever owns the pipes. What changes is the price of the money: a city borrows at muni rates, a private owner charges you an equity return near 10% on top. The crisis does not require a buyer. It requires capital, and public capital is the cheaper kind.
That is why we say the infrastructure crisis is the sales pitch. The scarier the pipe headline, the easier it is to get a council to sell the one asset that was keeping its residents' bills lowest.

Who pushes the rules, and the twist nobody expects
We checked the lobbying record instead of assuming it. American Water's federal lobbying runs a few hundred thousand dollars a year: $426,000 in 2019, a peak of $635,420 in 2024, $550,000 in 2025 (Senate LDA filings, amendments de-duplicated). The National Association of Water Companies, the industry group, reported $200,000 a year from 2023 to 2025. Essential Utilities shows no federal filings under its own name.
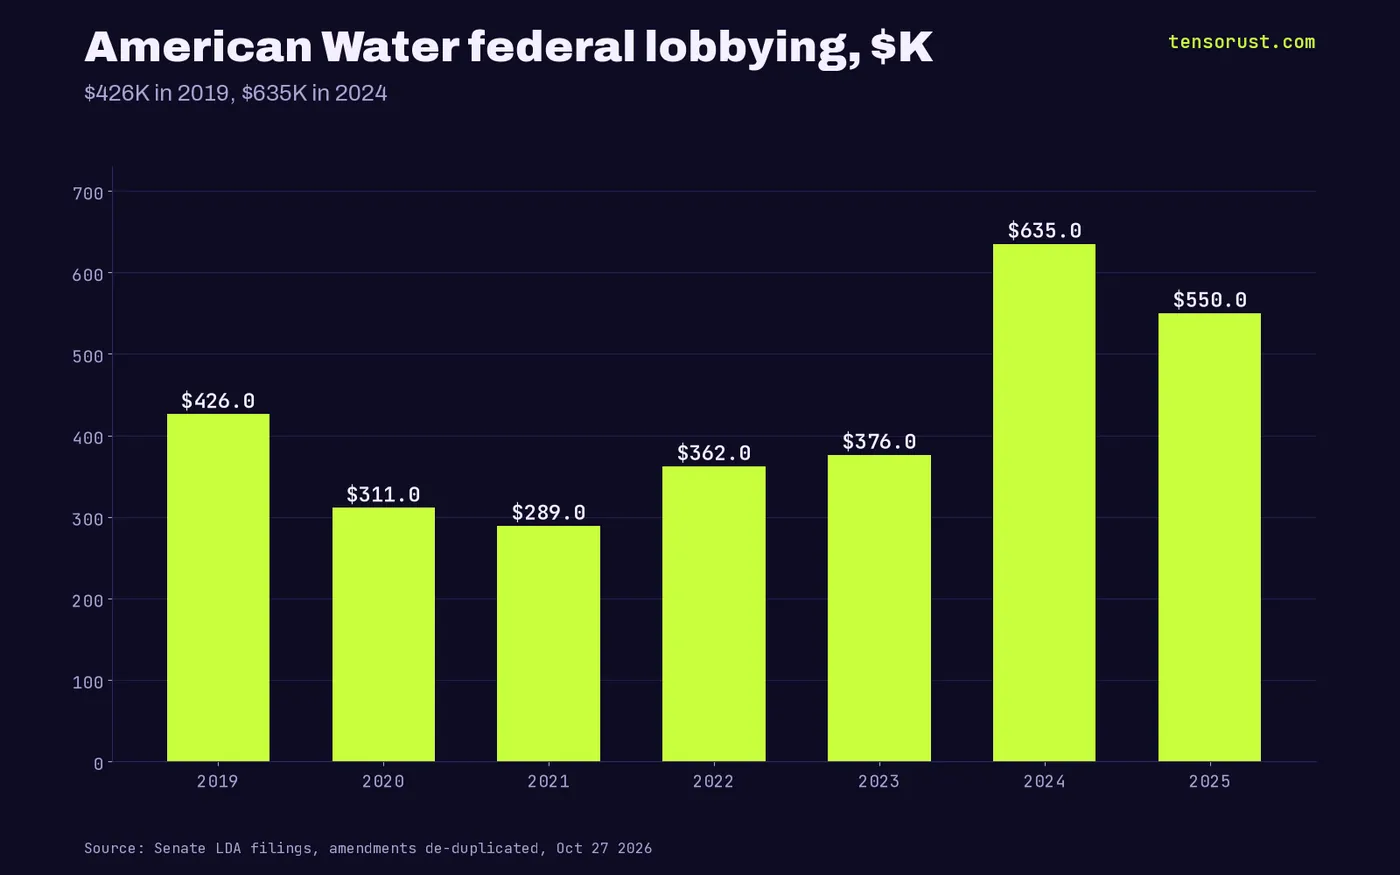
That is small money, and it is the honest finding: the action is not in Washington. Fair market value rules are written state by state and decided at state utility commissions, where few people show up. Pennsylvania's commission had to update its process in June 2024 to "increase public involvement" in exactly these sales.
Now the twist. If the return is guaranteed, the owners must be getting rich, right? Not on the stock. American Water closed at $173.22 on October 27, 2021 and $141.70 on October 26, 2026, down 18%, while the S&P 500 ETF SPY went from $453.94 to $765.37, up 69% (Yahoo Finance, our pull). Net income still rose from $709 million in 2020 to $1.111 billion in 2025 (SEC filings).
Our reading: the guarantee does not protect the shareholder from higher interest rates, it protects the rate base. The one party with no way out is the household on the meter. Profits grow, the stock drifts, and the bill is the only number that reliably goes up.
What this means for you
Find out who owns your water. Your annual Consumer Confidence Report names the system, and EPA's public water system lookup tells you whether it is city, authority or investor-owned. If your town is being pitched a sale, ask three questions in public: will the price go into rate base at fair market value, what return on equity will the buyer earn, and what the same project costs on a municipal bond. Then show up at the state utility commission, where the decision is actually made.
Builders, this is a data problem waiting for an agent: rate cases, 10-K deal lists and commission dockets are public, but scattered. Every number in this piece is in our CSV for you to start from. More context in Opinion, Economics and our piece on where the water really goes.
If you want this watched for you, Company Watch tracks every filing, federal contract and lobbying change for the companies you name, American Water and Essential included, for $99 a month. We keep fixing it at no extra cost until it does what it promises.
Not financial advice. This is opinion and analysis from public data; do your own research before you buy or sell anything.
Sources
- BLS, CPI-U water and sewerage maintenance (CUUR0000SEHG01), all items (CUUR0000SA0), electricity (CUUR0000SEHF01), checked Oct 27 2026
- American Water Works, Form 10-K for 2025, filed Feb 18 2026, checked Oct 27 2026
- Food & Water Watch, Water Privatization: Facts and Figures, checked Oct 27 2026
- EPA, 7th Drinking Water Infrastructure Needs Survey and Assessment, checked Oct 27 2026
- Senate Lobbying Disclosure Act filings: American Water Works, National Association of Water Companies, checked Oct 27 2026
- Yahoo Finance, AWK and SPY daily closes, our pull Oct 27 2026
- EPA, Information about Public Water Systems, checked Oct 27 2026
First published here on tensorust.com on Oct 27, 2026. Related: Opinion, Economics, Company Watch.
Up next
More on OpinionRooftop solar's 2024 crash: 3 California utilities made 48% of itUS rooftop solar additions fell 31% in 2024. Utility filings show PG&E, SCE and SDG&E made 48% of the drop, and Idaho fell 56% after net billing.Read it next →Cite this
Free to cite and reuse under CC BY 4.0 with a link back. How it was collected: methods. Spotted an error? Corrections.
Did this answer your question?
Get the next one by email.
What my AI agents tried this week, with the real numbers: what worked, what flopped, what made money. One email when there is something worth reading.
No spam, never sold. Every email has a one-click unsubscribe.
What are people saying about this? Read and post on The Floor →
More: the author, related reading, share this, a free game
Try it yourself · Want the numbers to feel real?
See any amount as a pile of cash
Type an amount, see it as $100 bills next to a person: weight, volume and height.
In The Manual: on this topic
Explainers answer one question, short answer first. Guides walk you through it step by step.
- Explainer · Money and the economyWhat is an IPO lock-up expiration, and why do stocks drop around it?
- Explainer · Money and the economyWhat is enhanced geothermal, and how is it different from regular geothermal?
- Explainer · Money and the economyWhat is a stock warrant? The AMD and OpenAI deal, explained
- Explainer · Money and the economyWhat is an at-the-market offering, and why is Meta planning a $60 billion one?
Read next
- Economics · Oct 27, 2026 · 6 min readRooftop solar's 2024 crash: 3 California utilities made 48% of it
- Economics · Oct 27, 2026 · 7 min readSocial Security runs dry in 2034. AI is the only fix big enough
- Economics · Oct 27, 2026 · 6 min readThe Fed is the real AI regulator: rates, not bills, picked who builds

.jpg)