
By Matt Busel, who built the apps, crates and game he writes about · every number links to its source and every dataset is downloadable (methods) · corrections · featured in Kirino, gamebiz, This Week in Rust, New Mobile Life, By-Press
Birth rate crisis: a housing and childcare price wall, not culture
On this page · 11 sections
- Key numbers
- The panic is aimed at the wrong target
- People still want kids. They are being priced out of them
- Our state test: the price wall is getting stronger every year
- The age clock is the hidden mechanism
- Follow the money: who owns the wall
- Why the culture story wins anyway
- The strongest case against us
- The way out: AI income meets cheap land
- What this means for you
- Sources
Short answer: America's birth rate is not collapsing because people stopped wanting kids. Americans still call 2.7 children the ideal family, yet the fertility rate hit 1.63 in 2024, and since 1997 day care prices rose 188% and home prices 187% while family income rose 136%. The "birth rate crisis" is a price wall, and the culture-war framing is what keeps the people who own that wall out of the story.
TL;DR: Across 49 states and DC, the link between home cost and fewer births has doubled in strength, from a correlation of -0.19 in 2005 to -0.38 in 2024, by our calculation from Zillow, Census and CDC data. The cheapest quarter of states had a fertility rate 12% higher than the priciest quarter in 2024, and the pricey states fell faster (-22.9% vs -15.4% since 2005). The typical first-time home buyer is now 40, a record, and only 24% of all buyers have kids at home, also a record low, so the move is to break the wall for yourself: earn a coastal income from wherever the house is cheap.
Key numbers
| What | Number | Source, checked Oct 25 2026 |
|---|---|---|
| Ideal number of kids, US adults | 2.7 | Gallup, Sep 25 2023 |
| US total fertility rate, 2024 (2007 peak) | 1.63 (2.12) | World Bank via FRED |
| Day care and preschool prices, 1997 to 2025 | +188% | BLS CPI CUUR0000SEEB03 |
| Median home sale price, 1997 to 2025 | +187% | Census/HUD via FRED |
| Median household income, 1997 to 2025 | +136% | Census via FRED |
| Home price to income, 1984 vs 2024 | 3.6x vs 5.0x | FRED MSPUS / MEHOINUSA646N, Tensorust calc |
| State link, home cost vs fertility (2005 vs 2024) | r = -0.19 vs -0.38 | Zillow ZHVI, FRED, CDC NCHS, Tensorust calc |
| Median age, first-time home buyer | 40 (record) | NAR, Nov 4 2025 |
| Home equity held by existing owners | $35.8T (was $18.1T end of 2019) | Fed Z.1 via FRED |
| Federal "baby bonus" | $1,000, once | IRS IR-2026-42 |

The panic is aimed at the wrong target
Every few weeks a new birth-rate panic piece lands. The culprits rotate: phones, dating apps, feminism, secularism, "young people are selfish." The fix rotates too: a conference, a slogan, a one-time check.
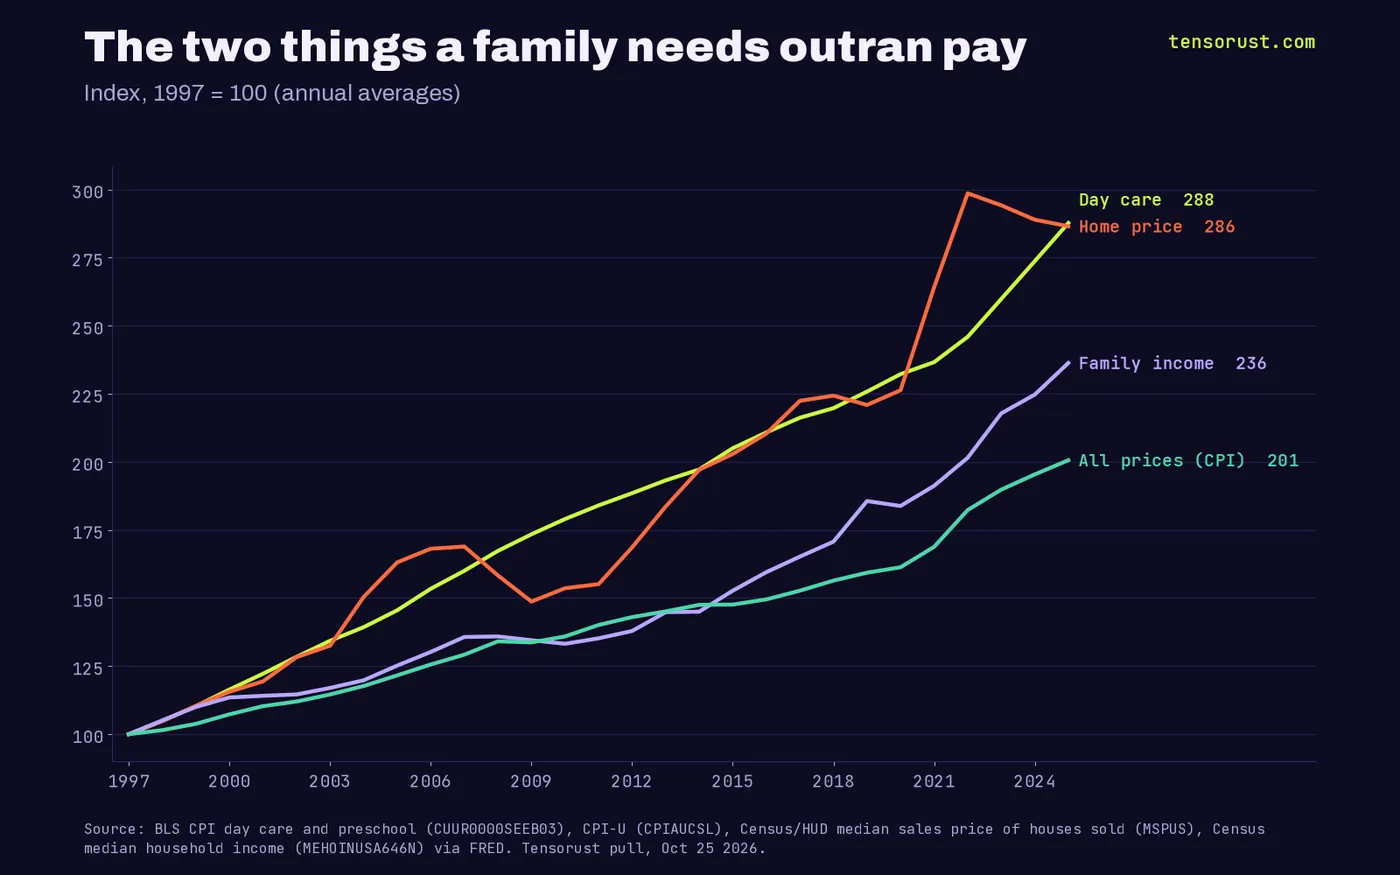
Here is the boring thing nobody wants to put on a stage. The two things a family needs most are space and care. Both got far more expensive than paychecks did, and fertility fell right along that line.
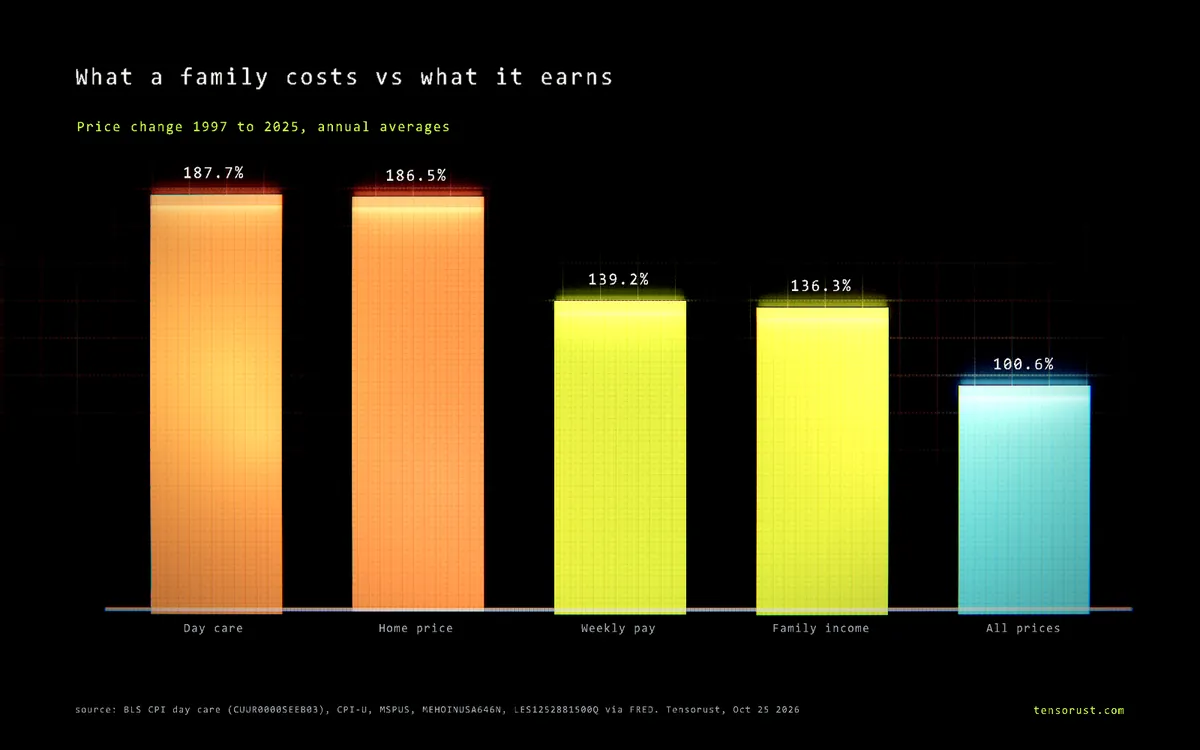
We pulled the series ourselves. From 1997 to 2025, the BLS day care and preschool price index rose 187.7%. The median sale price of a house rose 186.5%. Median household income rose 136.3%, median weekly pay 139.2%, and all consumer prices 100.6%. You can download every number in the data file under this piece.
People still want kids. They are being priced out of them
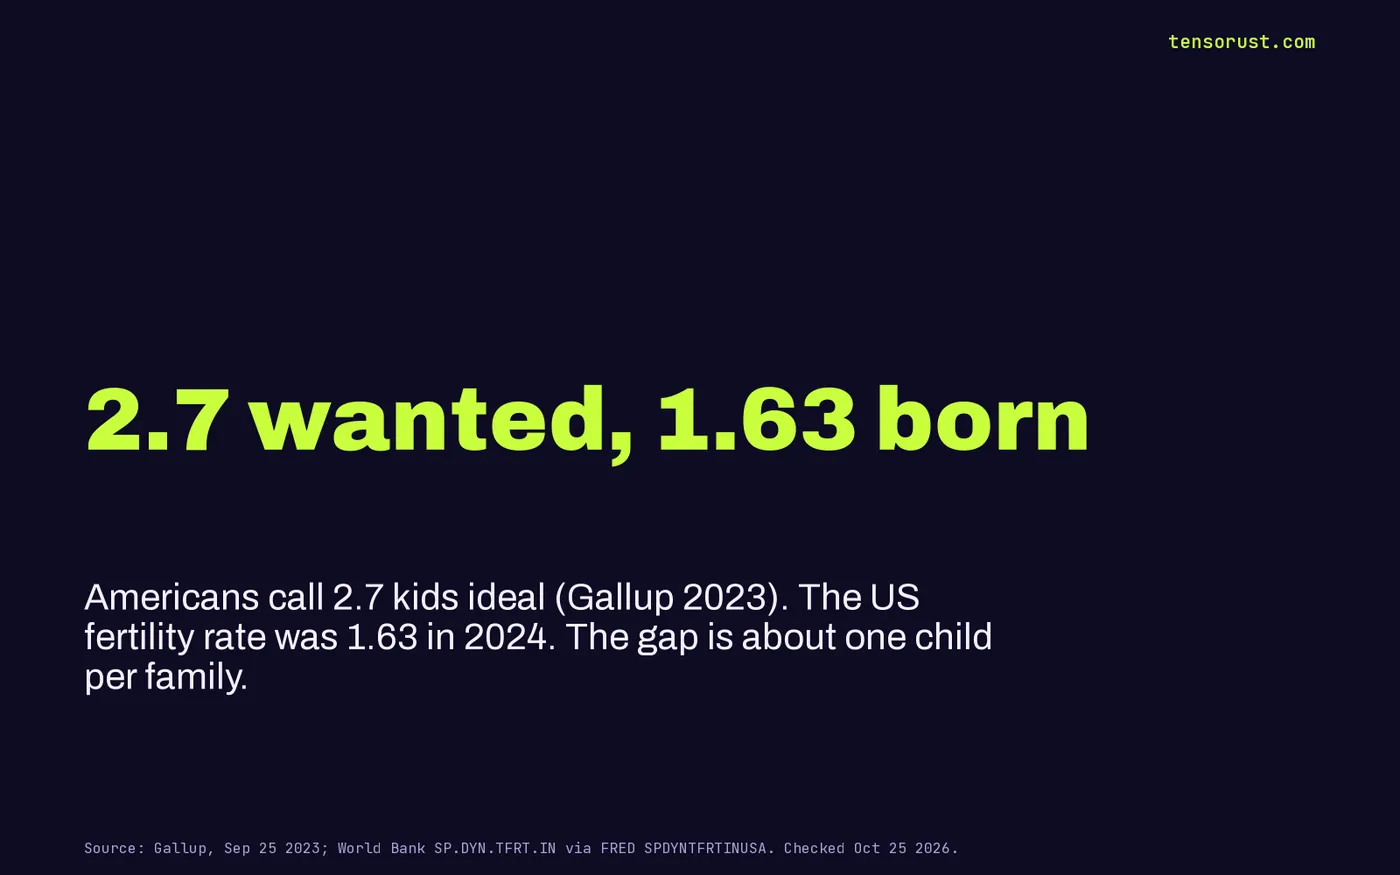
The "they just don't want children" story runs into Gallup's own numbers. In 2023, 45% of US adults said three or more kids is ideal, the highest since 1971, and just 2% said zero. The average ideal is 2.7 children.
Actual births tell a different story: the US total fertility rate (the number of kids a woman would have at today's birth rates) peaked at 2.12 in 2007 and was 1.63 in 2024. That is a gap of about one child per family between what people say they want and what they have.
When people want something and do not buy it, economists usually look at the price first. For babies, the commentariat looks at the soul first. That tells you who is writing the commentary.
Our state test: the price wall is getting stronger every year
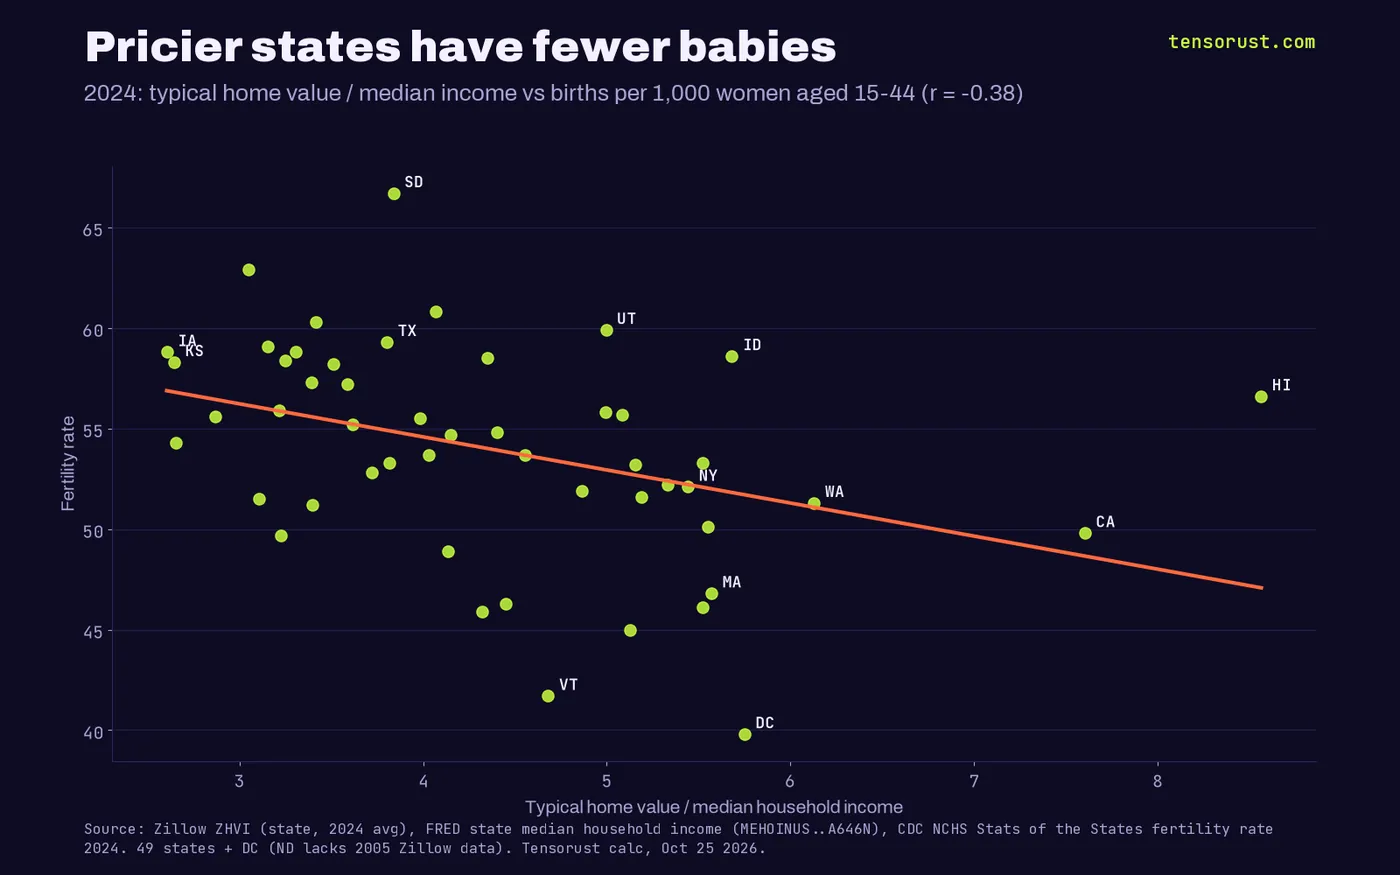
If the price story were wrong, home cost should not predict fertility across states. So we ran it. For every state plus DC we took the typical home value from Zillow, divided it by median household income from the Census (via FRED), and lined it up against the CDC's general fertility rate, which counts births per 1,000 women aged 15 to 44.
In 2024 the correlation is -0.38. Every extra year of income a typical home costs is worth about 1.6 fewer births per 1,000 women. Iowa and Kansas, where a home costs about 2.6 years of income, sit near 58 to 59. California, at 7.6 years, sits at 49.8.
The cheapest quarter of states (Iowa, Kansas, West Virginia, Ohio, Nebraska and seven more) averaged a fertility rate of 56.7 in 2024. The priciest quarter (Colorado, Florida, New York, Oregon, Montana, Nevada, Massachusetts, Idaho, DC, Washington, California, Hawaii) averaged 50.7. Since 2005 the cheap states fell 15.4%. The pricey states fell 22.9%.
The part that should end the debate is the trend. The same correlation was -0.19 in 2005 and -0.22 in 2014. It has strengthened almost every year since: -0.27 in 2017, -0.32 in 2019, -0.39 in 2021 and 2023. As housing got scarcer, it became a better and better predictor of who has babies.
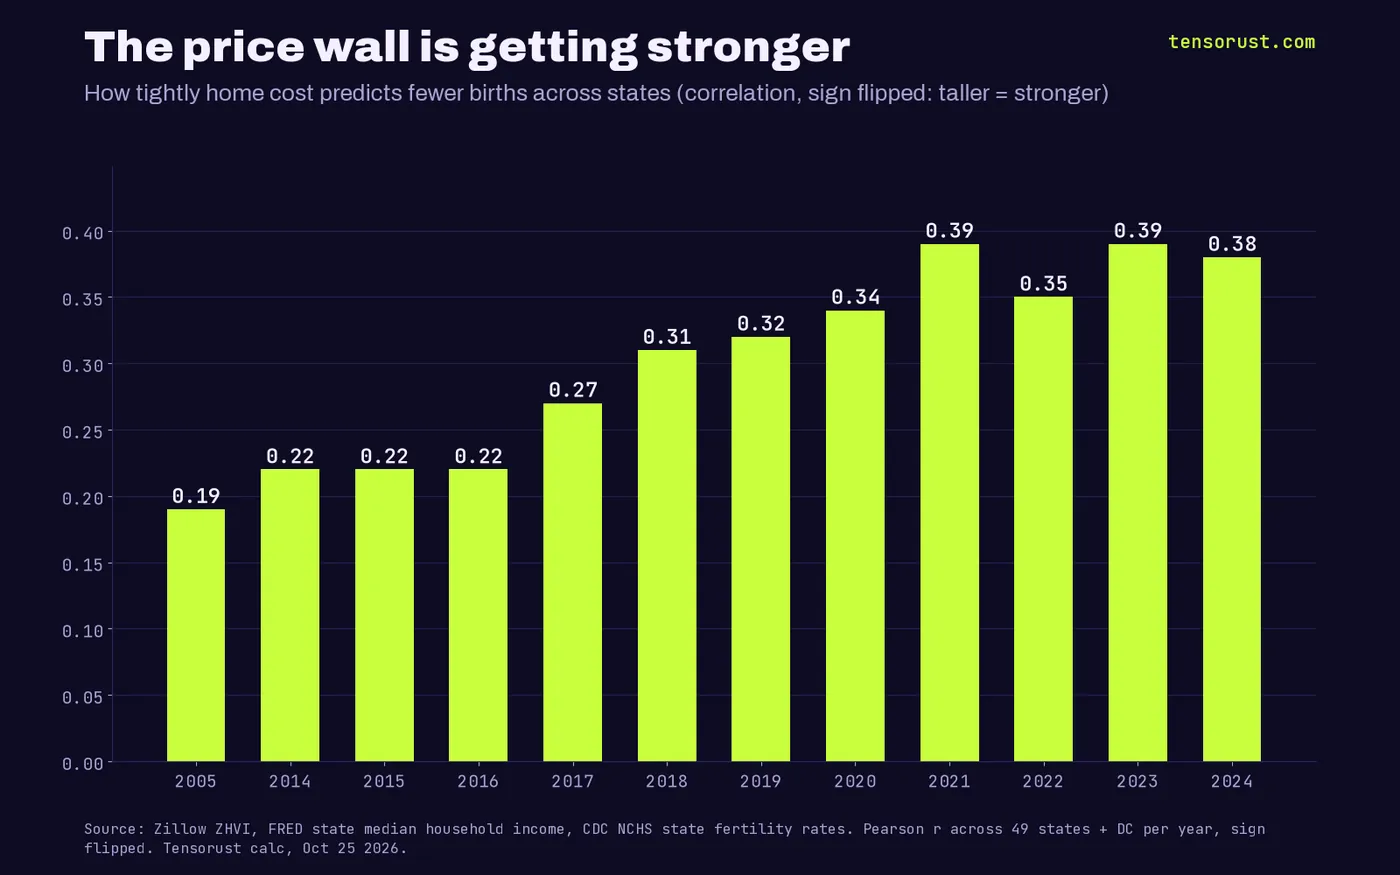
To be straight about the size: one variable explaining about 14% of the spread across states is a lot for social science, not everything. Utah and Idaho stay high on religion, Vermont stays low on age. Our reading is that culture sets where a state starts and price sets the direction it moves.
The age clock is the hidden mechanism
Price does not usually stop a family. It delays it, and delay is how one kid becomes the whole plan.
The National Association of Realtors' own 2025 survey puts the typical first-time home buyer at 40, an all-time high, with first-time buyers at a record-low 21% of sales. Just 24% of all buyers had children under 18 at home, also an all-time low. NAR's own advocacy chief says waiting until 40 instead of 30 can cost about $150,000 in equity on a starter home.
Meanwhile the CDC reports the average age of first-time mothers rose from 26.6 in 2016 to 27.5 in 2023. Put those numbers side by side and you see the squeeze: the house comes a decade after the first baby used to, and the biology does not wait for the closing date.
Follow the money: who owns the wall
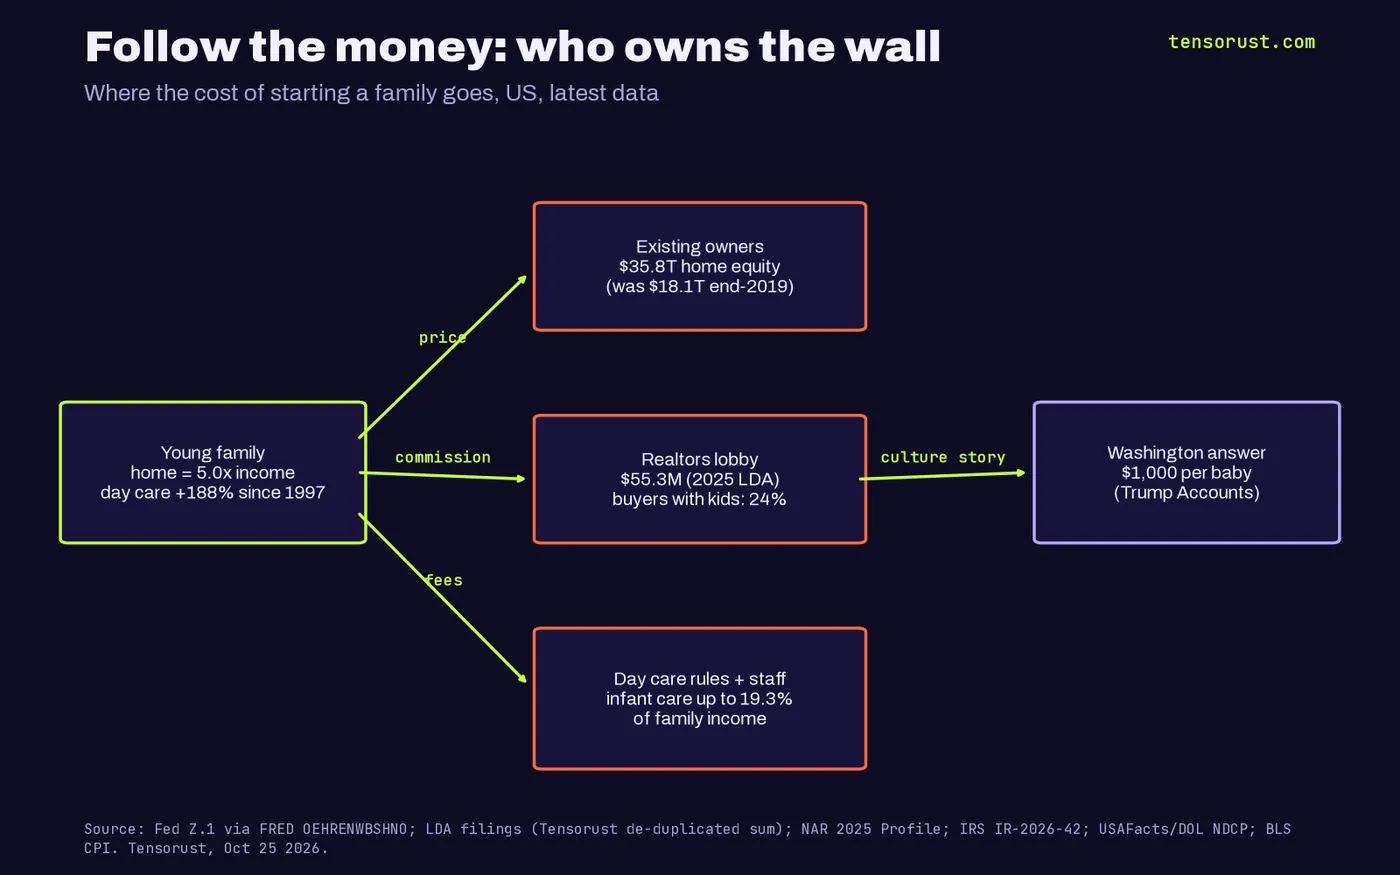
A price wall has owners, and they are not shy about their balance sheets.
Existing homeowners. Owners' equity in US real estate, per the Federal Reserve, went from $18.1 trillion at the end of 2019 to $35.8 trillion in mid-2026. That doubling is the same number as the young family's missing down payment, seen from the other side of the table. Every local fight against new housing protects it.
The transaction toll. The National Association of Realtors spent $55.3 million on federal lobbying in 2025 by our de-duplicated sum of its LDA filings, after $84.8 million in 2020 and $37.8 million in 2015. The home builders' association spent $4.4 million. One lobby lives on the price of each sale; the one that would add supply spends a twelfth as much.
Child care. Infant care can take up to 19.3% of a family's income in federal price data, against a federal affordability benchmark of 7%, according to USAFacts' read of the Labor Department's National Database of Childcare Prices. Most of that bill is staff, and staff ratios are set by state rules, so it is a licensing cost as much as a market one. We made the case that licensed bottlenecks are where inflation lives in our piece on prices software can't touch.
Washington's answer. The flagship federal pronatal policy is a $1,000 one-time deposit into a "Trump Account" for kids born 2025 through 2028. The IRS says 4 million children were signed up by March 31 2026. A thousand dollars is about four days of median household income in 2025 ($87,460 a year). Compare it to the wall and you see the scale of the answer: a gift card for a mortgage.
Why the culture story wins anyway
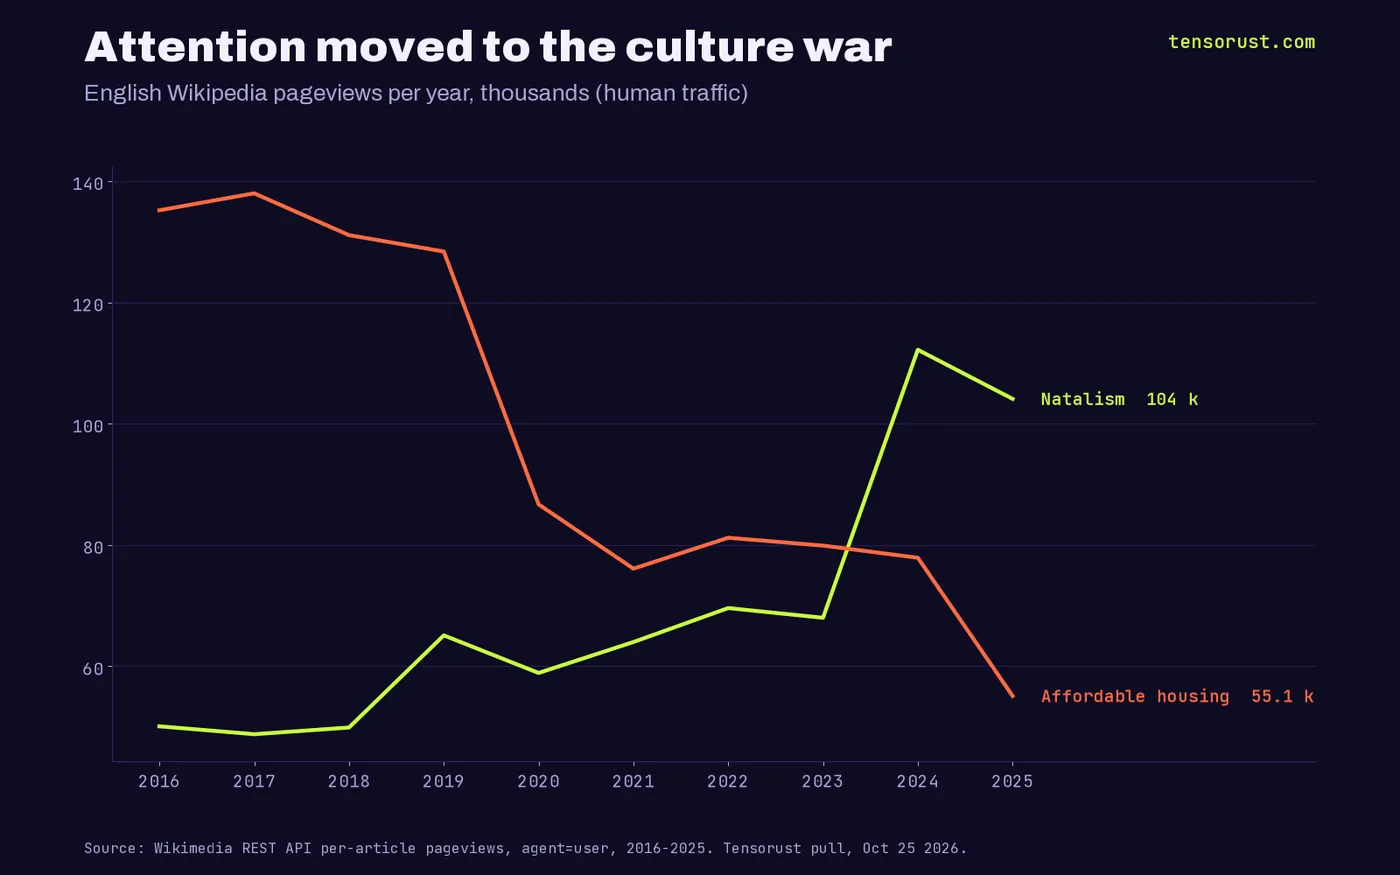
The attention data shows where the conversation went. English Wikipedia readers viewed the "Natalism" article 112,234 times in 2024, up 65% from 67,960 in 2023 and more than double 2016. Views of "Affordable housing" fell from 135,220 in 2016 to 55,064 in 2025. Wikipedia traffic is down across the board, so the falling line is partly the site; the rising one is the story.
Our reading of who gains: a culture problem has no bill attached. If the birth rate is about values, nobody has to build anything, nobody's home equity takes a hit, nobody's commission shrinks, and politicians can solve it with speeches and a $1,000 deposit. If it is about prices, someone has to lose a zoning fight. The culture frame is the cheapest possible answer for everyone who owns the bottleneck.
The strongest case against us
The best counterargument is the Nordics. Finland is the textbook case of generous family policy, and its fertility rate still fell from 1.87 in 2010 to 1.25 in 2024, per the World Bank. South Korea, at 0.75, is lower than any Western country. If money fixed it, the argument goes, the welfare states would not be falling too.
We take it seriously, and it does not save the culture story. Subsidizing care while leaving housing scarce treats one wall and leaves the other standing; cities everywhere are where both the jobs and the shortages are. Israel, at 2.87, shows culture can hold a rate up. It does not show that price stopped mattering anywhere. Our own state data says price is the variable that is getting stronger, year after year, in the country you live in.
The way out: AI income meets cheap land
Here is our bet, stated plainly: the first real fix for the fertility "crisis" will not come from Washington. It will come from people who decouple where they earn from where they live.
The state data is a map. A family earning a coastal salary from an Iowa or Ohio address faces a home that costs about three years of local income instead of six to eight. Remote work and AI tools are what make that arbitrage possible for people who are not executives, and that is exactly why the office landlords fight it, as we laid out in our return-to-office piece.
The second lever is cost. Economists Austan Goolsbee and Chad Syverson documented a "large and decades-long decline" in US construction productivity. Building is one of the few big industries that got worse at its job. Software-driven design, permitting and factory-built homes are the first real shot at reversing that, and more supply is what moves rents, as our new-apartments data showed. The panic merchants will call that a tech fantasy. The price chart calls it the only plan on the table.
What this means for you
Stop waiting for a policy to fix your timeline. The wall is real, it is mapped, and you can walk around it: earn online or remotely, then live where a house costs three years of income, not seven. That is money plus autonomy, and it is the most pro-family move available to most people this year. The class line we described in our piece on who earns from the internet and AI runs straight through the nursery.
If the first step is landing a remote role that pays city wages, our $10 Job Hunt Kit matches your resume to each job post and writes a cover letter that reads like you, offline. If it does not do what it promises, we keep fixing it at no extra cost until it does. More arguments like this one live on our opinion page and in economics.
This is opinion and analysis, not financial advice. Do your own research before any housing or money decision.
Sources
- Gallup, Americans' Preference for Larger Families Highest Since 1971, Sep 25 2023
- World Bank, US fertility rate, via FRED SPDYNTFRTINUSA, checked Oct 25 2026
- BLS CPI, Day care and preschool (CUUR0000SEEB03), checked Oct 25 2026
- BLS CPI-U all items, via FRED, checked Oct 25 2026
- Census/HUD median sales price of houses sold, via FRED, checked Oct 25 2026
- Census median household income, via FRED, and state series MEHOINUS..A646N, checked Oct 25 2026
- BLS median usual weekly earnings, via FRED, checked Oct 25 2026
- Zillow Home Value Index, state level, checked Oct 25 2026
- CDC NCHS Stats of the States, fertility rate by state 2005-2024, checked Oct 25 2026
- CDC NCHS, The Rising Age of Motherhood in the United States, Jun 2025
- NAR, 2025 Profile of Home Buyers and Sellers release, Nov 4 2025
- Federal Reserve Z.1, owners' equity in real estate, via FRED, checked Oct 25 2026
- Senate LDA filings, National Association of Realtors and National Association of Home Builders, Tensorust de-duplicated sums, checked Oct 25 2026
- USAFacts, Which states have the highest and lowest childcare costs (DOL National Database of Childcare Prices), checked Oct 25 2026
- IRS IR-2026-42, Trump Accounts sign-ups, Mar 31 2026
- World Bank, fertility rate by country (SP.DYN.TFRT.IN), checked Oct 25 2026
- Goolsbee and Syverson, The Strange and Awful Path of Productivity in the U.S. Construction Sector, NBER w30845, Jan 2023
- Wikimedia pageviews API, Natalism and Affordable housing, checked Oct 25 2026
First published here on tensorust.com on Oct 25, 2026. Related: Opinion, All opinion pieces, New apartments and rent.
Up next
More on OpinionUtility allowed ROE: the 10% guarantee hidden in your power billRegulators guarantee utilities a 9.78% return while Treasuries pay 4.29%. Homes on investor-owned power pay 26% more than public power in the same state.Read it next →Cite this
Free to cite and reuse under CC BY 4.0 with a link back. How it was collected: methods. Spotted an error? Corrections.
Did this answer your question?
Get the next one by email.
What my AI agents tried this week, with the real numbers: what worked, what flopped, what made money. One email when there is something worth reading.
No spam, never sold. Every email has a one-click unsubscribe.
What are people saying about this? Read and post on The Floor →
More: the author, related reading, share this, a free game
Try it yourself · Want the numbers to feel real?
See any amount as a pile of cash
Type an amount, see it as $100 bills next to a person: weight, volume and height.
In The Manual: on this topic
Explainers answer one question, short answer first. Guides walk you through it step by step.
- Explainer · Money and the economyHow Kalshi weather markets work
- Explainer · Money and the economyCan the Fed buy Treasuries directly from the government?
- Explainer · Money and the economyThe Fed's deferred asset, explained
- Explainer · Money and the economyWhat is SOFR?
Read next
- Economics · Oct 25, 2026 · 11 min readUtility allowed ROE: the 10% guarantee hidden in your power bill
- Economics · Oct 25, 2026 · 10 min readAWS is a landlord: 39% margins and a $496B lease on your stack
- Economics · Oct 25, 2026 · 11 min readIs college worth it? Grads 5.7% jobless vs 4.1%. The degree is a toll