
By Matt Busel, who built the apps, crates and game he writes about · every number links to its source and every dataset is downloadable (methods) · corrections · featured in Kirino, gamebiz, This Week in Rust, New Mobile Life, By-Press
Inflation since 2000: TVs -98%, hospitals +311%. The license is why
On this page · 10 sections
- Key numbers
- There are two inflations, and the average hides both
- The split is not goods versus services. It is code versus credentials
- Follow the license: one in five workers needs the state's permission
- Who pays to keep the wall standing
- The steelman: licenses exist because people died without them
- AI is the first tool that can climb the wall
- The two-speed economy is the new class line
- What this means for you
- Sources
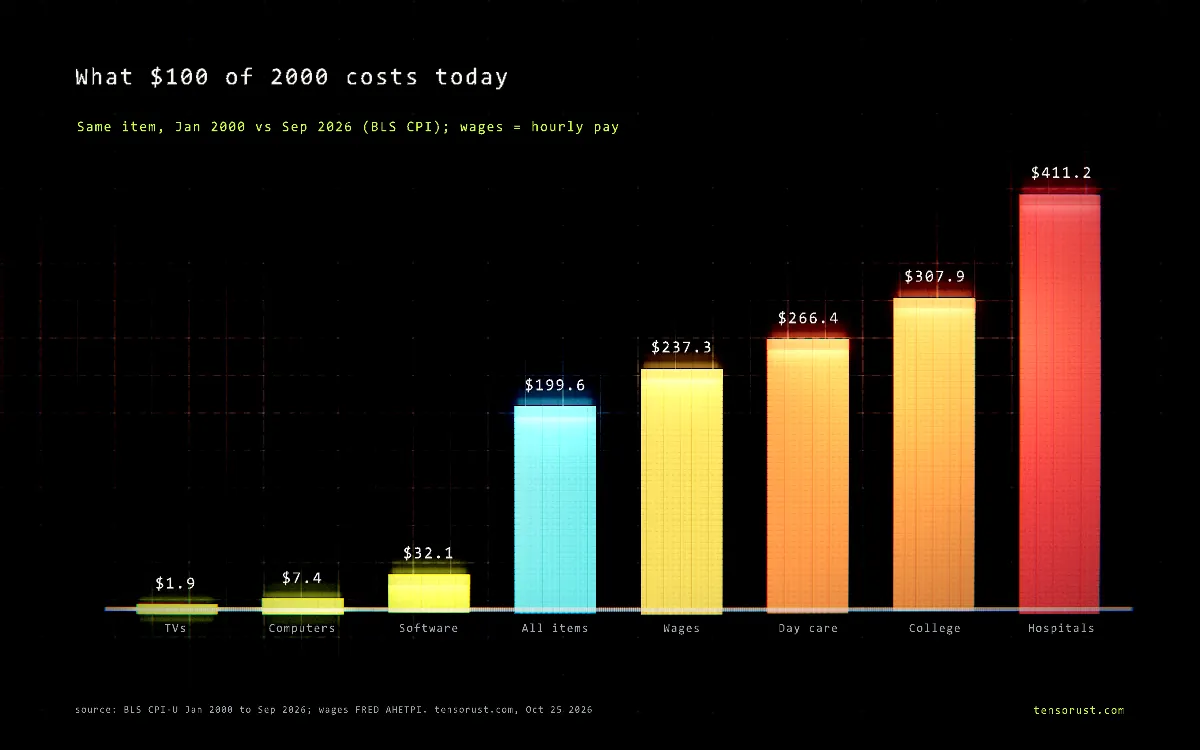
Short answer: Inflation is not one number. Since January 2000, BLS price indexes show televisions down 98.1%, computers down 92.6% and software down 67.9%, while hospital services rose 311.2%, college tuition 207.9% and day care 166.4%. The line between the two groups is not "goods versus services". It is whether software can reach the work, or whether a license, a board and a lobby stand in the way. Inflation is a tax on everything you cannot automate.
TL;DR: Average hourly pay for production workers rose 137.3% since 2000, so anything that rose faster got harder to afford and anything below got easier. 21.6% of employed Americans now need a government license to do their job, and in healthcare practitioner jobs it is 71.3%, against 6.4% in computer and math jobs. The groups that guard the expensive side spent $109.9 million on federal lobbying in 2025 between six of them, while GPT-4-level AI fell from $37.50 to $0.18 per million tokens in under two years. AI's real fight is not with your job. It is with the license wall.
Key numbers
| What | Number | Source, checked Oct 25 2026 |
|---|---|---|
| Televisions, price change Jan 2000 to Sep 2026 | -98.1% | BLS CPI-U, CUUR0000SERA01 |
| Computers, peripherals, smart home assistants | -92.6% | BLS CPI-U, CUUR0000SEEE01 |
| Computer software and accessories | -67.9% | BLS CPI-U, CUUR0000SEEE02 |
| All items (headline CPI) | +99.6% | BLS CPI-U, CUUR0000SA0 |
| Hourly pay, production and nonsupervisory workers | +137.3% ($13.74 to $32.60) | BLS via FRED, AHETPI |
| Hospital services | +311.2% | BLS CPI-U, CUUR0000SEMD01 |
| College tuition and fees | +207.9% | BLS CPI-U, CUUR0000SEEB01 |
| Employed people holding a government license, 2025 | 21.6% | BLS CPS, LNU02094119 |
| Healthcare practitioners holding a license vs computer and math jobs | 71.3% vs 6.4% | BLS CPS, LNU02094064 / LNU02094050 |
| 2025 federal lobbying, six licensed-sector groups (self-reported) | $109.9M | Senate LDA filings |
| GPT-4-level AI price, Mar 2023 vs Feb 2025 | $37.50 to $0.18 per 1M tokens | Epoch AI |

There are two inflations, and the average hides both
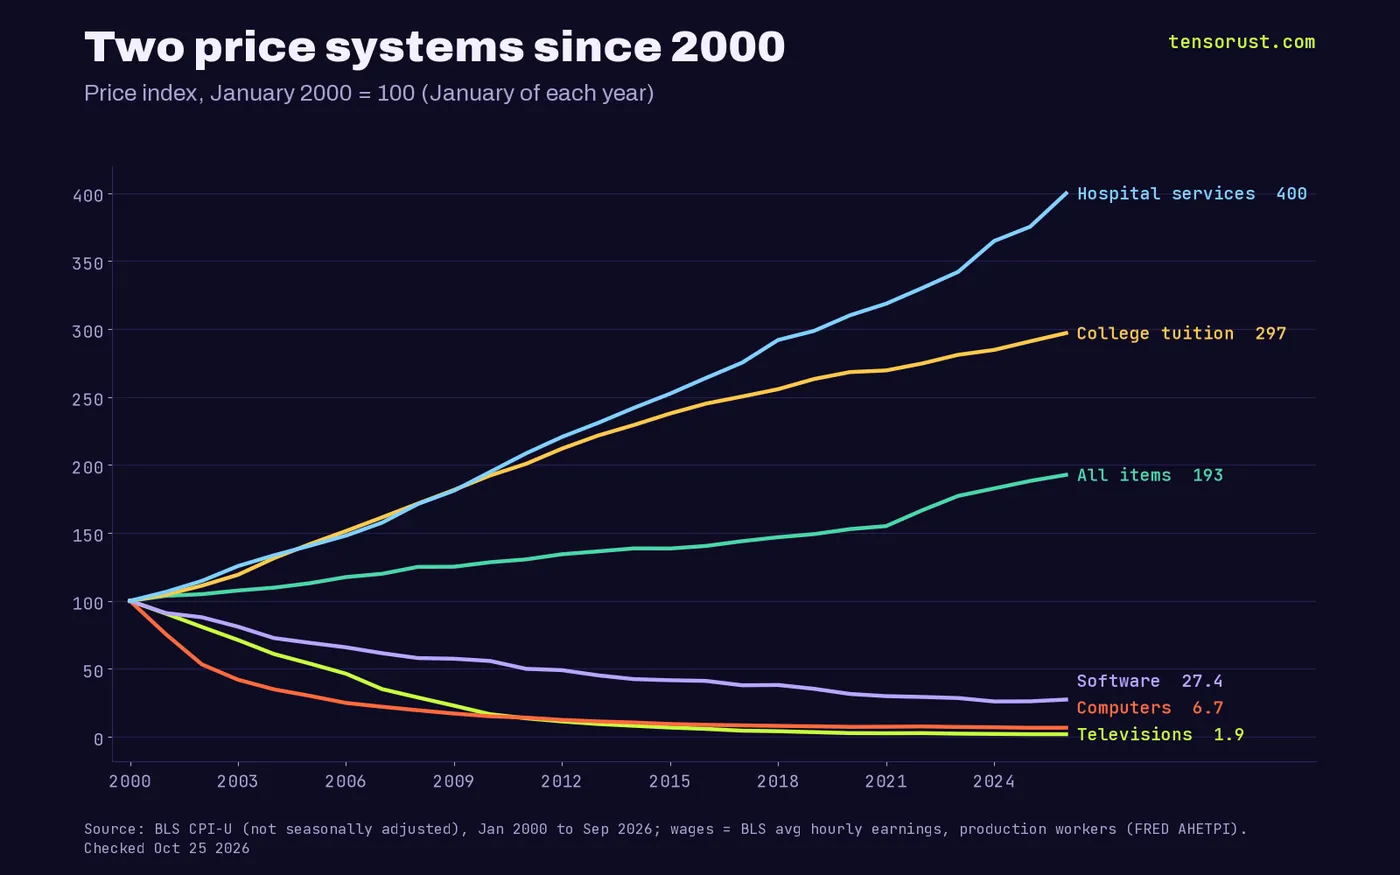
The headline CPI says prices roughly doubled since 2000: up 99.6% through September 2026. That number is true and useless. Nobody buys "all items". You buy specific things, and the specific things split into two camps that moved in opposite directions for 26 years straight.
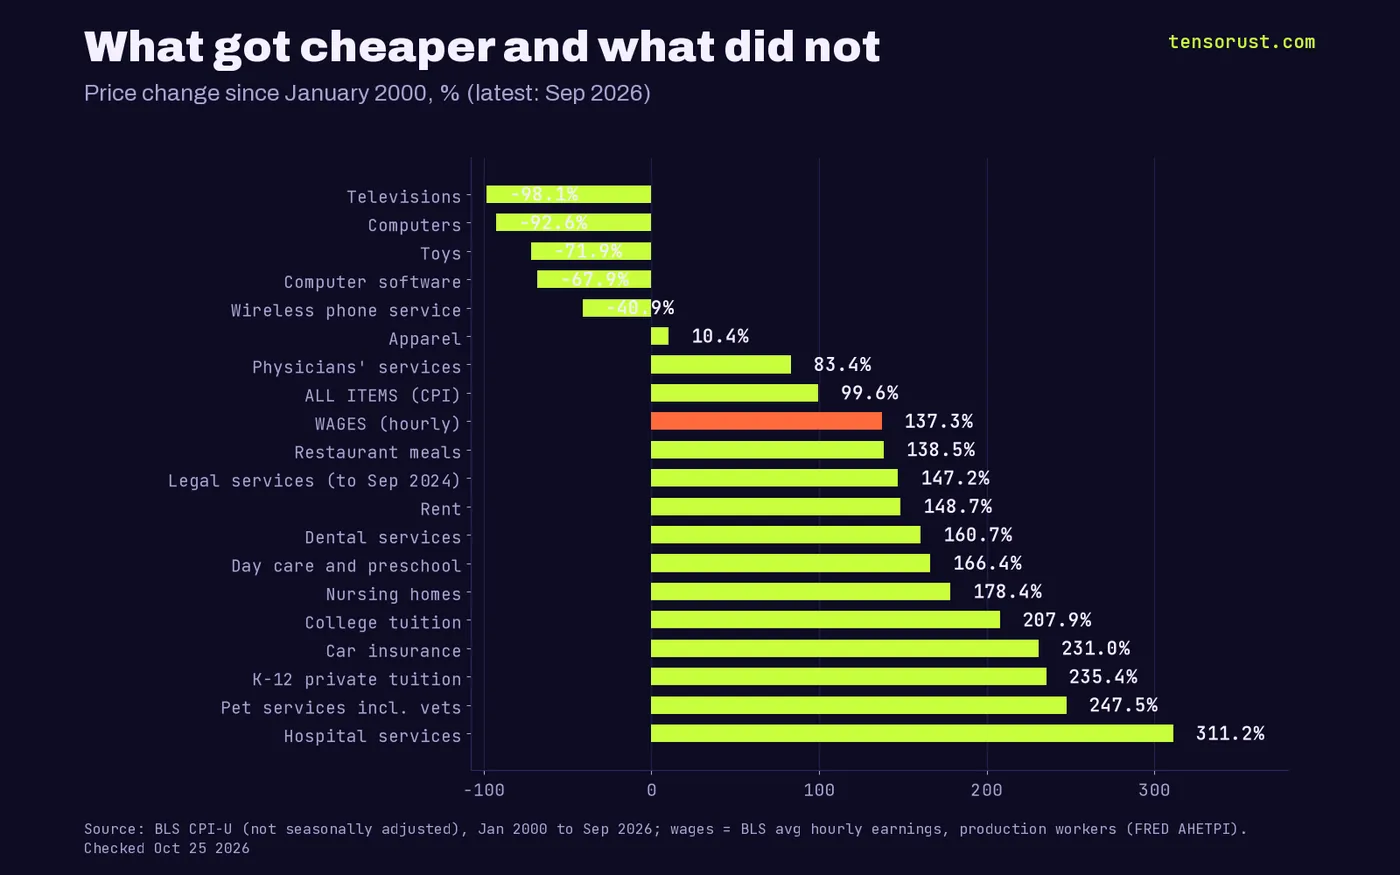
Camp one got cheaper in raw dollars, not just after inflation. Televisions: down 98.1%. Computers: down 92.6%. Toys: down 71.9%. Software: down 67.9%. Wireless phone service: down 40.9%. These are not quality-adjustment tricks on a single year. They are a quarter century of falling prices in the official BLS series.
Camp two went the other way. Hospital services: up 311.2%. Pet services including vets: up 247.5%. Private K-12 tuition: up 235.4%. College tuition: up 207.9%. Nursing homes: up 178.4%. Day care: up 166.4%. Dental care: up 160.7%. Rent: up 148.7%.
Put wages in the middle and the picture sharpens. Hourly pay for production and nonsupervisory workers rose 137.3%, from $13.74 to $32.60. Everything below that line got easier to afford. Everything above it got harder. A TV now costs less than 1% of the hours of work it took in 2000. A hospital stay costs about 1.7 times the hours.
The split is not goods versus services. It is code versus credentials
The textbook explanation is Baumol's cost disease, first described by William Baumol and William Bowen in the 1960s: some jobs cannot get more productive (a string quartet still needs four players), so their prices rise as wages rise elsewhere. Mark Perry at AEI turned the same split into his famous "chart of the century". Both are right about the pattern. Both stop short of the uncomfortable part.
Look at which services are on the expensive side. Restaurant meals rose 138.5%, almost exactly with wages. Apparel rose 10.4%. Those are labor-heavy too, but nobody needs a license to cook or to sell you a shirt. The prices that ran far ahead of pay are the ones where the state decides who is allowed to do the work, how many seats a school can have, how many beds a hospital can add and which software is allowed to touch the job.
Our reading: Baumol explains why the stagnant sector drifts up with wages. It does not explain why hospitals ran 174 points ahead of wages while restaurants ran even. A permission slip does. When you cannot add supply without a board's sign-off, prices are set by the board's pace, not by the market's.
Follow the license: one in five workers needs the state's permission
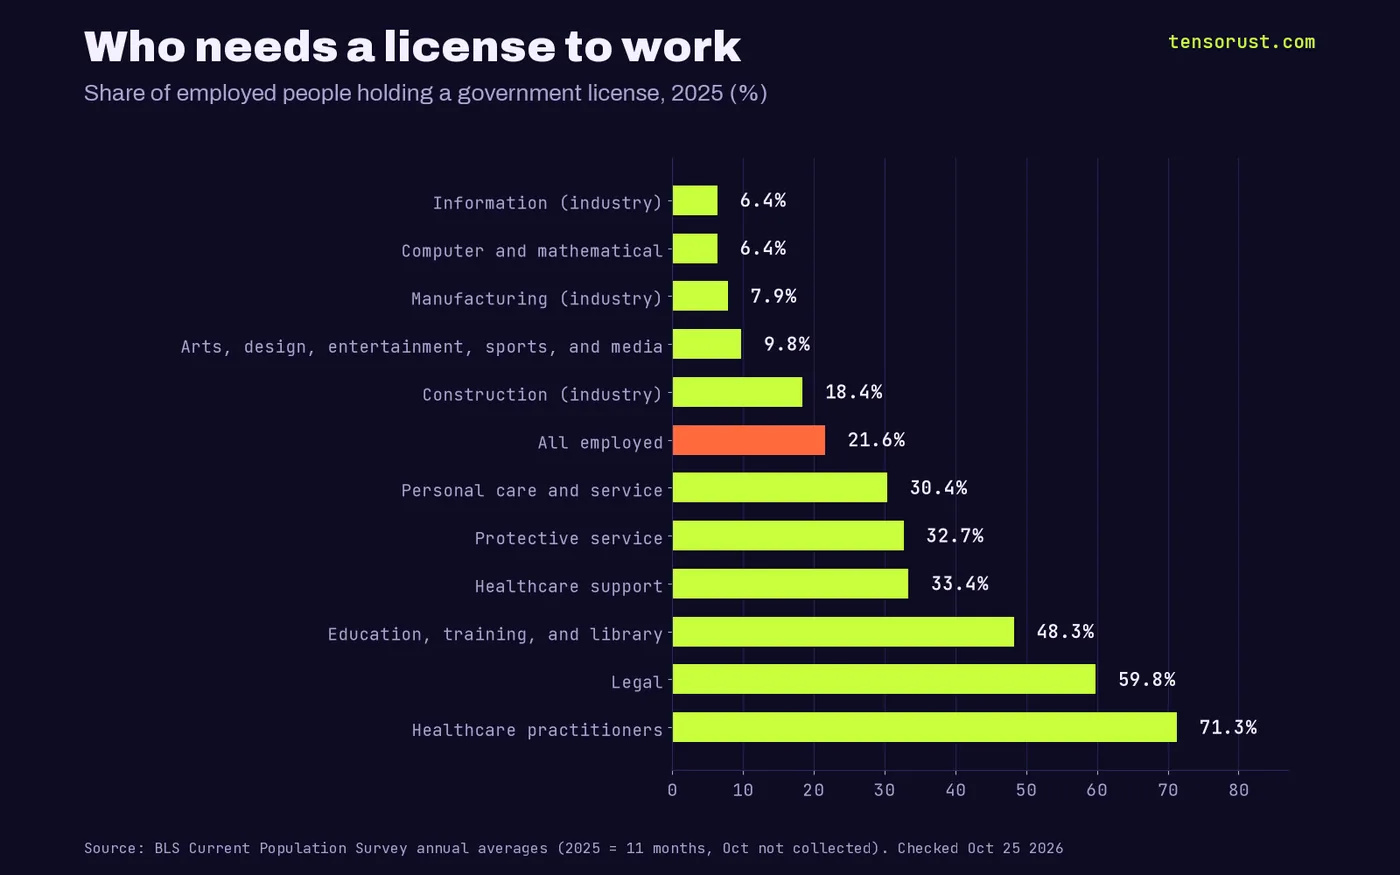
In 2025, 21.6% of employed Americans held a government-issued license to do their job, per the BLS Current Population Survey. Wikipedia's summary of the research puts the share near 5% in 1950. The license went from a rare gate to a routine one inside a single lifetime.
Now line the licensed share up against the price chart. Healthcare practitioners: 71.3% licensed. Legal occupations: 59.8%. Education, training and library jobs: 48.3%. Those are the sectors with the steepest price lines. Computer and math jobs: 6.4% licensed. The Information industry: 6.4%. Manufacturing: 7.9%. Those are the sectors that delivered the deflation.
That is not a coincidence we have proven with a regression. It is a pattern the data hands you, and we are betting on it. The sectors where anyone with a laptop can compete got cheaper every year. The sectors where you need a board's blessing to compete got more expensive every year. One study cited in the same Wikipedia entry estimates licensing costs 2.8 million jobs and $203 billion a year.
Who pays to keep the wall standing
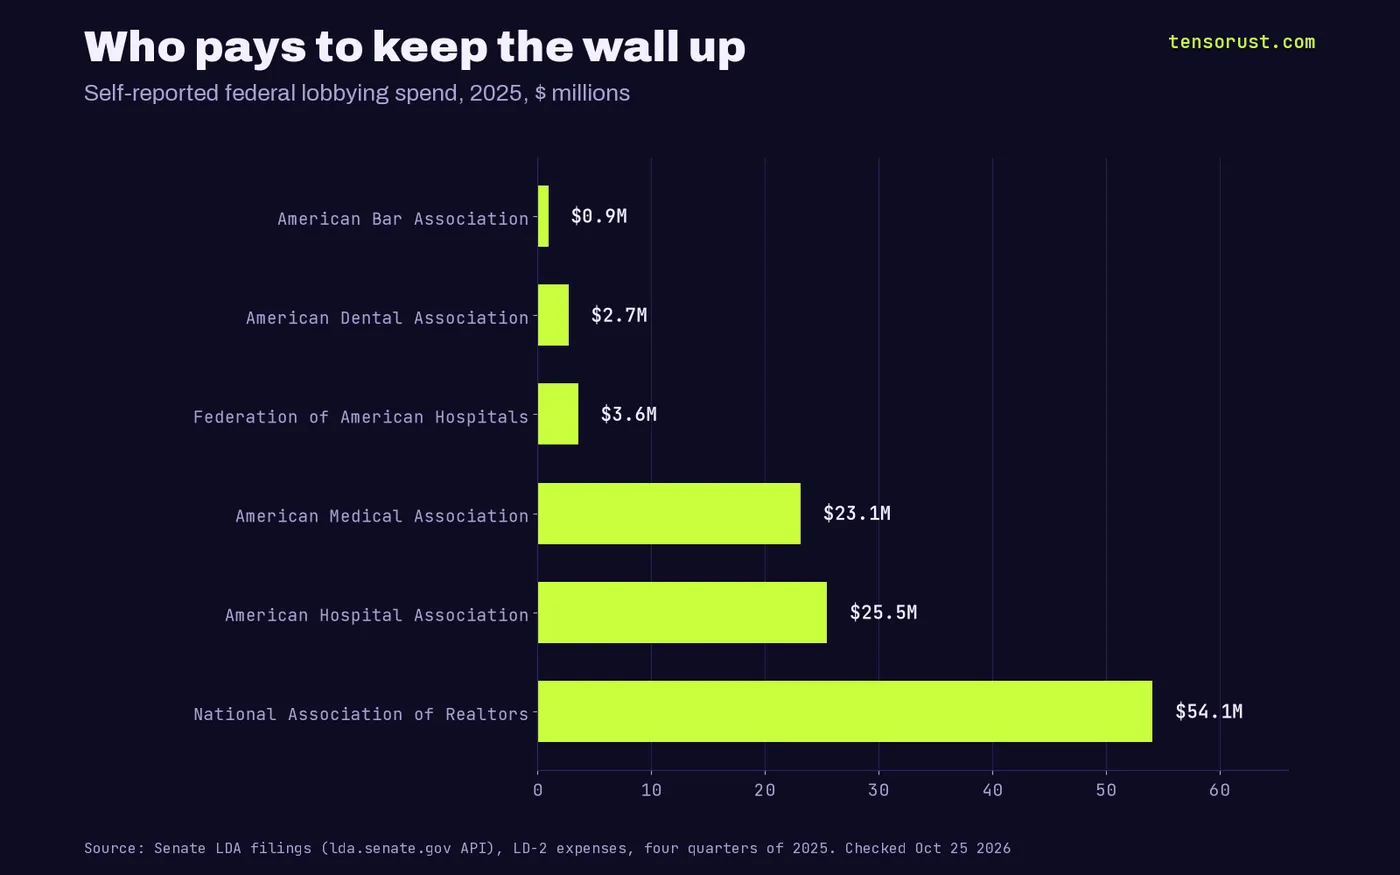
If the wall is worth money, someone will pay to keep it up. They do, and it is on the public record. We pulled every 2025 Lobbying Disclosure Act report where these groups filed for themselves, one per quarter.
- National Association of Realtors: $54.1 million.
- American Hospital Association: $25.5 million.
- American Medical Association: $23.1 million.
- Federation of American Hospitals: $3.6 million.
- American Dental Association: $2.7 million.
- American Bar Association: $0.9 million.
That is $109.9 million in a single year, before the outside firms they also hired, and before a dollar of state-level lobbying, where most licensing rules actually get written. Notice who sits on top: the realtors, guarding a commission system on the most expensive purchase most families ever make, and the hospitals, guarding the line that rose 311%.
None of that is illegal. It is how the game works. But when a hospital association spends $25.5 million in a year telling Washington what it needs, believe it when the price chart says the rules are working for it.
The steelman: licenses exist because people died without them
The best case for the wall is real. You do want the person cutting into you to have been checked by someone. Malpractice, fraud and bad advice cost lives and savings, and a license is a cheap signal for a buyer who cannot judge a surgeon or a lawyer on their own. Hospitals also carry costs no TV maker does: emergency rooms that must treat everyone, 24-hour staffing and equipment that sits idle.
All true. Here is the problem: none of it requires the price to rise faster than wages for 26 years. Safety is a floor, not a growth rate. Physicians' services, the part of the bill that pays the actual licensed doctor, rose 83.4%, below headline CPI. The money did not flow to the person with the license. It flowed to the institutions that control the bottleneck around them: the hospital, the school, the brokerage. The license is the excuse. The scarcity is the product.
AI is the first tool that can climb the wall
Here is the twist nobody in the AI-jobs panic wants to say out loud. The thing AI is best at (reading, writing, checking, explaining, diagnosing from text and images) is exactly the work hiding behind the license wall. And its price is collapsing at a speed nothing on the expensive side of the chart has ever seen.
Epoch AI tracks the cheapest model that matches GPT-4 on the MMLU knowledge test. In March 2023 that cost $37.50 per million tokens. By February 2025 it was $0.18. That is a 99.5% drop in under two years. The same Epoch analysis finds prices to reach a fixed performance level falling between 9x and 900x per year depending on the task.
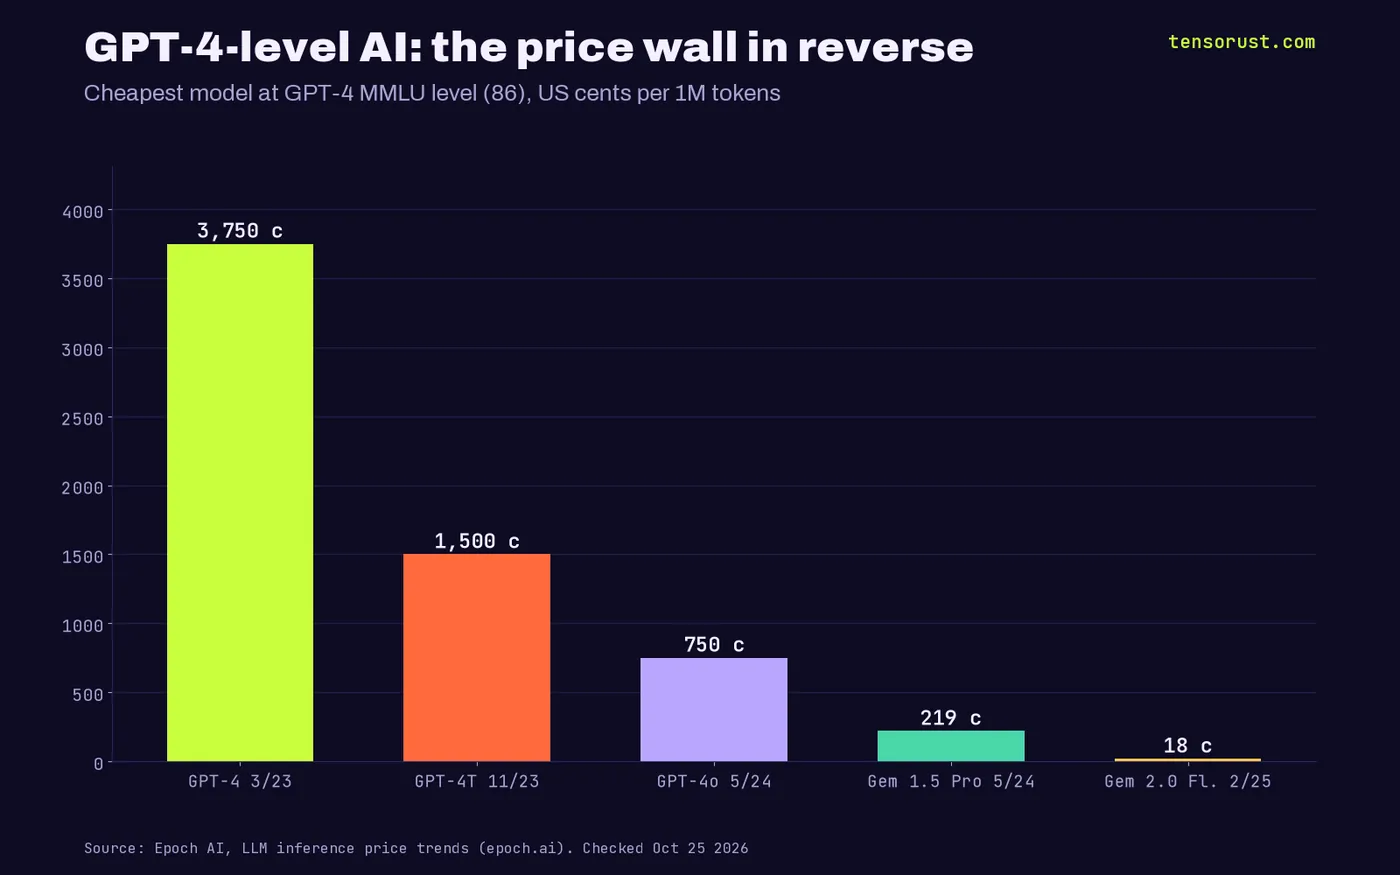
Put that next to hospital services at +311%. One side of the economy just got a tool whose price falls by an order of magnitude a year. The other side has a $109.9 million annual lobbying budget and a legal monopoly on who may practice. That is the real fight of the next decade, and it explains a lot of the panic.
Ask who gains from "AI is dangerous" in medicine, law and education specifically. The answer is whoever charges for the scarce human hour in those fields. The AI rule fights already running in state capitals (who may give medical or legal guidance, what counts as practicing without a license) are the license wall, rebuilt for software. Our bet: the loudest safety campaigns in the licensed professions will track the price of the bottleneck they protect, not the injury data.
The two-speed economy is the new class line
Money and autonomy follow from this. If you earn in the deflating world (code, content, software, AI-built products) your costs for tools fall every year while you sell into a market anyone can join. If your budget sits in the inflating world (care, housing, tuition) you pay the toll every month and the toll goes up faster than your pay.
That is why we argued in the new class divide that the line now runs between people who earn with the internet and AI and people who do not. It is why AI can feel like nothing changed while its price falls 99%. And it is why the utility bill story is the same story: another regulated bottleneck using a new technology as its excuse.
What this means for you
Three moves. First, stop reading the CPI headline as your inflation. Your real rate is your own basket: if most of your spending sits in care, housing and tuition, your inflation has run well above 99.6% since 2000, and you should plan for it to keep doing that.
Second, move your income toward the deflating side. Build or sell something software can scale, because that market rewards anyone who ships, and its tools get cheaper every year. Track those tools on our LLM price list.
Third, use AI on the expensive side of your own life right now: read your hospital bill line by line, check the lease, draft the dispute letter, compare tuition offers. Every hour you do not have to buy from a bottleneck is money kept.
If you want to build on the cheap side, our $29 AI Builder Kit is five offline apps that keep your AI building what you meant, on any model, including a local one. If it does not get your AI building what you meant, we keep working with you at no extra cost until it does.
More from the same lens on Tensorust Opinion and Economics. The full dataset, every CPI series, the licensing shares and the lobbying totals, is in the download below. This is not financial advice.
Sources
- U.S. Bureau of Labor Statistics, CPI-U flat files (cu.data.0.Current), U.S. city average, not seasonally adjusted, checked Oct 25 2026
- U.S. Bureau of Labor Statistics, Current Population Survey, certification and licensing series (ln.data.1.AllData), 2025 annual averages cover 11 months (October 2025 not collected during the shutdown), checked Oct 25 2026
- FRED, Average Hourly Earnings of Production and Nonsupervisory Employees (AHETPI), checked Oct 25 2026
- U.S. Senate, Lobbying Disclosure Act filings API, 2025 LD-2 reports filed by each group for itself, checked Oct 25 2026
- Epoch AI, LLM inference price trends, checked Oct 25 2026
- Wikipedia, Baumol effect, checked Oct 25 2026
- Wikipedia, Occupational licensing (licensed share 1950 and the 2.8 million jobs estimate, with its cited studies), checked Oct 25 2026
- Mark Perry, AEI, "Chart of the Day . . . or Century?", checked Oct 25 2026
First published here on tensorust.com on Oct 25, 2026. Related: Opinion, LLM price list, Economics, The new class divide.
Up next
More on OpinionReturn to office is a landlord bailout: office loans 12.2% delinquentWork from home barely moved after the mandates: 27.6% to 26.8%. Office CMBS delinquency hit 12.16%. Return to office protects landlords, not output.Read it next →Cite this
Free to cite and reuse under CC BY 4.0 with a link back. How it was collected: methods. Spotted an error? Corrections.
Did this answer your question?
Get the next one by email.
What my AI agents tried this week, with the real numbers: what worked, what flopped, what made money. One email when there is something worth reading.
No spam, never sold. Every email has a one-click unsubscribe.
What are people saying about this? Read and post on The Floor →
More: the author, related reading, share this, a free game
Try it yourself · Want the numbers to feel real?
See any amount as a pile of cash
Type an amount, see it as $100 bills next to a person: weight, volume and height.
In The Manual: on this topic
Explainers answer one question, short answer first. Guides walk you through it step by step.
- Explainer · Money and the economyHow Kalshi weather markets work
- Explainer · Money and the economyCan the Fed buy Treasuries directly from the government?
- Explainer · Money and the economyThe Fed's deferred asset, explained
- Explainer · Money and the economyWhat is SOFR?
Read next
- Economics · Oct 25, 2026 · 12 min readReturn to office is a landlord bailout: office loans 12.2% delinquent
- Economics · Oct 25, 2026 · 10 min readAI data centers aren't why your power bill is up. Utilities are
- AI · Oct 25, 2026 · 14 min readThe new class divide: 3 tiers, and 3 in 4 workers sit out the AI one