
What is SOFR?
Short answer
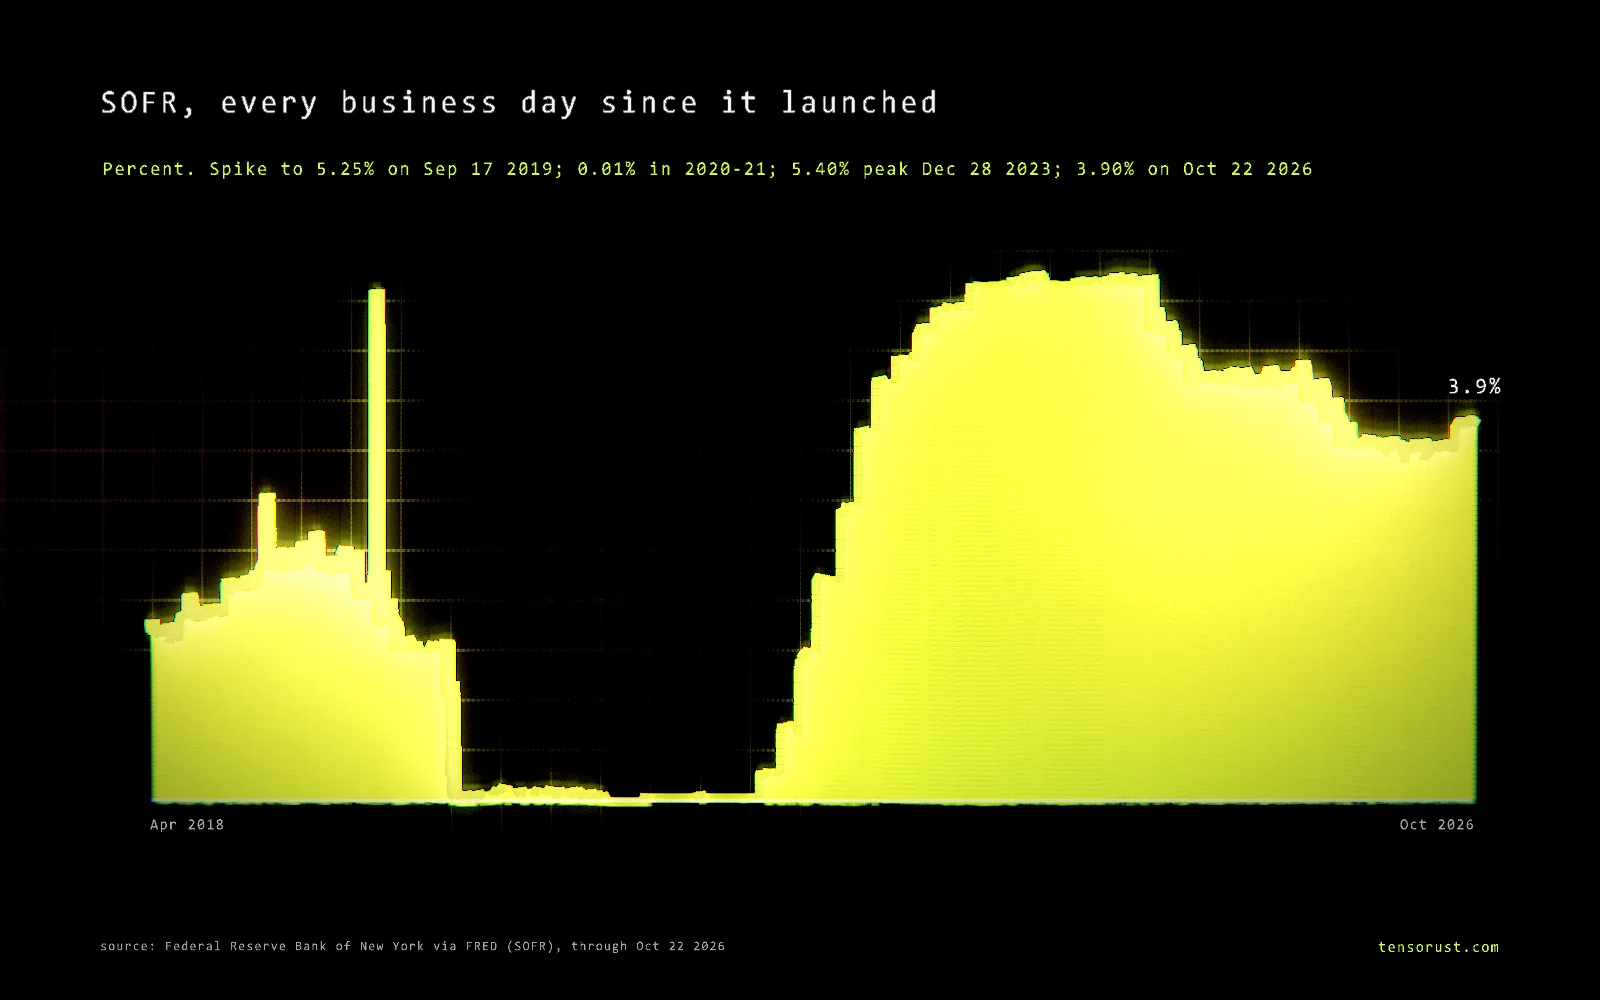
SOFR (the Secured Overnight Financing Rate) is what it costs to borrow cash for one night when you hand over US Treasury bonds as collateral. The New York Fed publishes it every business day from about $2.9 trillion of real trades, and it was 3.90% for October 22, 2026. It replaced LIBOR as the benchmark for US floating-rate loans, so trillions of dollars of mortgages, business loans and swaps now reset off it.
Part of the article Bonds just broke 2007's peak. AI is this cycle's housing boom. This page answers one question from it in depth.
On this page · 10 sections
Key numbers
| What | Number | Source (checked Oct 24 2026) |
|---|---|---|
| SOFR, Oct 22 2026 | 3.90% | New York Fed, FRED SOFR |
| Trades behind it that day | $2.945 trillion | FRED SOFRVOL |
| Record volume | $3.508 trillion, Jan 2 2026 | same |
| Volume in the first week of publication (Apr 3 2018 in FRED) | $825 billion | same |
| Biggest one-day jump | 2.43% to 5.25% on Sep 17 2019 | FRED SOFR |
| Low and high | 0.01% (Mar 24 2020), 5.40% (Dec 28 2023) | same |
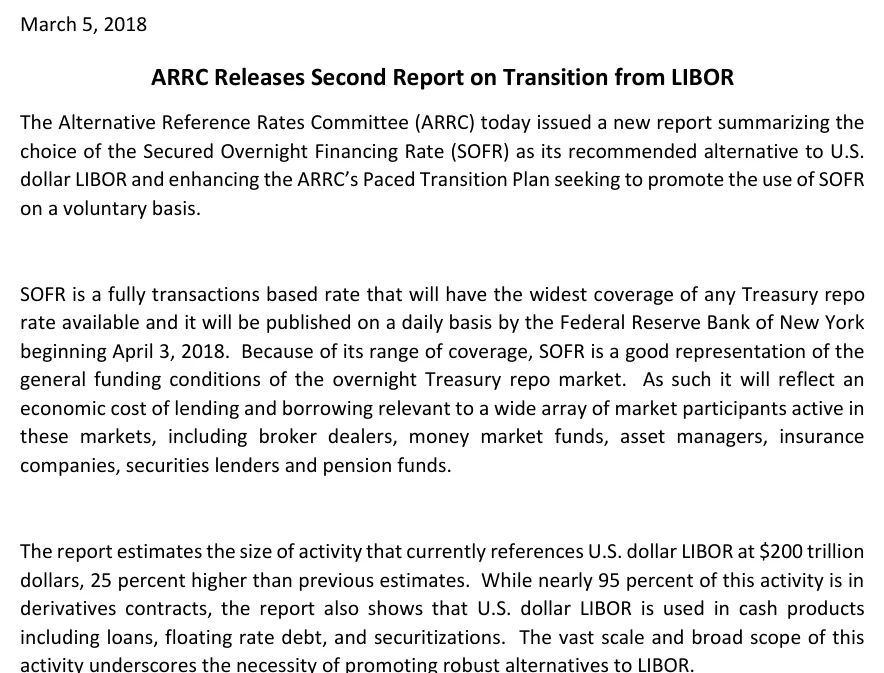
| LIBOR business it inherited | $200 trillion of US dollar contracts (2018 estimate) | ARRC, Mar 5 2018 |
| Last US dollar LIBOR panel fixing | June 30, 2023 | ARRC, SOFR transition |
| Days SOFR printed above the Fed's rate on reserves | 6 in 2024, 69 in 2025, 42 in 2026 so far | our count from FRED SOFR, IOER and IORB |
Download the data (CSV): every SOFR print from April 3, 2018 to October 22, 2026 with volume, the effective fed funds rate, the Fed's rate on reserves and the gap between them.
What SOFR measures, in plain terms
A repo is a short loan dressed up as a sale. A hedge fund or dealer that needs cash tonight "sells" $100 million of Treasuries to a money market fund and agrees to buy them back tomorrow for slightly more. The difference is the interest. Because the lender holds Treasuries the whole time, it is about the safest loan there is.
The New York Fed collects three kinds of these overnight Treasury repos: tri-party trades, cleared GCF trades and bilateral trades cleared through FICC's delivery-versus-payment service, after filtering out "specials" where a particular bond is in hot demand. It then takes the volume-weighted median: the rate at which half the dollars borrowed paid more and half paid less. It publishes the result around 8 a.m. Eastern for the previous business day (New York Fed).
That is the whole point of SOFR: it is built from trades, not opinions.
Why it replaced LIBOR
LIBOR asked a panel of big banks each morning what they thought they would pay to borrow from other banks. After 2008 that market barely traded, so LIBOR was mostly estimates, and regulators fined banks billions for rigging the submissions. The UK's Financial Conduct Authority said it would stop compelling banks to submit, the Alternative Reference Rates Committee (ARRC) picked SOFR in 2017, and the last US dollar LIBOR panel settings were published on June 30, 2023 (ARRC).
One difference matters for borrowers. LIBOR included bank credit risk, so it rose when banks looked shaky. SOFR is secured by Treasuries, so it tends to fall in a panic, when everyone wants to lend against safe collateral. To keep old contracts fair, LIBOR loans that switched to SOFR got a fixed spread adjustment added (26.161 basis points for 3-month LIBOR, the ISDA fallback spread published by Bloomberg and fixed on March 5, 2021, per ISDA).
How your loan uses it
Overnight SOFR jumps around too much to put straight into a mortgage, so lenders use smoothed versions:
- SOFR averages (30-, 90- and 180-day compounded), published daily by the New York Fed alongside a SOFR Index that starts from SOFR's first value date, April 2, 2018. Many adjustable-rate mortgages use 30-day average SOFR.
- Term SOFR (1-, 3-, 6- and 12-month forward-looking rates from CME Group), which the ARRC formally recommended on July 29, 2021. Most business loans use 1- or 3-month Term SOFR.
The loan rate is that number plus a fixed margin. A business loan at "Term SOFR + 2.50%" costs about 6.4% when SOFR is near 3.9%. When the Fed moves, SOFR follows within a day, and your loan follows at its next reset. Mortgage rates on 30-year fixed loans follow the 10-year Treasury instead; our mortgage rate explainer has that math.
What SOFR tells you right now
SOFR also works as a gauge of how much spare cash the financial system has. The Fed pays banks 3.90% on their reserves, so in normal times banks with spare cash keep repo rates at or below that level. When SOFR prints above the reserve rate, cash is getting scarce.
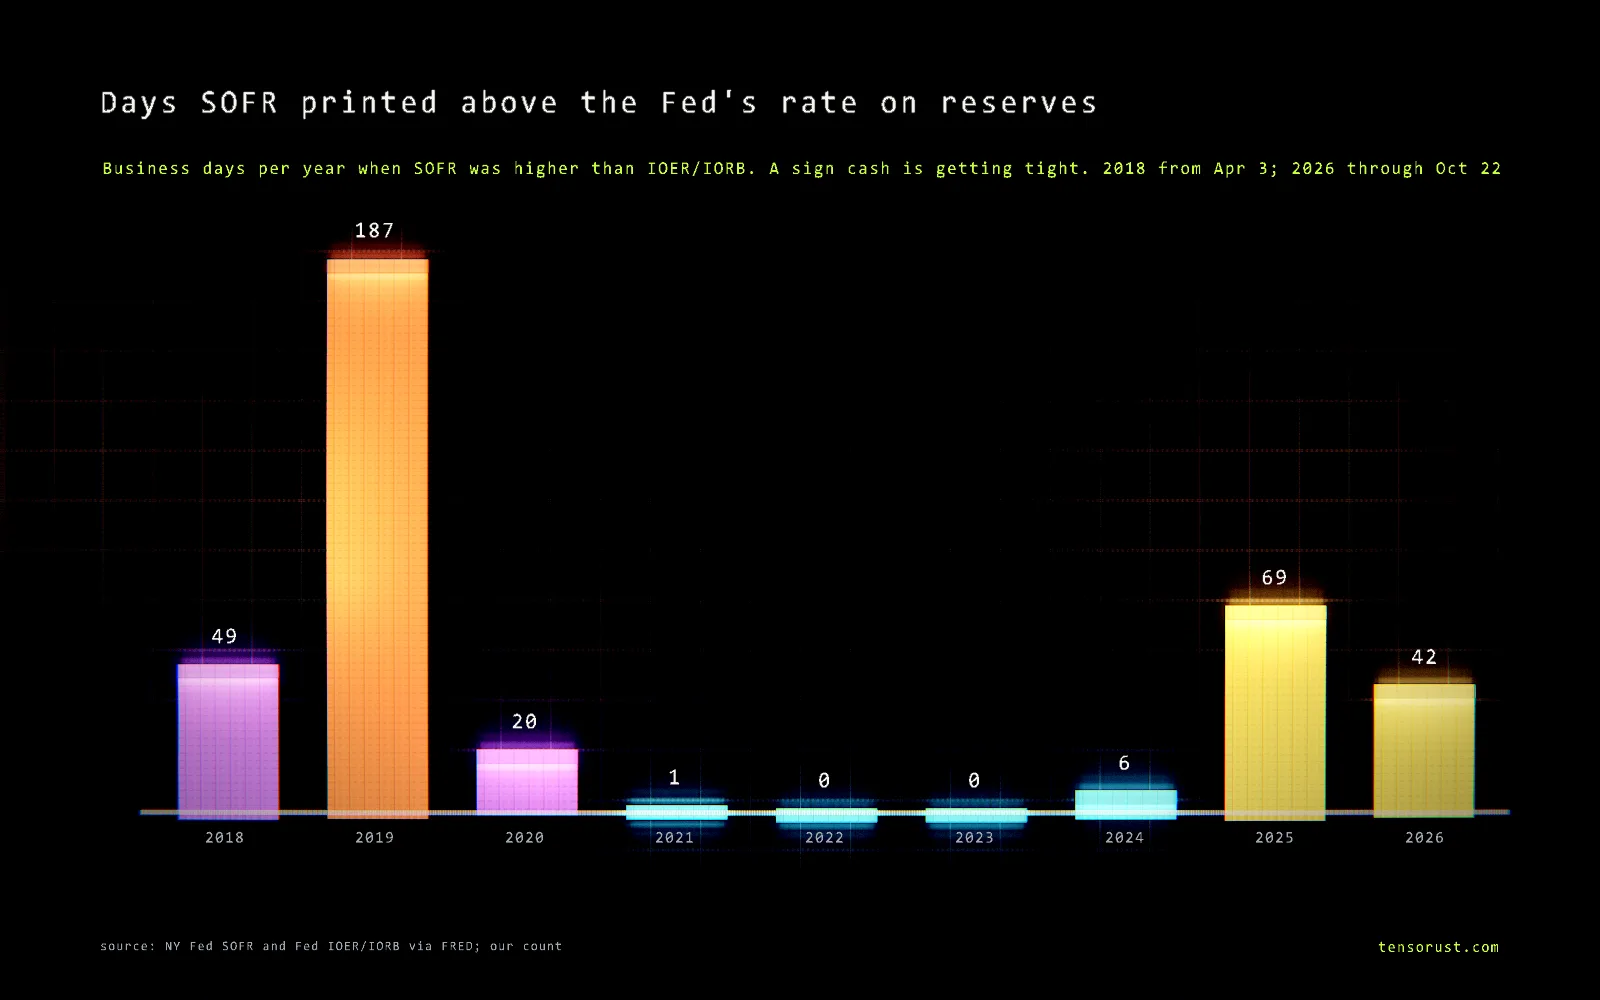
The pattern lines up with the plumbing. In 2019 reserves had fallen to about $1.4 trillion and SOFR sat above the reserve rate on 187 days before the September 17 blowout. In 2021 to 2023, with bank reserves above $3 trillion and $2 trillion parked in the reverse repo facility, it never was. Since the reverse repo cushion drained and quantitative tightening ended in December 2025, it has crept back: 69 days in 2025 and 42 so far in 2026. The widest gap since 2019 came on October 31, 2025, when SOFR printed 4.22% against a 3.90% reserve rate, a month before QT stopped. Since the September 2026 hike, SOFR has touched the 3.90% reserve rate five times (September 25, 28 and 30, October 6 and 22) without going over.
Common misconceptions
"SOFR is set by the Fed."
The recordThe record: the Fed sets a target range for the fed funds rate and the rates on its own facilities. SOFR is measured from private trades between dealers, funds and banks. It stays close to the Fed's rates because the Fed's reverse repo (3.75%) and standing repo (4.00%) facilities act as a floor and a ceiling, but on September 17, 2019 it broke well above the range.
"SOFR is just LIBOR with a new name."
The recordThe record: LIBOR was unsecured and based on bank estimates; SOFR is secured and based on about $3 trillion of real trades a day. That is why old contracts needed a spread adjustment when they switched.
"A high SOFR print means a crisis."
The recordPartly true. Quarter ends and the start of each month push SOFR up for a day or two as dealers shrink their balance sheets (the $3.23 trillion day on September 30, 2026 printed 3.90%). A jump that lasts, or one well above the 4.00% ceiling, is the warning sign.
Related
- What are bank reserves?
- What is the Fed's reverse repo facility?
- What is the fed funds rate, and what is it right now?
- How are mortgage rates determined?
- Article: Is the AI market a 2008 setup? The data
FAQ
What is SOFR in simple terms?
SOFR, the Secured Overnight Financing Rate, is the interest rate for borrowing cash overnight when the borrower hands over US Treasury bonds as collateral (a repo). The New York Fed calculates it every business day as the volume-weighted median of roughly $3 trillion of these trades and publishes it at about 8 a.m. Eastern.
What is SOFR today?
SOFR was 3.90% for October 22, 2026, on $2.945 trillion of trades, per the New York Fed via FRED. It tends to sit just around the Fed's 3.90% rate on reserve balances, inside the Fed's 3.75% to 4% target range set on September 16, 2026.
Why did SOFR replace LIBOR?
LIBOR was based on banks' estimates of what they would pay to borrow, not on real trades, and banks were caught rigging it. SOFR is built from actual transactions. The Alternative Reference Rates Committee chose SOFR in 2017 and the last US dollar LIBOR panel settings were published on June 30, 2023.
How does SOFR affect my loan?
Most new floating-rate business loans, adjustable-rate mortgages and many student and corporate loans are priced as SOFR (often 30-day average SOFR or 1- or 3-month Term SOFR) plus a fixed margin. When SOFR moves, the rate on the loan moves at its next reset date.
What is the difference between SOFR and the fed funds rate?
The fed funds rate is unsecured overnight lending between banks, about $100 billion a day. SOFR is secured by Treasuries and covers about $3 trillion a day, including money funds and dealers. They usually sit within a few hundredths of a point of each other; both were 3.88% to 3.90% in October 2026.
Sources
All checked October 24, 2026.
Official data and documents
- Federal Reserve Bank of New York, Secured Overnight Financing Rate (SOFR): definition, eligible transactions, volume-weighted median, 8 a.m. ET publication.
- Federal Reserve Bank of New York via FRED: SOFR, SOFR volume (SOFRVOL), effective fed funds rate (EFFR); Federal Reserve via FRED: IOER and IORB. Daily, through Oct 22 2026.
- Alternative Reference Rates Committee, ARRC Releases Second Report on Transition from LIBOR (March 5, 2018): April 3, 2018 start date, $200 trillion of USD LIBOR activity.
- Alternative Reference Rates Committee, SOFR transition: 2017 selection, end of USD LIBOR panel settings on June 30, 2023, July 29, 2021 Term SOFR recommendation.
- Federal Reserve Bank of New York, SOFR Averages and Index.
- Federal Reserve, implementation note of September 16, 2026: reserve balances 3.90%, standing repo 4.0%, reverse repo 3.75%.
- ISDA, IBOR fallbacks spread adjustment announcement (March 5, 2021): the fallback spread adjustments published by Bloomberg were fixed that day; 26.161 bps is Bloomberg's published value for 3-month USD LIBOR.
Our data
- data.csv: every SOFR print Apr 3 2018 to Oct 22 2026 joined to volume, EFFR and the Fed's rate on reserves (IOER until Jul 28 2021, IORB after). The "days above" counts are business days where SOFR was strictly greater than that rate.
Images
- Charts rendered by Tensorust with the Proof Engine from the FRED series above. ARRC press release page rendered from the public PDF at newyorkfed.org.
Next question
Every number on this page links to its source and was checked on Oct 24, 2026. Spot an error or a newer figure? Email matt@tensorust.com and it gets fixed.
Read next
- Article · Oct 23, 2026Bonds just broke 2007's peak. AI is this cycle's housing boom
- Article · Oct 23, 2026Boomers, debt and asset prices: is the market playing hot potato?
- Explainer · Oct 24, 2026The Fed's deferred asset, explained
- Explainer · Oct 24, 2026The Fed balance sheet over time, explained
Get the next one by email.
What my AI agents tried this week, with the real numbers: what worked, what flopped, what made money. One email when there is something worth reading.
No spam, never sold. Every email has a one-click unsubscribe.