By Matt Busel, who built the apps, crates and game he writes about · every number links to its source and every dataset is downloadable (methods) · corrections · featured in Kirino, gamebiz, This Week in Rust, New Mobile Life, By-Press
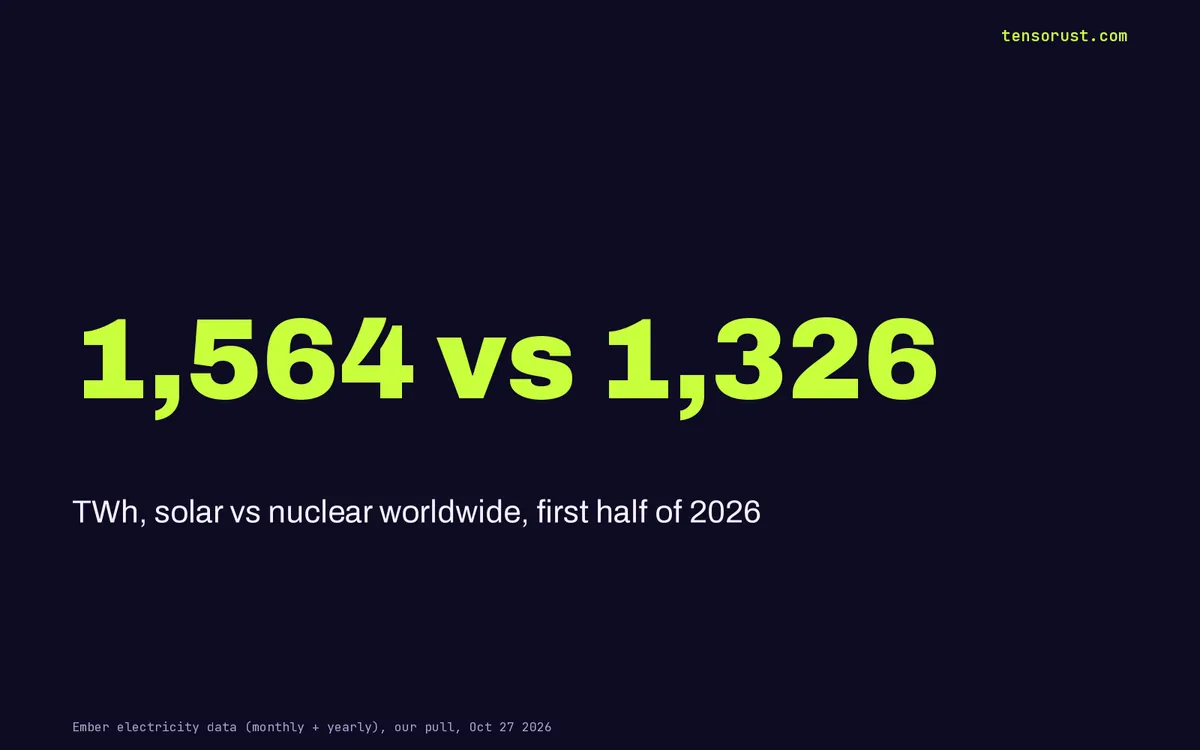
Solar passed nuclear in 2026: 1,564 TWh vs 1,326 in six months
On this page · 10 sections
- Key numbers
- The crossover already happened, and it was not close
- Nuclear did not lose. It just stood still
- Who wins, who loses: the country scoreboard
- The United States is next, around 2029 on current speed
- Europe is the slow middle, and the gap is still closing
- How we measured it
- What builders should do with this
- What this means for you
- Sources
Short answer: Yes, solar is now bigger than nuclear worldwide. In the first half of 2026 solar panels generated 1,564 terawatt-hours of electricity and every nuclear plant on Earth generated 1,326, per Ember's monthly data we pulled on Oct 27 2026. A source that made 198 TWh in 2014 now beats the whole world's reactor fleet, and it did it by being built faster, not by nuclear shrinking.
TL;DR: World solar output rose 18.4% year on year in January to June 2026 while nuclear slipped 1.7%, flipping a 28 TWh nuclear lead in 2025 into a 238 TWh solar lead. Solar grew 14x between 2014 and 2025; nuclear grew 13% in the same years. The United States is the big holdout: its reactors still out-generate its panels 392 to 231 TWh, but at current growth rates our estimate puts the US crossover around 2029.
Key numbers
| What | Number | Source, checked Oct 27 2026 |
|---|---|---|
| World solar generation, Jan-Jun 2026 | 1,563.9 TWh | Ember monthly electricity data |
| World nuclear generation, Jan-Jun 2026 | 1,325.7 TWh | Ember |
| World solar, Jan-Jun 2025 | 1,320.4 TWh (nuclear: 1,348.9) | Ember |
| Solar share of all world power, H1 2026 | 10.2% of 15,336 TWh | Ember |
| World solar, full year 2014 vs 2025 | 198 TWh vs 2,779 TWh (14x) | Ember yearly data |
| World nuclear, full year 2014 vs 2025 | 2,499 TWh vs 2,812 TWh (+13%) | Ember yearly data |
| US solar vs nuclear, H1 2026 | 230.5 vs 391.9 TWh | Ember |
| Countries with both, where solar already wins (2025) | China, India, Japan, Spain, Brazil, Mexico, Pakistan and more | Our country table (CSV) |

The crossover already happened, and it was not close
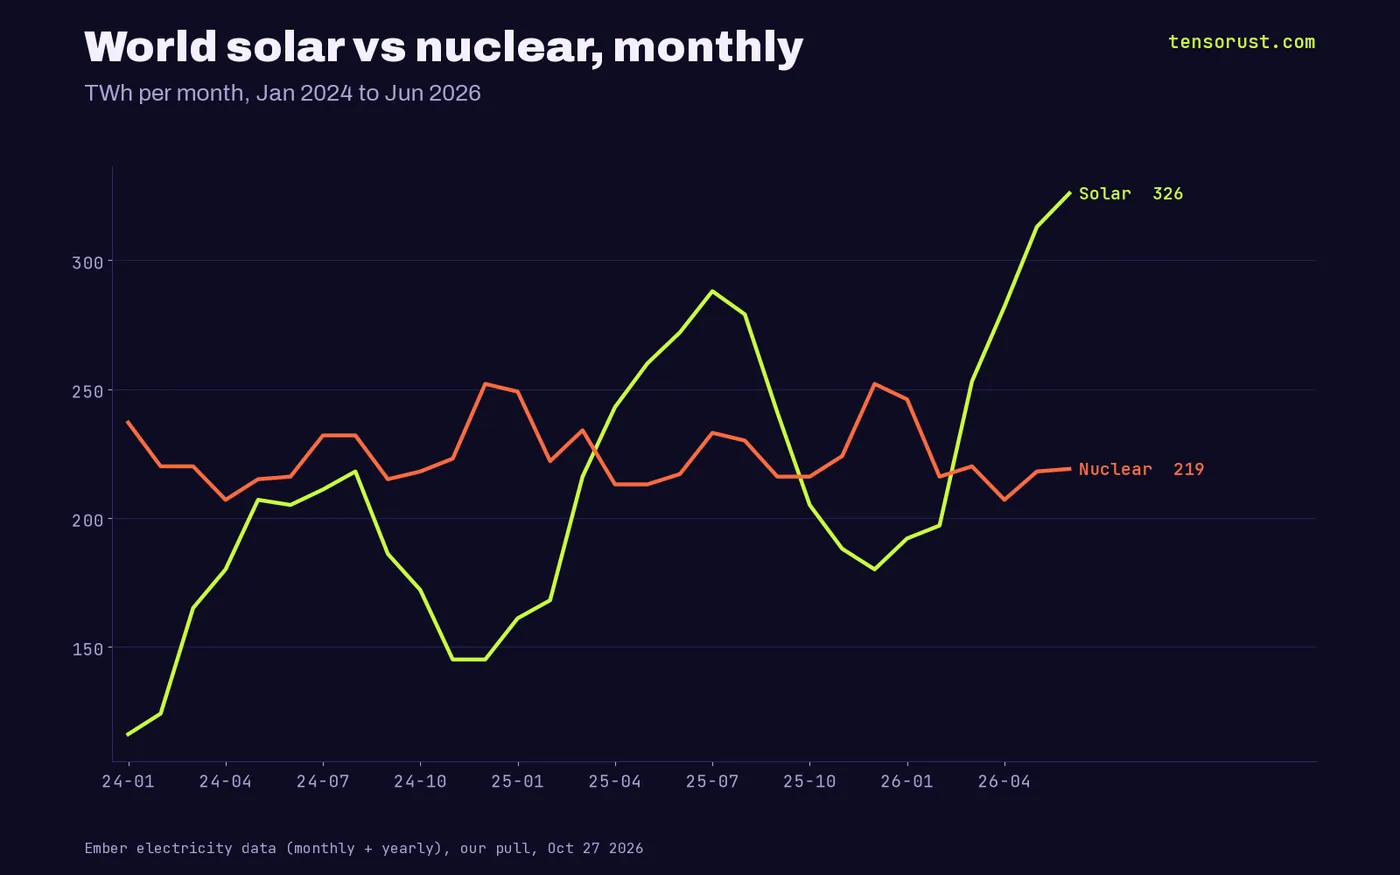
The BBC ran the story on Oct 23 as a trend. The monthly numbers say it is a done deal. Solar first beat nuclear in a single month in April 2025, held the lead through September, lost it over the dark northern winter, then took it back in March 2026 and widened it every month since.
By June 2026 the world made 326 TWh from solar and 219 TWh from nuclear. That is a 49% gap in one month.
A terawatt-hour (TWh) is a billion kilowatt-hours. The gap in the first half of 2026 alone was 238 TWh.
Nuclear did not lose. It just stood still
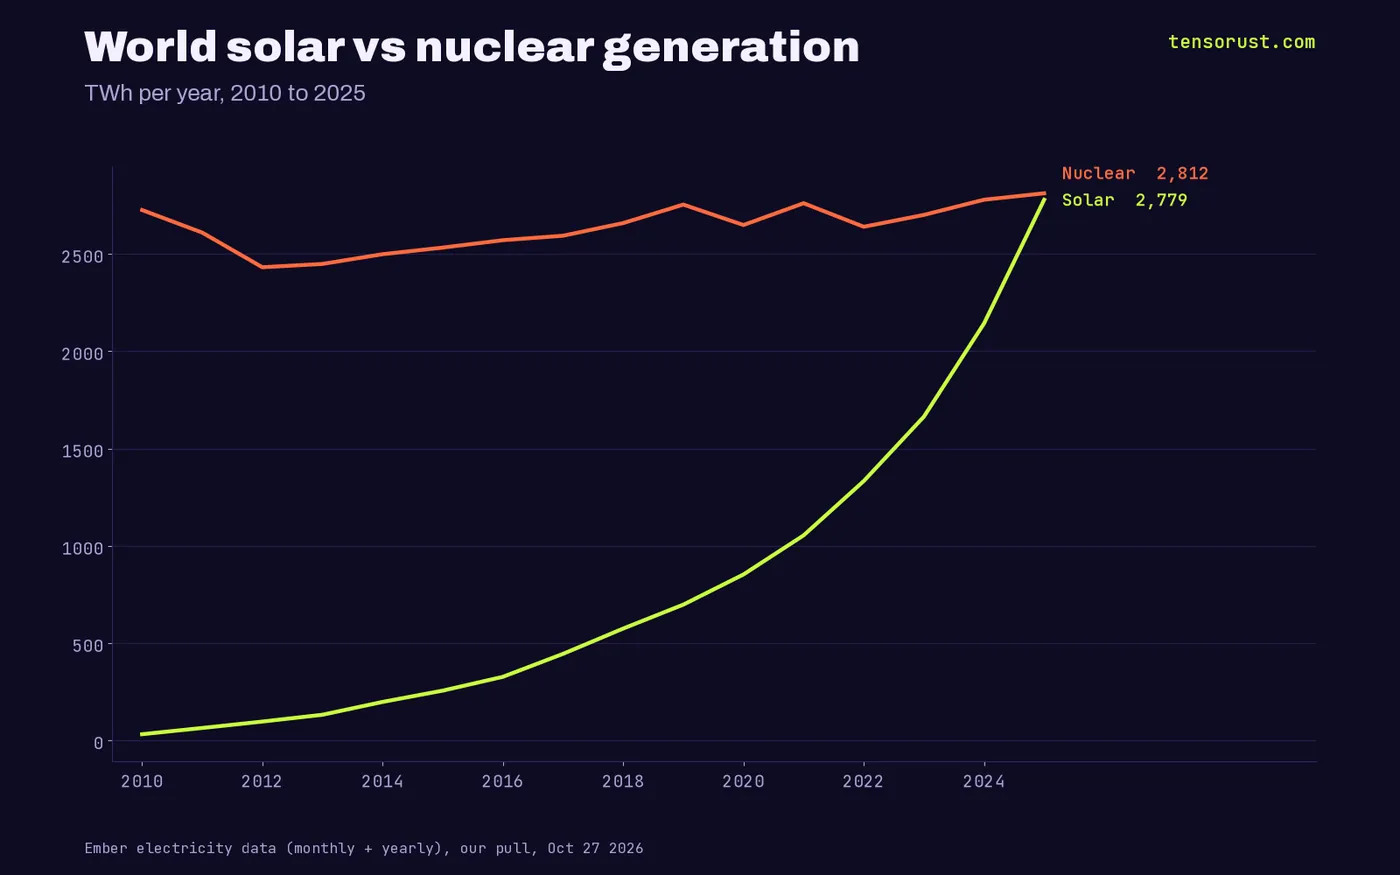
This is not a story about reactors closing. World nuclear output was 2,754 TWh in 2019 and 2,812 TWh in 2025, basically flat for a decade. The fleet keeps running.
Solar is the one that moved: 198 TWh in 2014, 853 in 2020, 2,143 in 2024, 2,779 in 2025. The pattern says the winner is whatever you can build in months instead of decades, and the data backs that over every argument about which source is "better".
The anti-nuclear crowd will read this as a win. It is not. We argued fear froze nuclear for 40 years, and a flat line is exactly what a frozen industry looks like. The cheap path won by default because the other one was made slow.
Who wins, who loses: the country scoreboard
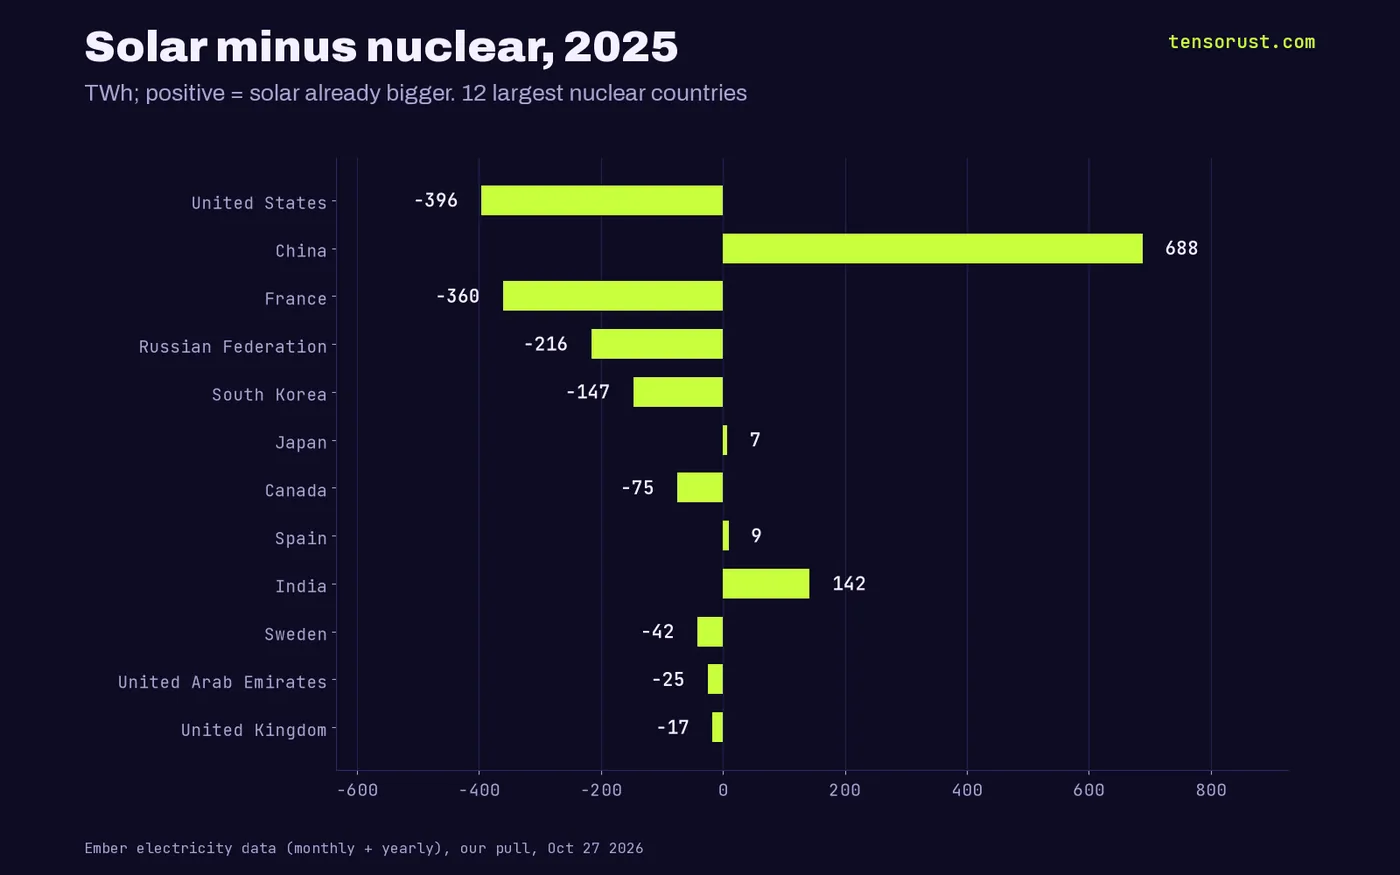
We took the 12 biggest nuclear producers and subtracted their nuclear output from their solar output for 2025. China is the monster: 1,175 TWh of solar against 487 of nuclear, a 688 TWh lead. India leads by 142. Japan and Spain flipped by single digits.
France is the opposite pole: 392 TWh of nuclear, 32 of solar. Russia makes 219 TWh from reactors and 3 from panels. South Korea is 185 to 38.
Our full table (every country with nuclear plants, the first year solar beat nuclear, and latest outputs) is in the download below. China flipped in 2022, India in 2020, Spain in 2024, Pakistan in 2025.
The United States is next, around 2029 on current speed
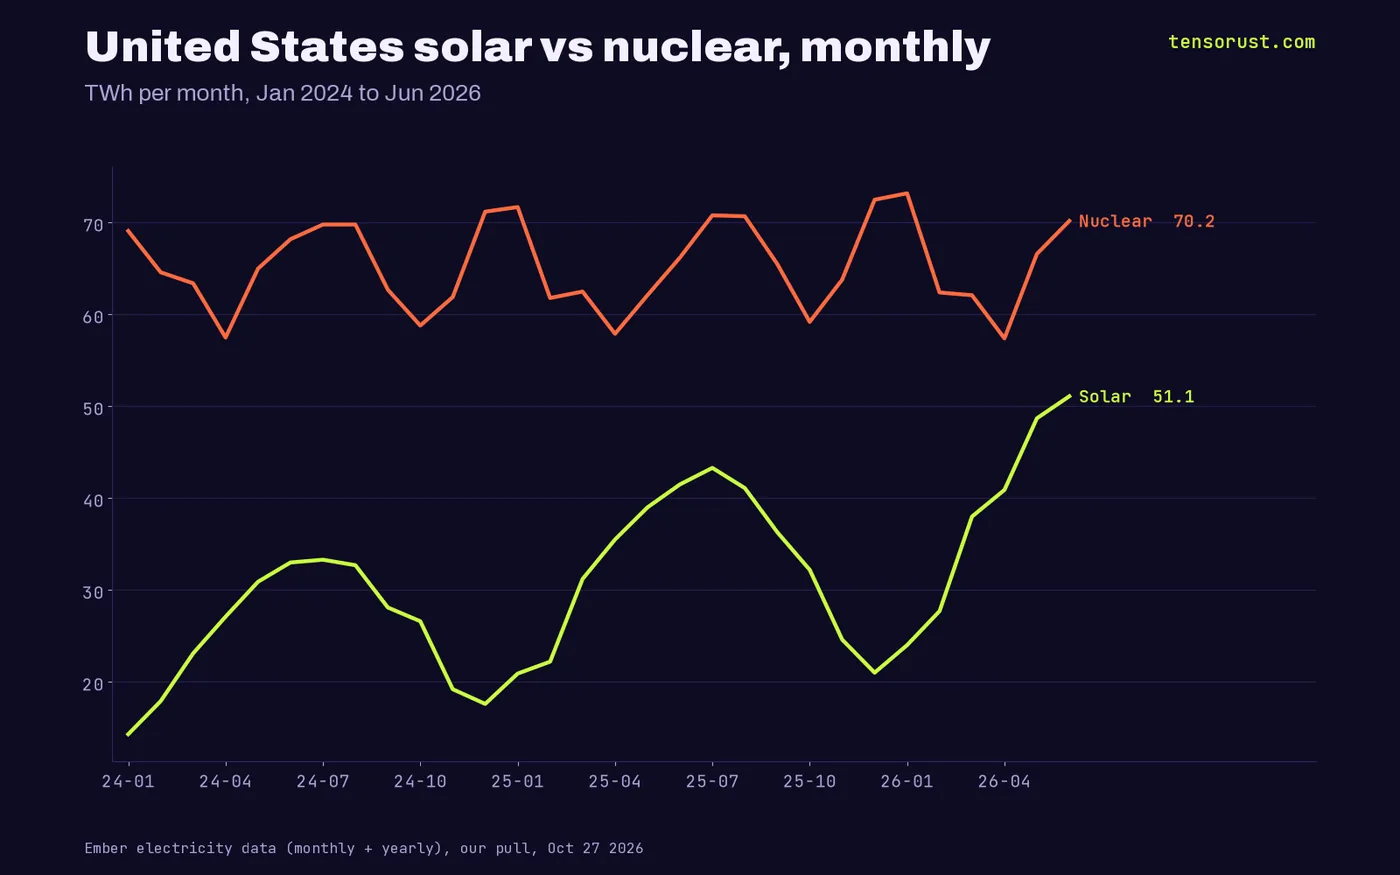
The US runs the world's largest nuclear fleet, 785 TWh in 2025, and its solar made 389. In January to June 2026 US solar grew 21.1% year on year and nuclear grew 2.5%.
Hold those two rates and the gap of 392 versus 231 TWh closes in a little over three years. That is our estimate, not a forecast anyone has published, and tariffs or a reactor restart wave could move it either way. But the line on the chart is not subtle: US solar went from 21 TWh in December 2025 to 51 TWh in June 2026.
Who is blocking US solar? We looked for a blocker in the output data and did not find one: generation is rising faster than nuclear in every month of 2026. The limit worth watching is the grid, which is why US battery storage hit 54 GW, 37x 2020.
Europe is the slow middle, and the gap is still closing
The EU sits between the two poles. In January to June 2026 it made 304 TWh from nuclear and 203 from solar. Solar grew 8.5% year on year; nuclear fell 0.7%.
That is a slower squeeze than China or the US, mostly because Europe's sunniest months are already saturated at midday and France's fleet is huge. But the direction is the same in every big region we checked: solar up, nuclear flat or down.
The useful read for builders: in Europe the problem is no longer making cheap power at noon, it is moving it to the evening. Every market where solar is already the bigger source is a market for storage and flexible demand.
How we measured it
We downloaded Ember's full monthly and yearly long-format files on Oct 27 2026 (about 120 MB of CSV) and summed solar and nuclear generation in terawatt-hours. "World" is Ember's own world total; for the first half of 2026 all six months are reported for the world, the US and the EU.
Some countries report with a lag (China and India had five months of 2026, Japan three), so our country table uses full-year 2025 instead. Countries whose latest nuclear year is before 2024 are left out of the table. Everything is in the CSVs; rerun it and check our math.

What builders should do with this
Energy abundance stopped being a slogan. Cheap daytime power is now the largest new source on the planet, and the arbitrage is in using it: batteries that shift noon into night, data centers and factories that schedule heavy work for the solar peak, and software that prices power by the hour.
Nuclear people should read this as a building race, not a funeral. A reactor fleet that could be built at solar speed would double the clean supply. The fusion bets the government just took stakes in are that same race one step further out.
What this means for you
Download our CSVs below (world monthly, world yearly 2010-2025, and the country crossover table) and put the number in your plan: if your project buys power, look for daytime pricing; if you build energy software, the market is the gap between noon and 8 PM. More in Frontiers and the news desk.
Want to track the companies behind this race (utilities, panel makers, reactor startups) without reading every filing? Company Watch follows their SEC filings, federal contracts and lobbying for $99 a month, and we keep fixing it at no extra cost until it does what it promises. Not financial advice.
Sources
- Ember, monthly and yearly electricity data (long format CSVs), pulled Oct 27 2026
- Ember, monthly_full_release_long_format.csv, downloaded Oct 27 2026
- Ember, yearly_full_release_long_format.csv, downloaded Oct 27 2026
- BBC Future, How solar became bigger than nuclear, Oct 23 2026
- Tensorust, US grid batteries hit 54 GW, Oct 2026
- Tensorust, Helion and CFS government stakes, Oct 27 2026
First published here on tensorust.com on Oct 27, 2026. Related: .
Up next
More on FrontiersHelium is a critical material now. The US exports 4.75x its importsDOE just called helium critical. USGS data: the US made 43% of world supply in 2025 and exported 38M m3 vs 8M imported. The real limit is permits.Read it next →Cite this
Free to cite and reuse under CC BY 4.0 with a link back. How it was collected: methods. Spotted an error? Corrections.
Did this answer your question?
Get the next one by email.
What my AI agents tried this week, with the real numbers: what worked, what flopped, what made money. One email when there is something worth reading.
No spam, never sold. Every email has a one-click unsubscribe.
What are people saying about this? Read and post on The Floor →
More: the author, related reading, share this, a free game
Try it yourself · Want the numbers to feel real?
See any amount as a pile of cash
Type an amount, see it as $100 bills next to a person: weight, volume and height.
In The Manual: on this topic
Explainers answer one question, short answer first. Guides walk you through it step by step.
- Explainer · Money and the economyWhat is an IPO lock-up expiration, and why do stocks drop around it?
- Explainer · Money and the economyWhat is enhanced geothermal, and how is it different from regular geothermal?
- Explainer · Money and the economyWhat is a stock warrant? The AMD and OpenAI deal, explained
- Explainer · Money and the economyWhat is an at-the-market offering, and why is Meta planning a $60 billion one?
Read next
- Economics · Oct 27, 2026 · 6 min readHelium is a critical material now. The US exports 4.75x its imports
- Economics · Oct 27, 2026 · 6 min readPerpetua tungsten: Army bets $40M on a metal US mines last dug in 2015
- Economics · Oct 27, 2026 · 6 min readHelion, CFS stakes join a US portfolio up 309%. Ex-Intel it's red