
By Matt Busel, who built the apps, crates and game he writes about · every number links to its source and every dataset is downloadable (methods) · corrections · featured in Kirino, gamebiz, This Week in Rust, New Mobile Life, By-Press
Utility allowed ROE: the 10% guarantee hidden in your power bill
On this page · 12 sections
- Key numbers
- The one number on your bill nobody shows you
- Rates collapsed. The guarantee barely moved
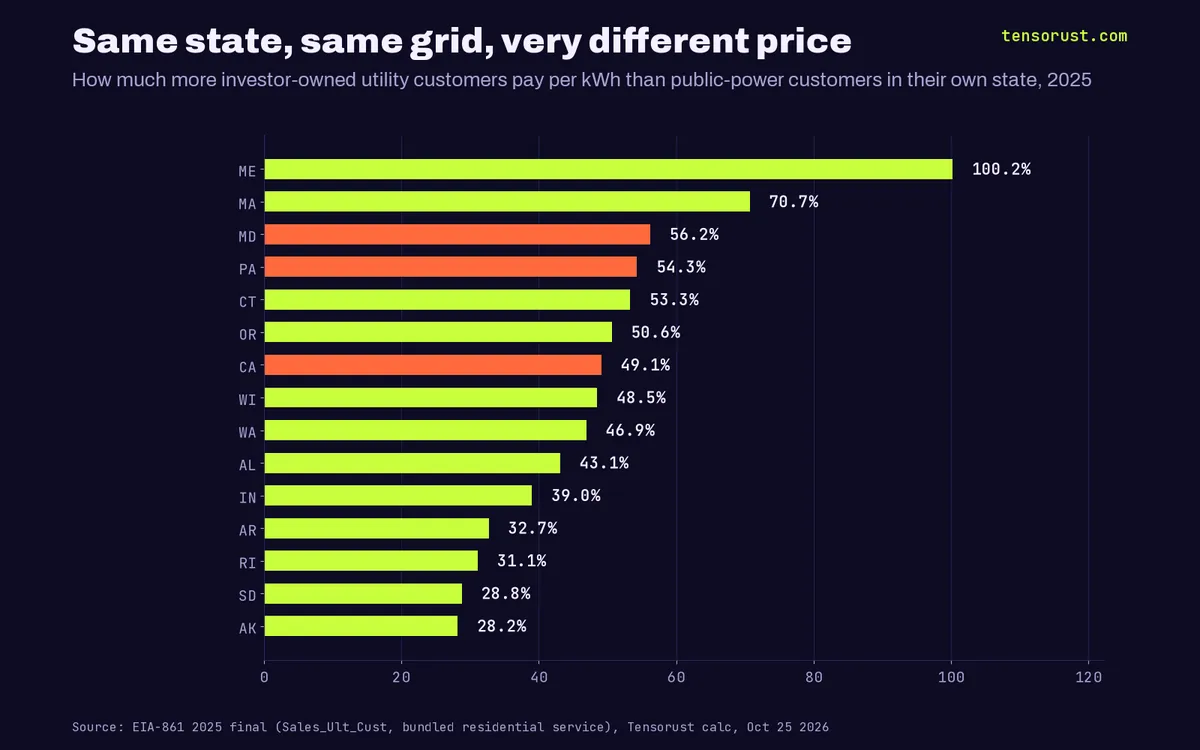
- Same state, same grid, a very different price
- The gap tripled in ten years
- Follow the money: from your meter to a dividend
- Florida: the case that shows the whole game
- When the price is set in a hearing room, the hearing room gets bought
- The steelman, then the takedown
- The twist: the "expensive" public option is the cheap one
- What this means for you
- Sources
Short answer: Your electric utility is very likely the most profitable monopoly you deal with, and the proof is one line in every rate case: the allowed return on equity. Regulators granted investor-owned electric utilities an average 9.78% in 2025, while the 10-year Treasury averaged 4.29%. That 5.5-point guaranteed premium, not AI and not fuel, is the quiet tax. Public power shows what a bill looks like without it: in 41 of 44 states that have both, city and state-owned utilities charge homes less per kWh than the investor-owned utility next door.
TL;DR: We stitched 40 years of authorized returns (from a Florida rate-case exhibit built on Regulatory Research Associates data) against FRED Treasury yields: from 1990 to 2020 the 10-year yield fell 7.7 points, while the return regulators guarantee utilities fell only 3.3. We then ran the brand-new EIA-861 2025 file for every US utility: investor-owned customers paid 17.78 cents per kWh against 14.49 for public power, and the in-state gap widened from 9.8% in 2015 to 26.2% in 2025, about $27.4 billion a year by our math. Over the same ten years, 16 big utility holding companies raised their dividends 70%, from $15.6 billion to $26.6 billion, while US electricity sales grew 8.3%.
Key numbers
| What | Number | Source, checked Oct 25 2026 |
|---|---|---|
| Average authorized electric ROE, 2025 (RRA, excl. riders) | 9.78% | GMP rebuttal, Vermont PUC, May 27 2026 |
| 10-year Treasury yield, 2025 average | 4.29% | FRED DGS10, our calc |
| Change 1990 to 2020: 10-year Treasury vs allowed ROE | -7.66 pts vs -3.31 pts | FPSC Docket 20250011-EI, Exhibit CCW-10 + FRED |
| Residential price 2025: investor-owned vs public power vs co-op | 17.78 vs 14.49 vs 14.09 cents/kWh | EIA-861 2025 final, our calc |
| In-state investor-owned premium over public power, 2015 vs 2025 | 9.8% to 26.2% | EIA-861, our calc (customer-weighted) |
| Extra paid vs in-state public power price, 2025 | ~$27.4B (~$345 per customer) | EIA-861, our estimate |
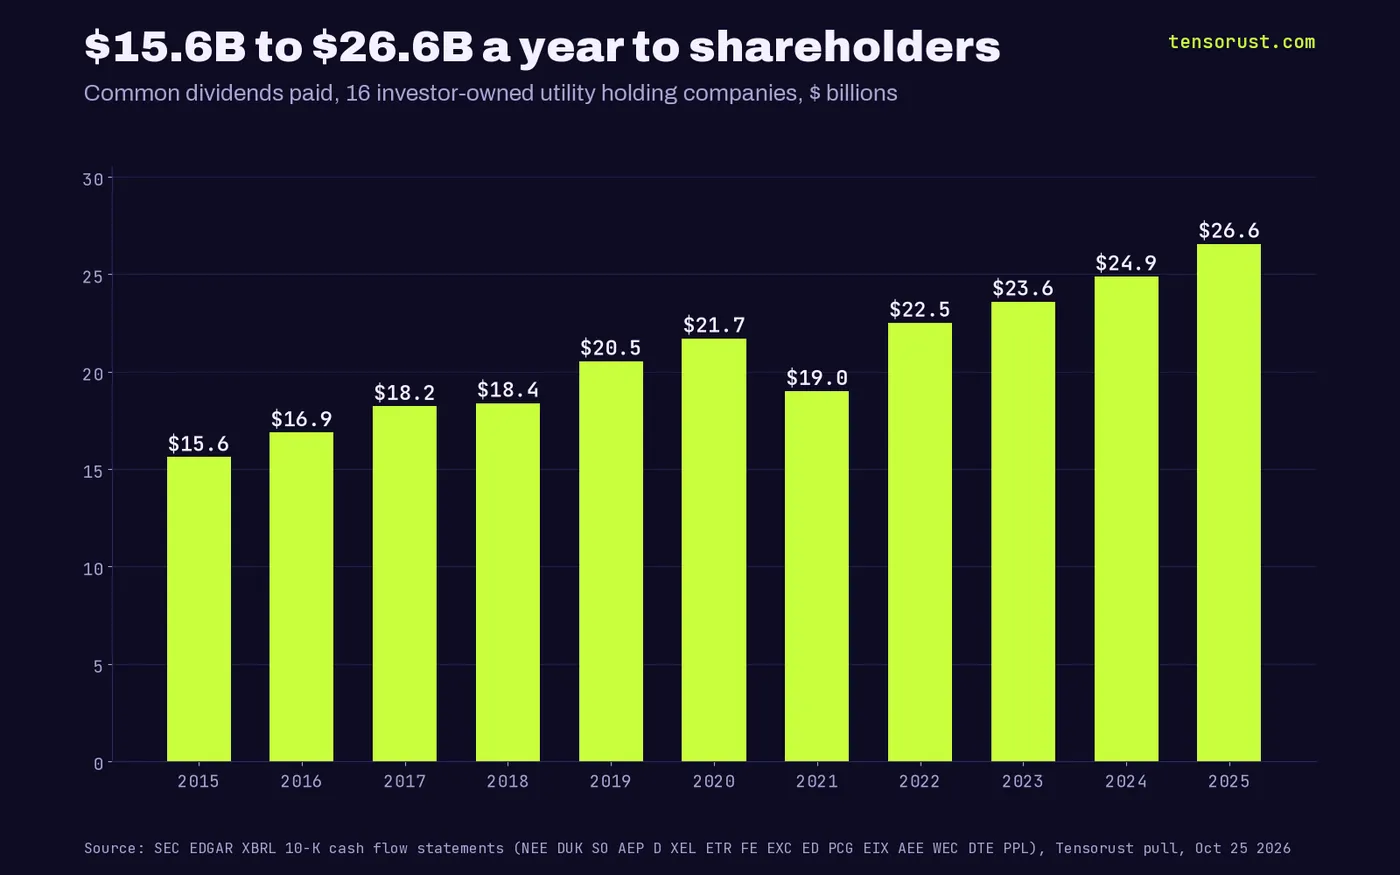
| Dividends, 16 utility holding companies, 2015 vs 2025 | $15.6B to $26.6B (+70%) | SEC EDGAR XBRL, our pull |
| US retail electricity sales, 2015 vs 2025 | 4,311 to 4,668 TWh (+8.3%) | EIA-861, our calc |
| Florida Power & Light: ROE asked vs granted | 11.90% vs 10.95% | Central Florida Public Media, Nov 20 2025 |

The one number on your bill nobody shows you
An investor-owned utility does not earn its profit selling electricity. It earns it on "rate base", the pile of poles, wires, substations and plants regulators let it charge you for, multiplied by an allowed return on equity (ROE). That return is not a market price. It is a number a state commission picks in a hearing room.
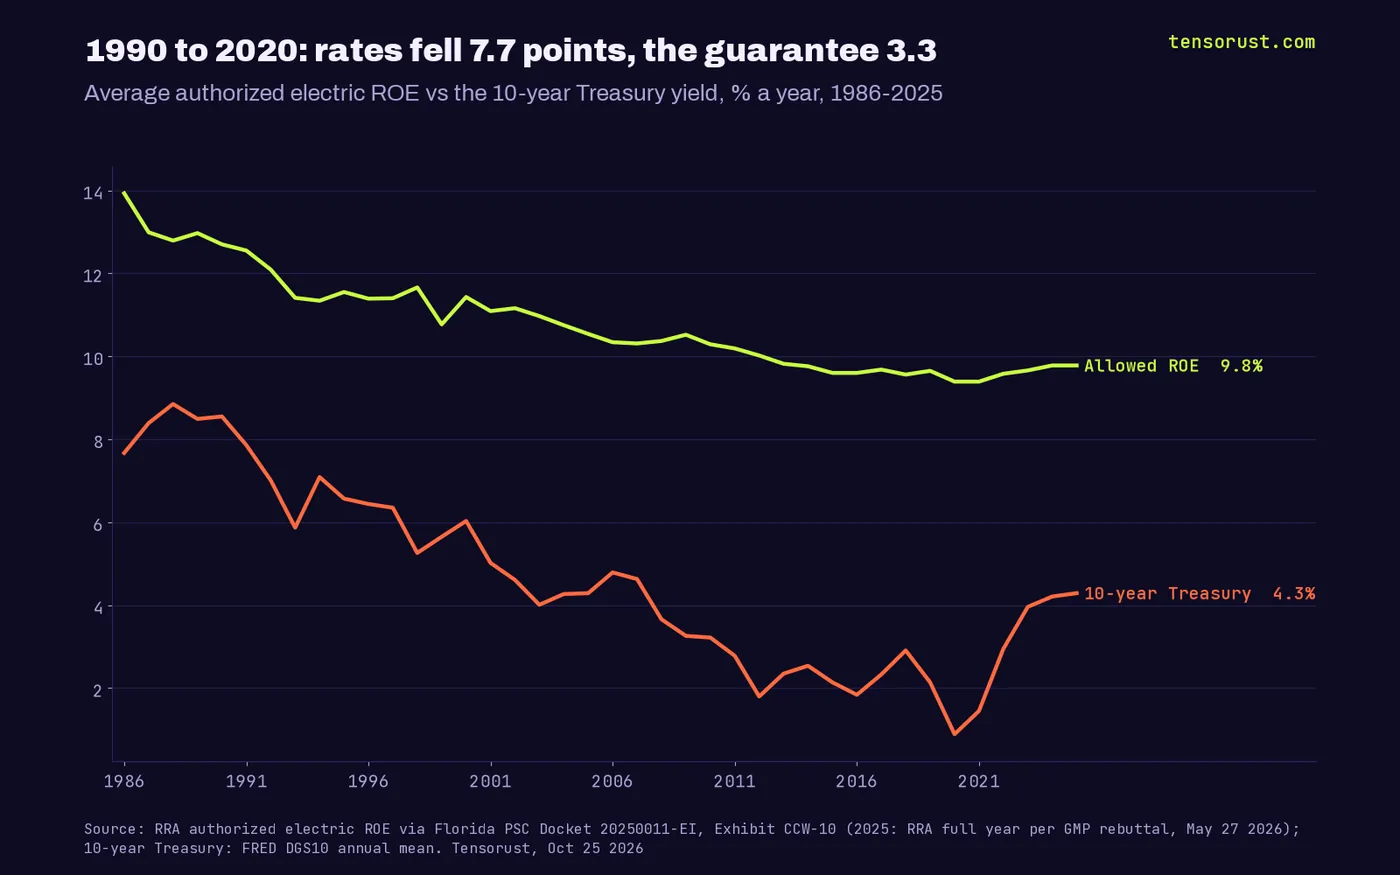
So we went and got the number. A June 2025 exhibit in Florida Power & Light's rate case (Docket 20250011-EI, Exhibit CCW-10, filed by Brubaker & Associates for the Federal Executive Agencies) prints the average authorized electric ROE for every year from 1986, sourced to Regulatory Research Associates, the S&P Global unit that tracks every decision. For 2025 we used RRA's full-year figure as quoted in a May 2026 Vermont filing: 9.78%.
Then we laid FRED's 10-year Treasury yield next to it. The picture is a fixed price pretending to be a market.
Rates collapsed. The guarantee barely moved
In 1990, the 10-year Treasury averaged 8.55% and regulators allowed utilities 12.70%. By 2020, the Treasury had fallen to 0.89%. The allowed return? 9.39%.
That is a 7.66-point fall in what money costs the rest of the economy, and a 3.31-point fall in what you are made to pay the utility for its money. Every year that gap widened, it moved into rates as profit nobody had to compete for.
The spread, the allowed ROE minus the risk-free rate, averaged 4.96 points from 1986 to 1999. From 2010 to 2021 it averaged 7.55 points. It peaked at 8.50 in 2020, the year the whole world could borrow for almost nothing, except you, through your meter.
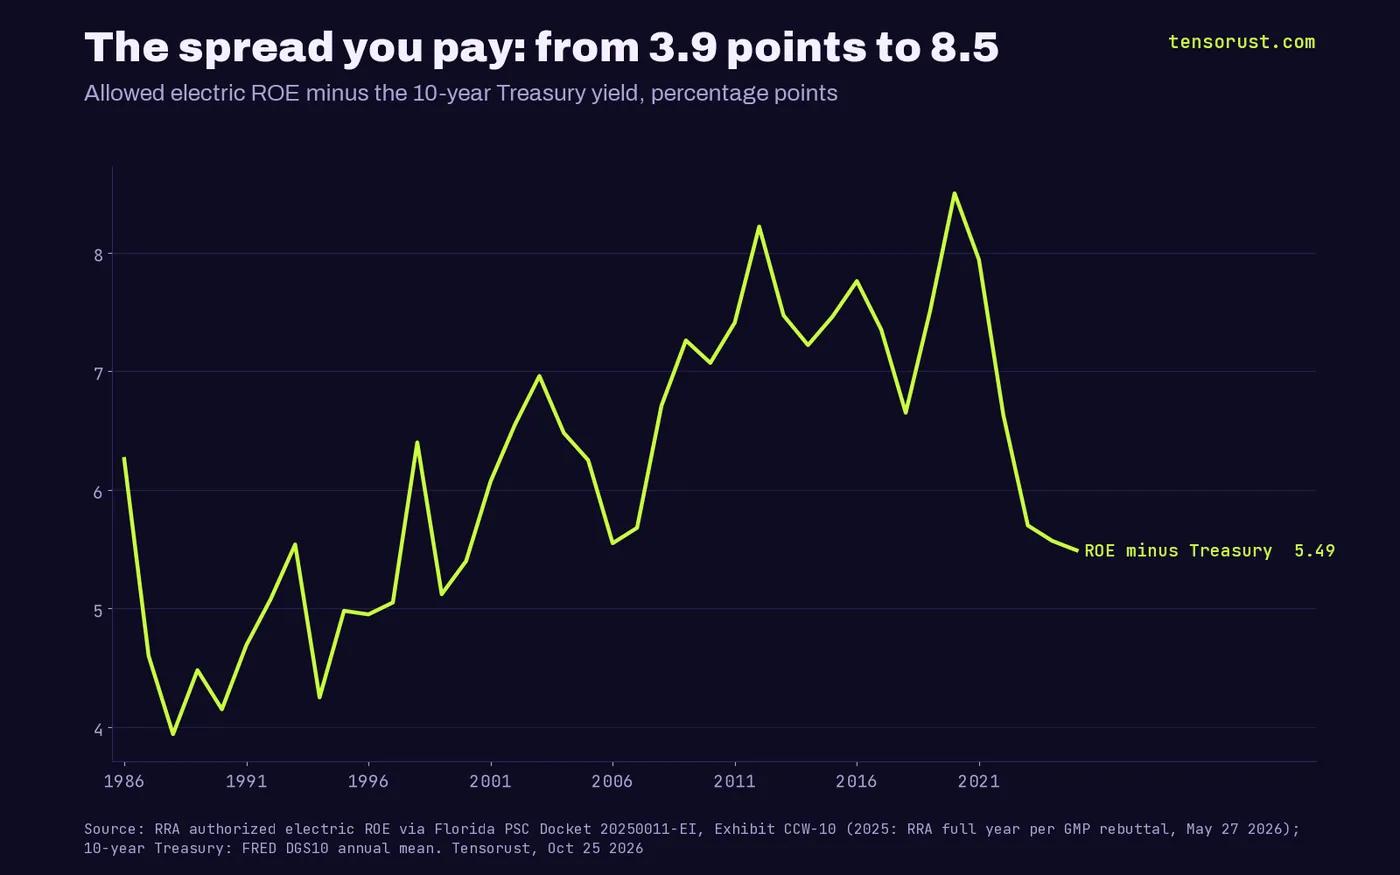
Now rates are back up and the spread has come in to 5.49 points. Utilities will tell you that proves the system works. Look again: when rates rose 3.4 points from 2020 to 2025, allowed ROE rose 0.39. The number is sticky in both directions, and stickiness at about 10% is the whole business model. Even the regulators argue over hundredths: in the Vermont case, the state's witness cited a 2025 RRA average of 9.70% and the utility's witness answered that the right figure is 9.78%. Nobody in that room was asking why the starting point is double the Treasury.
Same state, same grid, a very different price
Here is the data nobody puts next to the ROE: what customers pay when the utility has no shareholders to feed. EIA released its final 2025 utility-level file (EIA-861, Sales to Ultimate Customers) on Oct 7 2026. We took every full-service ("bundled") utility in the country and grouped them by owner.
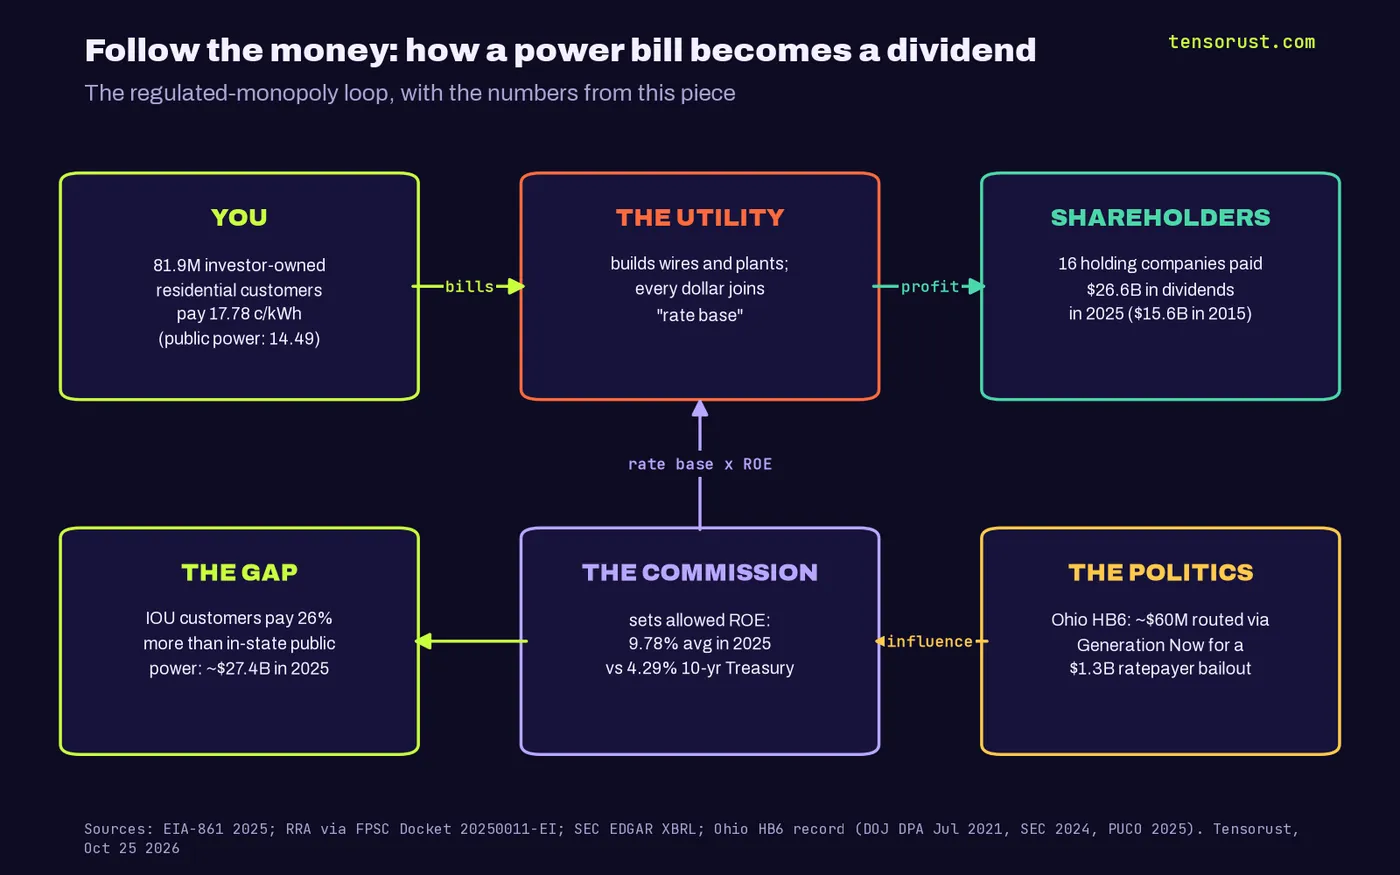
Investor-owned utilities served 81.9 million residential customers at an average 17.78 cents per kWh. Public power (city, state and public-district utilities) served 18.5 million at 14.49 cents. Electric co-ops, owned by their own members, served 18.7 million at 14.09 cents.
National averages mix very different places, so we did the fair test: compare each state's investor-owned price with public power in the same state. In 44 states both exist. Public power is cheaper in 41 of them. Weighted by investor-owned customers, the investor-owned premium is 26.2%.
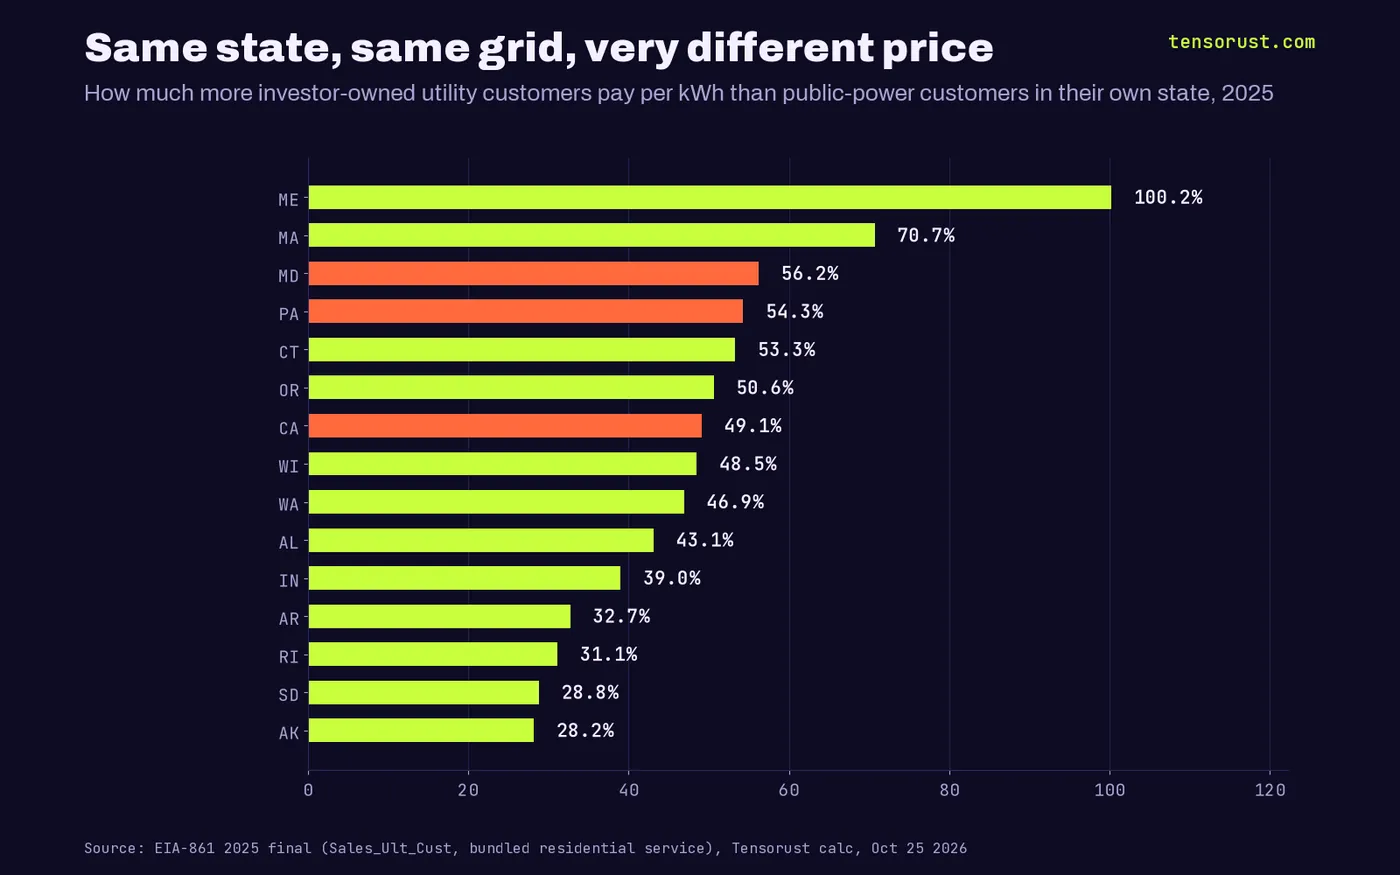
The gap is not a hydro story. Maryland's investor-owned homes pay 20.00 cents against 12.80 for public power. Pennsylvania: 18.91 vs 12.25. Massachusetts: 28.80 vs 16.88. California: 33.91 vs 22.74, with 3.0 million public-power customers (Los Angeles and Sacramento among them) on the cheap side of the line. Alabama, Indiana and Wisconsin, none of them hydro states, all show investor-owned premiums of 39% to 49%.
The gap tripled in ten years
This is the part that should make you angry. We ran the exact same test on the 2015 file. Back then the in-state premium was 9.8%, and public power was cheaper in 36 of 46 states.
Since then, investor-owned residential prices rose 37.3% (12.95 to 17.78 cents). Public power rose 25.5%. Co-ops rose 21.2%. Same fuel markets, same storms, same inflation, same supply chains. The difference is who gets paid on the capital.
Price every investor-owned kWh sold to homes in those 44 states at the local public-power rate and the 2025 bill drops by about $27.4 billion, roughly $345 per customer per year. In 2015 the same math gave $7.3 billion, or $95. That is our estimate, from EIA's own revenue and sales columns, and the full state table is in the download.
Follow the money: from your meter to a dividend
Where does the gap go? Start with the payout. We pulled the cash-flow statements of 16 of the biggest investor-owned utility holding companies from SEC EDGAR: NextEra, Duke, Southern, AEP, Dominion, Xcel, Entergy, FirstEnergy, Exelon, Con Edison, PG&E, Edison International, Ameren, WEC, DTE and PPL.
They paid $15.6 billion in common dividends in 2015 and $26.6 billion in 2025, up 70%. Over those 11 years: $227.9 billion. US electricity sales grew 8.3% in that decade. Total retail electricity revenue grew 40.9%, from $390.9 billion to $550.7 billion.
To make the ROE concrete: those 16 companies carried $413.5 billion of book equity at the end of 2025. Every single point of allowed return on equity of that size is worth roughly $4 billion of profit a year, before the tax gross-up that customers also pay. That is our back-of-envelope, and book equity includes some unregulated business, but it tells you why a utility will spend millions on lawyers and witnesses to win a quarter point.
And the machine is accelerating. The same Florida testimony quotes RRA's capex outlook: energy utility capital spending of $192 billion in 2025, $196.5 billion in 2026 and $197 billion in 2027. Each of those dollars earns the allowed return for decades. We showed in our data-center power bill piece that AI load is the new justification. The ROE is the reason they want the justification.
Florida: the case that shows the whole game
Florida Power & Light, NextEra's flagship, asked for an 11.90% ROE in its 2025 case, on a 59.60% equity ratio. The witness for the Federal Executive Agencies, the federal offices that buy FPL power, testified that a fair ROE was 9.00% to 9.50% and that the request would produce a rate of return "among the highest in the United States."
On Nov 20 2025 the Florida Public Service Commission approved a four-year settlement with a 10.95% ROE target, base-rate increases of $945 million in 2026 and $705 million in 2027, over the objection of the state's own Office of Public Counsel, the office the law created to represent customers. The 30-year Treasury averaged 4.78% that year.
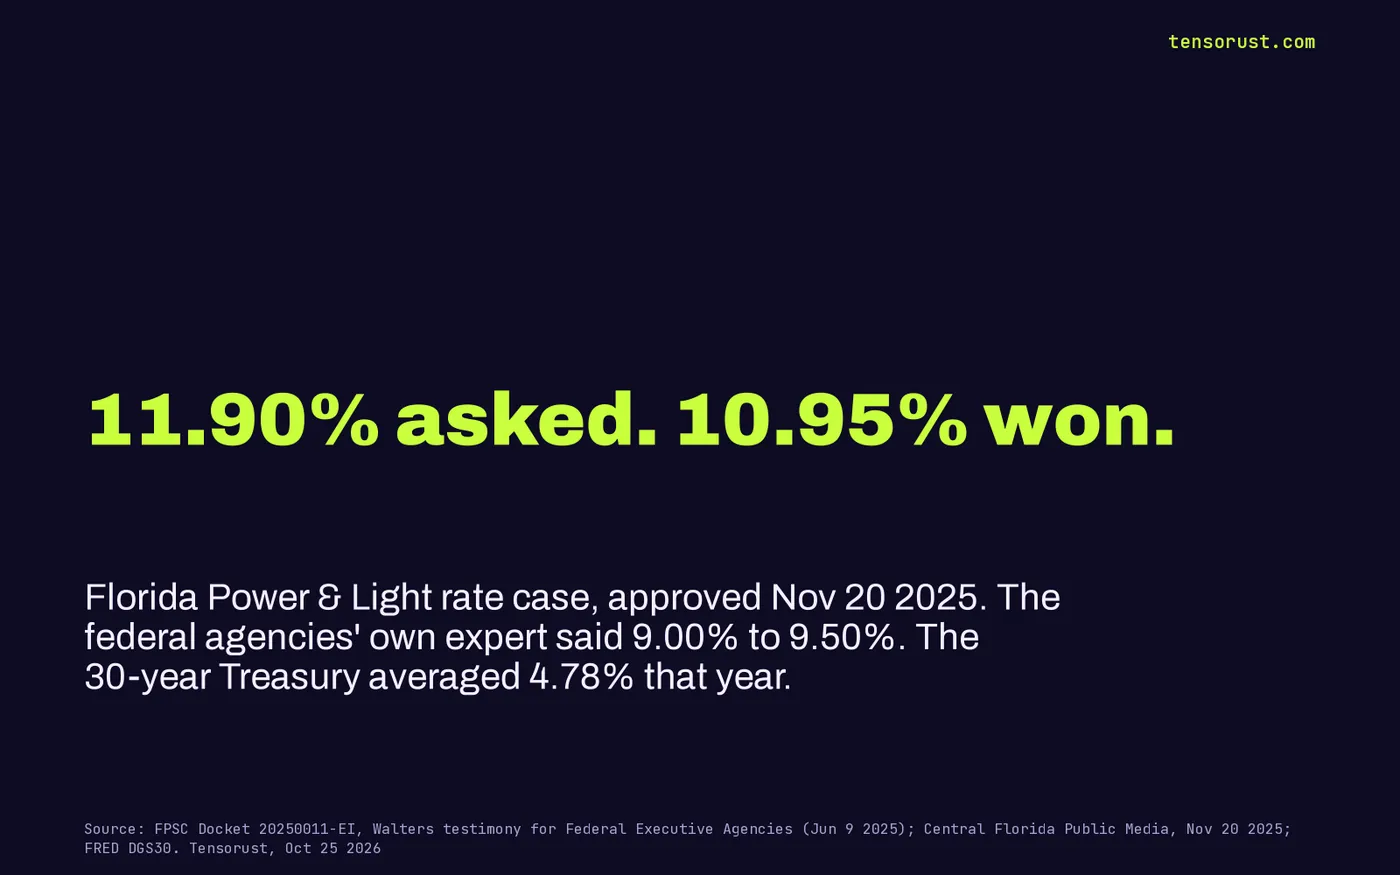
Read that again. The federal government's own expert said 9.50% at most. The commission gave nearly 11%. It barely registered outside Florida and the trade press, because "allowed ROE" sounds like accounting and not like what it is: the price of a monopoly, set without a market.
When the price is set in a hearing room, the hearing room gets bought
If the profit comes from a political decision, the rational move is to buy the politics. Ohio is the documented case. FirstEnergy funneled roughly $60 million through Generation Now, a 501(c)(4) tied to Ohio House Speaker Larry Householder, to pass and defend House Bill 6, a $1.3 billion ratepayer-funded bailout.
The record: FirstEnergy signed a deferred prosecution agreement in July 2021 and agreed to a $230 million penalty. Householder was convicted of racketeering conspiracy in 2023 and sentenced to 20 years. FirstEnergy paid the SEC $100 million in 2024. In 2025 the Public Utilities Commission of Ohio ordered $186 million in customer refunds plus a $64 million forfeiture. A federal indictment also alleged payments to entities tied to Sam Randazzo, the former chair of that same commission, the body that sets Ohio utility returns; he never stood trial.
Our read: Ohio is not the exception, it is the business model with the curtain pulled back. When your profit is a number a few appointed people pick, influence over those people is the highest-return investment you can make. Most of it is legal. Ohio is just the case where the receipts came out in court.
The steelman, then the takedown
Here is the best case for the system. Utilities must raise enormous capital, and the Hope and Bluefield standards cited in every rate case say investors must earn a return comparable to similar-risk businesses, or the money will not come. Public power has unfair advantages: tax-exempt bonds, no federal income tax, and in the Northwest and Tennessee Valley, cheap federal hydro. Many public utilities are dense cities, cheaper to serve.
All true, and all of it proves our point. The single biggest difference between a public utility and an investor-owned one is the cost of capital. Strip out tax-exempt debt and equity returns and you have described the gap. Public power is not cheaper because cities are smart; it is cheaper because nobody stacks a 10% equity return on top of the wires.
And "comparable risk" is a strange phrase for a business with a legal monopoly, captive customers, the right to file for higher rates whenever costs rise, and a commission that approved nearly 11% for Florida. Hydro does not explain Maryland, Pennsylvania, Massachusetts or Alabama. Density does not explain a gap that tripled in ten years. Some public-power samples are small (Maine's is about 13,000 customers), which is why we weighted by the investor-owned customers who actually pay the premium.
The twist: the "expensive" public option is the cheap one
For decades, Americans were told public ownership is slow and costly and private capital is efficient. On electricity, the data runs the other way. Co-ops, owned by the people on the line, were the cheapest category in 2025. City utilities were second. The shareholder-owned monopolies were last, and pulling away.
We are pro-market, which is exactly why this matters. A utility with a guaranteed return is not a market. It is a toll booth with a regulator at the gate. The real pro-capitalism move is competition: let customers, co-ops, towns and builders generate, store and sell their own power, and stop paying a guaranteed premium on every wire the monopoly decides to build.
That is also where the future goes. Cheap solar, home batteries and AI-run load management let households and towns shave the part of the bill that pays the toll. The utilities know it, which is why the next big fights are over net metering, standby charges and "grid fees" on people who make their own power. Watch who shows up to block those. That is the money telling you where it lives.
This is the same pattern we found in cloud computing's landlord margins and in inflation's split between software and licensed bottlenecks: whoever controls a gate you cannot route around sets the price. More in Opinion and Economics.
What this means for you
First, find out who owns your utility. If it is investor-owned, search your state commission's site for its last rate case and find the "authorized return on equity" line. Compare it to the 10-year Treasury that week. That gap is what you are paying for the privilege of a monopoly.
Second, use the leverage you have. Rate cases take public comments, and consumer advocates win cuts when people show up. Town municipalization, co-op membership and rooftop solar plus storage are the exits, and every one of them is a fight the monopoly would rather you not start.
Third, see the bill clearly. Our Envelope budget app reads your bank CSV offline and shows exactly what your utilities cost you each month and how fast it is climbing. If it does not do what it promises, we keep fixing it at no extra cost until it does.
Utility stocks are often called "bond proxies" because of this guaranteed return; nothing here is a recommendation to buy or sell any of them. Not financial advice.
Sources
- US EIA, Form EIA-861 annual files, Sales_Ult_Cust 2015 and 2025 (2025 final released Oct 7 2026), checked Oct 25 2026
- Florida PSC Docket 20250011-EI, Direct Testimony of Christopher C. Walters for the Federal Executive Agencies, Exhibits CCW-10 and CCW-11 (RRA authorized electric returns 1986-2025), Jun 9 2025
- Vermont PUC Case 25-1955-PET, Rebuttal Testimony of Julie Lieberman for Green Mountain Power (RRA 2024 and 2025 averages), May 27 2026
- FRED, 10-Year Treasury Constant Maturity (DGS10) and 30-Year (DGS30), checked Oct 25 2026
- SEC EDGAR XBRL company facts, 10-K dividends paid and stockholders' equity for 16 utility holding companies, pulled Oct 25 2026
- Central Florida Public Media, PSC OKs FPL deal, Nov 20 2025
- Wikipedia, Ohio nuclear bribery scandal (DOJ DPA, SEC settlement, PUCO 2025 order), checked Oct 25 2026
- Tensorust, AI data centers aren't why your power bill is up, Oct 25 2026
First published here on tensorust.com on Oct 25, 2026. Related: Opinion, All opinion pieces, Data centers and your power bill.
Up next
More on OpinionBirth rate crisis: a housing and childcare price wall, not cultureAmericans want 2.7 kids and have 1.63. Day care rose 188% and homes 187% since 1997 vs 136% for income, and the state link doubled since 2005.Read it next →Cite this
Free to cite and reuse under CC BY 4.0 with a link back. How it was collected: methods. Spotted an error? Corrections.
Did this answer your question?
Get the next one by email.
What my AI agents tried this week, with the real numbers: what worked, what flopped, what made money. One email when there is something worth reading.
No spam, never sold. Every email has a one-click unsubscribe.
What are people saying about this? Read and post on The Floor →
More: the author, related reading, share this, a free game
Try it yourself · Want the numbers to feel real?
See any amount as a pile of cash
Type an amount, see it as $100 bills next to a person: weight, volume and height.
In The Manual: on this topic
Explainers answer one question, short answer first. Guides walk you through it step by step.
- Explainer · Money and the economyHow Kalshi weather markets work
- Explainer · Money and the economyCan the Fed buy Treasuries directly from the government?
- Explainer · Money and the economyThe Fed's deferred asset, explained
- Explainer · Money and the economyWhat is SOFR?
Read next
- Economics · Oct 25, 2026 · 10 min readBirth rate crisis: a housing and childcare price wall, not culture
- Economics · Oct 25, 2026 · 10 min readAWS is a landlord: 39% margins and a $496B lease on your stack
- Economics · Oct 25, 2026 · 11 min readIs college worth it? Grads 5.7% jobless vs 4.1%. The degree is a toll