
Debt held by the public vs intragovernmental debt: what is the difference?
Short answer
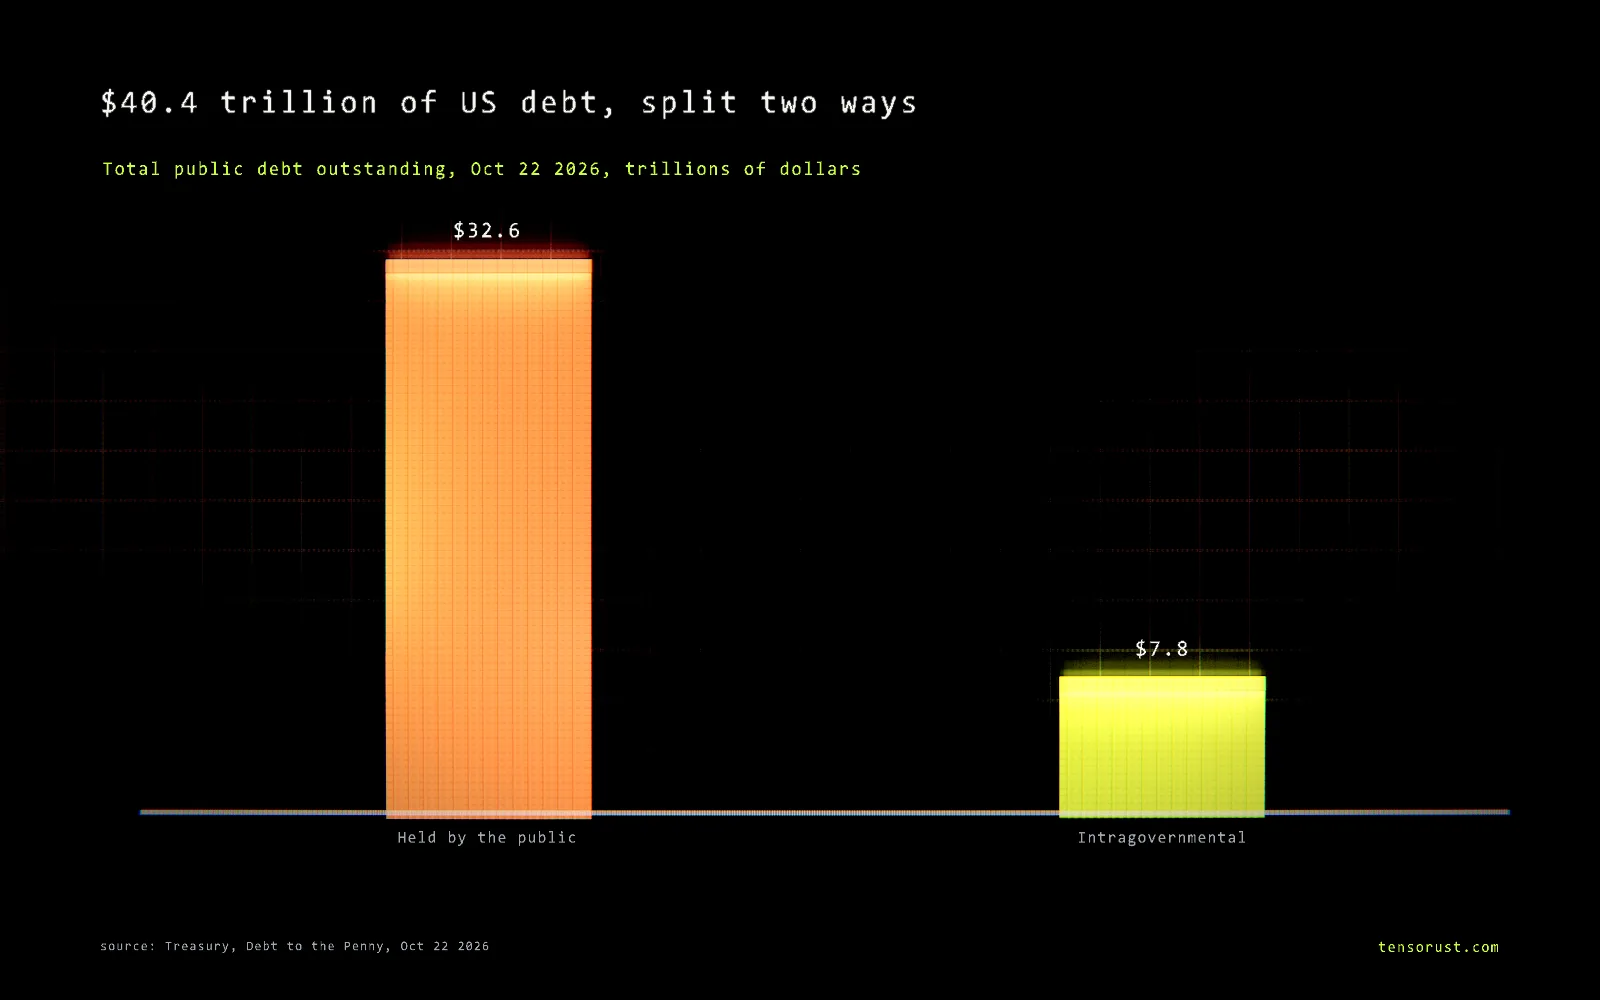
Debt held by the public is what the US Treasury owes to lenders outside the federal government: people, funds, banks, foreign investors and the Federal Reserve. Intragovernmental debt is what it owes to its own accounts, mostly trust funds like Social Security and federal pensions. On October 22, 2026 the split was $32.6 trillion public and $7.8 trillion intragovernmental, out of $40.4 trillion total.
Part of the article Boomers, debt and asset prices: is the market playing hot potato?. This page answers one question from it in depth.
On this page · 10 sections
The public part is the one that hits credit markets and drives interest costs. The intragovernmental part is real money owed to retirees and workers, and as Social Security spends down its reserves, it is quietly turning into public debt. That is why its share has fallen from 43.9% in 2007 to 19.3% today.
Key numbers
| What | Number | Source (checked Oct 24 2026) |
|---|---|---|
| Total public debt outstanding | $40.444 trillion (Oct 22 2026) | Treasury, Debt to the Penny |
| Debt held by the public | $32.598 trillion (80.6%) | same |
| Intragovernmental holdings | $7.847 trillion (19.4%) | same |
| Intragovernmental share, peak | 43.9% (Sep 2007) | Debt to the Penny, fiscal year ends, our table |
| Social Security trust funds (OASI + DI) | $2.441 trillion (Sep 30 2026) | Monthly Treasury Statement, Table 6 Schedule D |
| Military Retirement Fund | $2.120 trillion | same |
| Civil Service Retirement and Disability Fund | $1.189 trillion | same |
| Change in the retirement (OASI) trust fund, FY2026 | minus $220.4 billion | same |
| Interest credited to trust funds, FY2026 | $291.9 billion | Treasury, Interest Expense on the Public Debt |
| Debt subject to the debt limit | $40.244 trillion (Oct 22 2026) | Daily Treasury Statement, Table III-C |
Download the data (CSV): debt held by the public, intragovernmental holdings and the intragovernmental share at every fiscal year end since 1997, from Treasury's Debt to the Penny API.
The two kinds, in plain words
Every Treasury IOU sits on one side of a single line: is the owner inside the federal government or outside it?
- Held by the public. Treasury bills, notes, bonds and savings bonds owned by anyone outside the government. That includes you if you hold a savings bond, your money market fund, banks, pension funds, insurers, state governments, foreign central banks, and the Federal Reserve. The Fed counts as "public" because it sits outside the federal budget. This is the debt the Treasury had to sell in markets to raise cash.
- Intragovernmental. Special nonmarketable securities, the Government Account Series, that the Treasury issues to its own trust funds and other accounts. When Social Security collects more in payroll taxes than it pays out, the law says the surplus must be invested in these securities. The fund earns interest on them, and when it needs cash to pay benefits, it redeems them.
Treasury's own definition, from the Debt to the Penny dataset: intragovernmental holdings are "Government Account Series securities held by Government trust funds, revolving funds, and special funds," plus Federal Financing Bank securities.
Who holds the $7.8 trillion
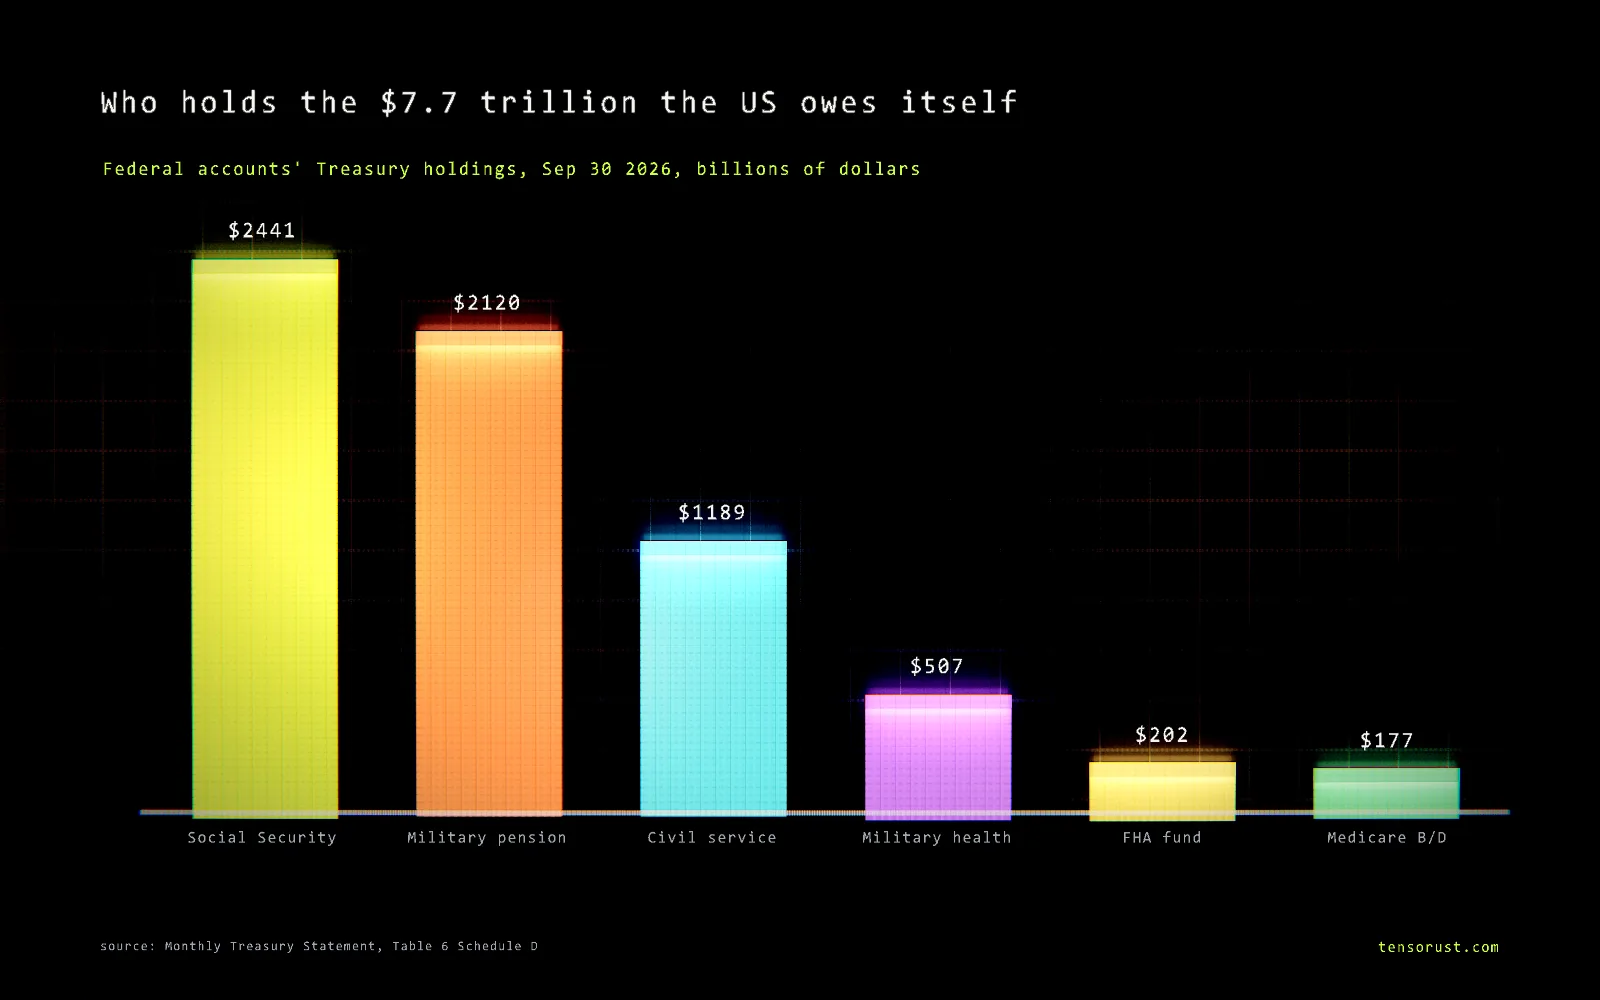
On September 30, 2026, per Table 6 Schedule D of the Monthly Treasury Statement:
- Social Security: $2,180.4 billion in the retirement (OASI) fund plus $260.6 billion in the disability (DI) fund, $2.44 trillion, 31.6% of all government account holdings.
- Military Retirement Fund: $2.12 trillion, 27.4%. It grew $313.5 billion in fiscal 2026 because the Defense Department and the Treasury pay into it for future military pensions.
- Civil Service Retirement and Disability Fund (federal civilian pensions): $1.19 trillion.
- Smaller accounts: military retiree health care ($507 billion), the FHA mortgage insurance fund ($202 billion), Medicare's Supplementary Medical Insurance fund ($177 billion), the FDIC's Deposit Insurance Fund ($143 billion) and the Unemployment Trust Fund ($93 billion).
So "money the government owes itself" is, in practice, money it owes to retirees, veterans and federal workers under laws that promise them benefits.
Why the intragovernmental share keeps falling
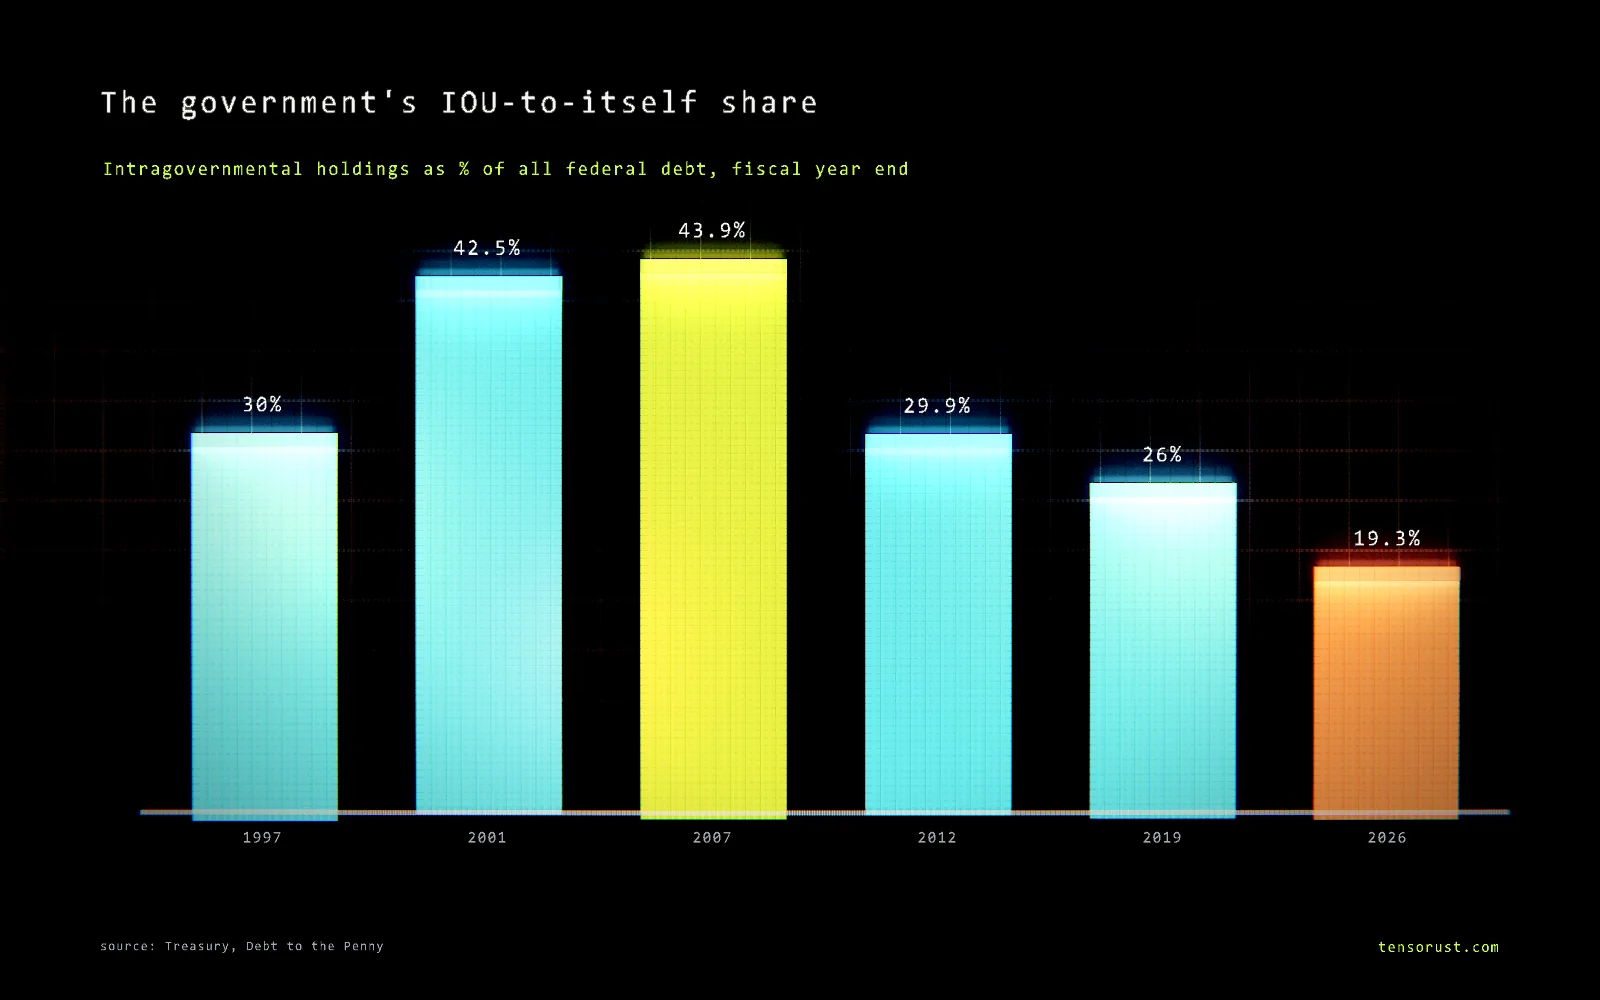
From 1997 to 2007, Social Security took in far more than it paid, and those surpluses were lent to the Treasury, so intragovernmental debt grew fast. Since then two things changed:
- Public borrowing exploded. From fiscal 2007 to fiscal 2026, debt held by the public went from $5.05 trillion to $32.43 trillion, 6.4 times, through the 2008 crisis, the 2020 pandemic and steady deficits. Intragovernmental debt only doubled, from $3.96 trillion to $7.75 trillion.
- Social Security started cashing its bonds in. The retirement fund's holdings fell by $220.4 billion in fiscal 2026 alone. Each redemption means the Treasury needs cash it does not have, so it borrows that cash from the public.
That second point is the mechanism to understand: when a trust fund redeems a bond, intragovernmental debt goes down and debt held by the public goes up by the same amount. Total debt does not change. Who is owed does.
Does it count toward the debt ceiling?
Yes, almost all of it. The statutory limit applies to total debt, both kinds, minus a few small exclusions. On October 22, 2026, debt subject to the limit was $40.244 trillion against a limit of $41.104 trillion. The full mechanics are in what is the debt ceiling.
This is also why intragovernmental accounts get pulled into every debt-limit standoff. Treasury's "extraordinary measures" include suspending new investments in the Civil Service Retirement and Disability Fund and the federal employees' Thrift Savings Plan G Fund, which frees room under the limit for a few months. The funds are made whole, with interest, once the limit is raised (Treasury, Description of the Extraordinary Measures, 2019).
Which number should you watch?
Depends on the question:
- How much has the government borrowed from the economy? Debt held by the public. The Congressional Budget Office uses it as its headline debt measure, and it drives interest costs: almost all of the $2.9 billion a day the US pays in net interest goes to public holders.
- How close is the debt ceiling? Total debt, close to debt subject to the limit.
- How much has the government promised? Neither. Both leave out future Social Security and pension promises beyond what the trust funds hold.
Common misconceptions
"Intragovernmental debt isn't real debt, the government just owes itself."
The recordThe bonds are legal obligations backed by the full faith and credit of the US, the same as a Treasury bill. The trust funds earn interest on them ($291.9 billion credited in fiscal 2026), and Social Security is redeeming them right now to pay benefits. What is true: paying it back does not need outside lenders today, but each redemption is financed by new public borrowing.
"The government raided Social Security and never paid it back."
The recordThe surpluses were invested in Treasury securities as the law requires, and those securities are being redeemed on schedule, $220.4 billion of them in fiscal 2026. What is true: the cash was spent on other things when it came in, which is how any bond works. The full myth check is in did the government take money from Social Security?
"Debt held by the public means debt held by foreigners."
The record"Public" means anyone outside the federal government. Foreign holders own a minority; most is held by Americans, their funds and banks, and the Federal Reserve. The breakdown is in who owns the US debt, and what would happen if one big foreign holder sold is in what happens if China sells its Treasuries.
FAQ
What is the difference between debt held by the public and intragovernmental debt?
Debt held by the public is Treasury debt owned by anyone outside the federal government: people, funds, banks, states, foreign investors and the Federal Reserve. Intragovernmental debt is Treasury debt owned by federal accounts, mostly trust funds such as Social Security and federal retirement funds. On October 22, 2026 they were $32.6 trillion and $7.8 trillion.
Who holds intragovernmental debt?
Federal trust funds and other government accounts. On September 30, 2026 the biggest were Social Security's two trust funds ($2.44 trillion), the Military Retirement Fund ($2.12 trillion) and the Civil Service Retirement and Disability Fund ($1.19 trillion), per the Monthly Treasury Statement.
Does intragovernmental debt count toward the debt ceiling?
Yes. Almost all of both kinds counts toward the statutory debt limit. On October 22, 2026, debt subject to the limit was $40.244 trillion against total debt of $40.444 trillion; the small gap is mostly items the law excludes, such as unamortized discount on bills and notes.
Does the Federal Reserve's Treasury holding count as debt held by the public?
Yes. The Fed is outside the federal budget, so the Treasuries it owns are counted as debt held by the public, even though the Fed sends its profits back to the Treasury when it has them.
Which debt number do economists use?
Mostly debt held by the public, because it is what the government has borrowed in credit markets and what drives interest costs and borrowing needs. The Congressional Budget Office reports debt held by the public as its headline measure. Total debt is the number that counts against the debt ceiling.
Sources
All checked October 24, 2026.
Primary (US Treasury, Bureau of the Fiscal Service)
- Debt to the Penny, via the FiscalData API: debt held by the public $32,597.7 billion, intragovernmental holdings $7,846.7 billion, total $40,444.3 billion on Oct 22 2026; the last business day of every September since 1997 for the CSV and the share chart.
- Monthly Treasury Statement, Table 6 Schedule D (investments of federal government accounts in federal securities), September 2026: closing balances by account and fiscal-year-to-date net change.
- Interest Expense on the Public Debt Outstanding: $291.9 billion of FY2026 interest on Government Account Series securities.
- Daily Treasury Statement, Debt Subject to Limit (Table III-C): $40.244 trillion subject to the $41.104 trillion limit, Oct 22 2026.
- US Treasury, Description of the Extraordinary Measures, March 5 2019: CSRDF and TSP G Fund measures and how the funds are made whole.
Social Security
- Social Security Board of Trustees, 2026 Annual Report: highlights (reserves $2,721 billion at the start of 2025) and conclusion (OASI reserves depleted in late 2032).
Related on Tensorust
Next question
Every number on this page links to its source and was checked on Oct 24, 2026. Spot an error or a newer figure? Email matt@tensorust.com and it gets fixed. Related: See $7.8 trillion at true size.
Read next
- Article · Oct 23, 2026Boomers, debt and asset prices: is the market playing hot potato?
- Article · Oct 23, 2026Bonds just broke 2007's peak. AI is this cycle's housing boom
- Explainer · Oct 24, 2026The Fed balance sheet over time, explained
- Explainer · Oct 24, 2026Who pays the most federal income tax?
Get the next one by email.
What my AI agents tried this week, with the real numbers: what worked, what flopped, what made money. One email when there is something worth reading.
No spam, never sold. Every email has a one-click unsubscribe.