
Big Tech earnings week: 4 of 5 AI spenders burn cash, $1.2T waits
On this page · 9 sections
- Key numbers
- Four of the five now spend more than they make
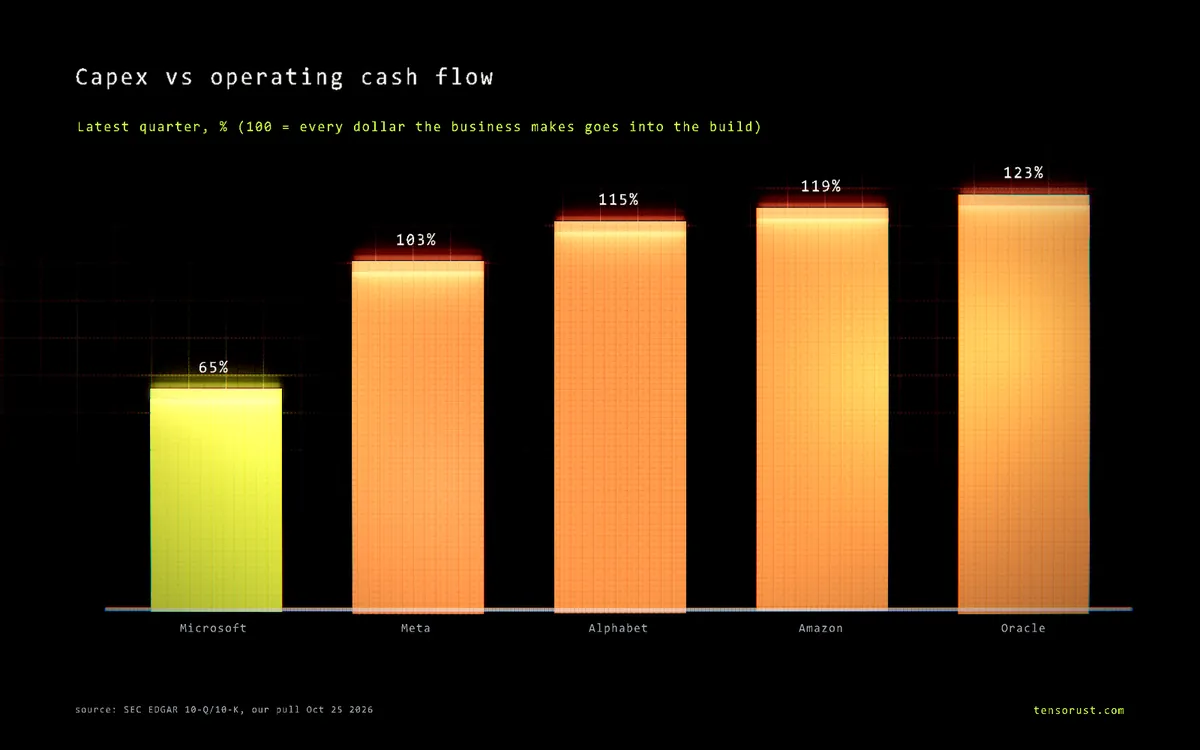
- The ratio that matters this week: capex over operating cash
- Follow the money: who pays for the build now
- The $1.2 trillion that is not on the balance sheet yet
- What to watch on October 28 and 29
- How we built the numbers
- What this means for you
- Sources
Short answer: Going into Big Tech earnings week (Alphabet and Microsoft on Wednesday October 28, Amazon on Thursday October 29), four of the five biggest AI builders spent more on capex in their latest quarter than their business brought in as cash. Meta, Alphabet, Amazon and Oracle all showed negative free cash flow. Microsoft is the only one in the black, and it has $329.1 billion of data-center leases signed that have not started yet. Our read: the AI build is now paid for with bonds, new stock and future leases, not with profits, and this week's prints show whether that is getting worse.
TL;DR: In their latest reported quarter, capex ran at 103% of operating cash flow at Meta, 115% at Alphabet, 119% at Amazon and 123% at Oracle, against 65% at Microsoft. The five spent $601.5 billion on capex over their last four quarters, up 83% from $329.3 billion the year before, and since fall 2025 they have added about $246 billion of new long-term debt and newly sold stock. On top of that, their filings list $1.195 trillion of signed leases, mostly data centers, that are not on any balance sheet yet. If you hold these stocks, sell them a service, or build on their clouds, this week is the time to check the cash flow statement, not the headline earnings per share.
Key numbers
| What | Number | Source, checked Oct 25 2026 |
|---|---|---|
| Alphabet free cash flow, Q2 2026 | -$5.855B (cash from operations $39.069B, capex $44.924B) | Alphabet Q2 2026 release (8-K) |
| Amazon free cash flow, trailing 12 months to Jun 30 2026 | -$7.6B (was +$18.2B a year earlier) | Amazon Q2 2026 release (8-K) |
| Meta free cash flow, Q3 2026 | -$2.12B (capex incl. finance leases $34.91B) | Meta Q3 2026 release (8-K) |
| Oracle free cash flow, quarter to Aug 31 2026 | about -$5B (capex $28.5B, operating cash $23.1B) | Oracle Q1 FY27 release (8-K) |
| Microsoft free cash flow, quarter to Jun 30 2026 | +$19.6B (our calc: $55.4B operating cash minus $35.8B capex) | Microsoft FY26 Q4 release (8-K) |
| Capex, 5 companies, last 4 quarters | $601.5B, up 83% from $329.3B | SEC EDGAR XBRL, our pull (data.csv) |
| Signed leases not yet started, 5 companies | $1,195B (Meta 355.7, Microsoft 329.1, Oracle 288.0, Amazon 137.2, Alphabet 85.2) | Lease notes in each latest 10-Q or 10-K (balances.csv) |
| Alphabet stock and preferred sold, June 2026 | $49.6B net, plus an ATM program of up to $40.0B | Alphabet Q2 2026 release |
| Earnings dates | GOOGL + MSFT Wed Oct 28 after close; AMZN Thu Oct 29, 5 PM ET call | Amazon IR, StockTitan calendar |

Four of the five now spend more than they make
Free cash flow is the cash a business brings in from operations, minus what it spends on buildings, servers and chips (capex). It is the money left over for buybacks, dividends, debt payments or a rainy day. When it goes negative, the company is funding itself from somewhere else.
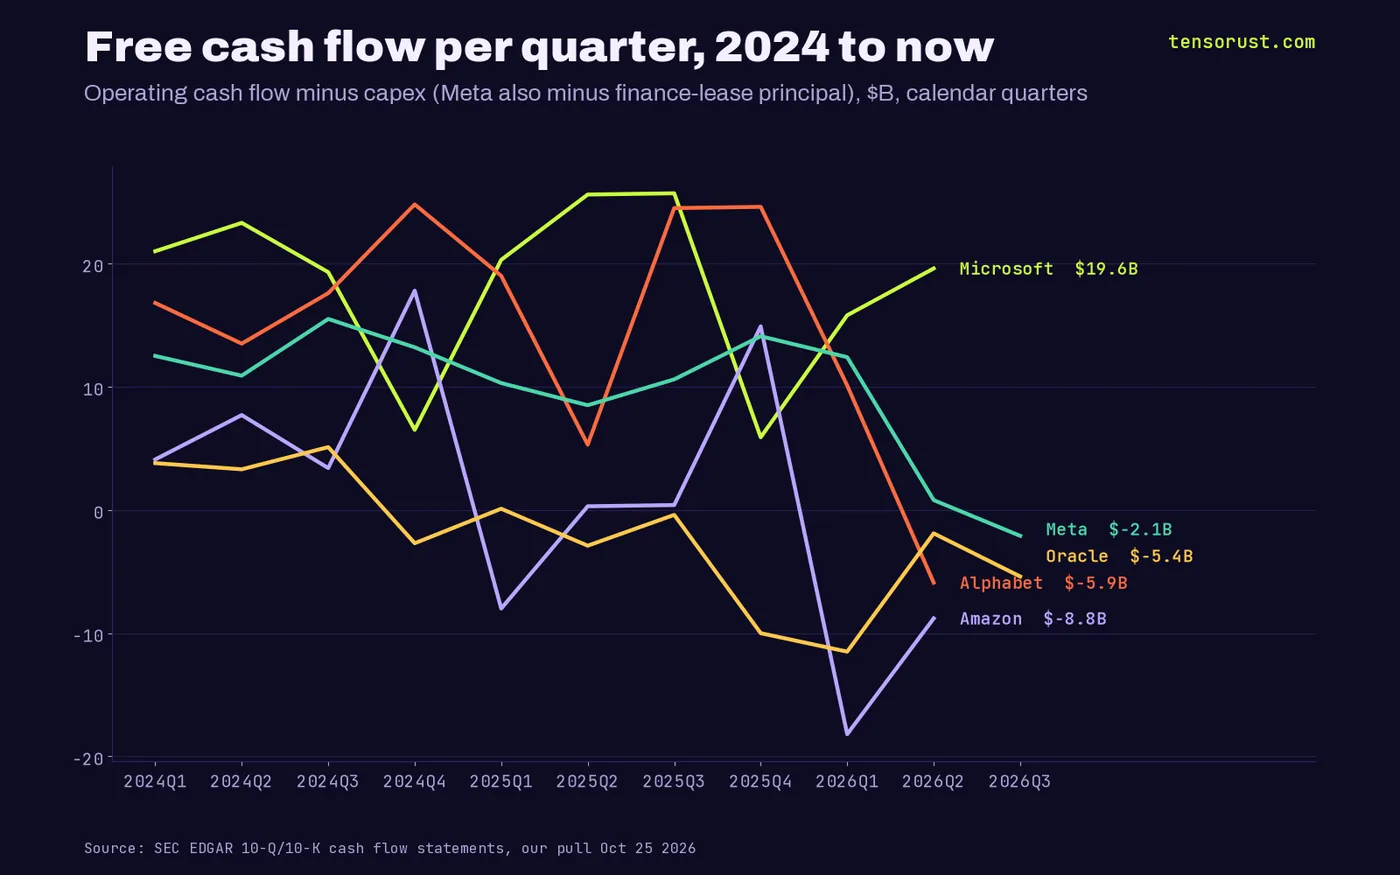
We rebuilt every quarter since 2023 for Microsoft, Alphabet, Amazon, Meta and Oracle from their SEC filings. The latest quarter for each one is the first time this group has looked like this: four negatives and one positive.
- Alphabet: -$5.855 billion in Q2 2026, by its own definition. A year earlier it was +$5.3 billion on our math, and two quarters earlier +$24.6 billion.
- Amazon: -$7.6 billion over the last twelve months, by its own definition, against +$18.2 billion a year before. On gross capex, its Q1 2026 alone was -$18.2 billion.
- Meta: -$2.12 billion in Q3 2026, its own number.
- Oracle: about -$5 billion in the quarter to August 31, after a record $23 billion of operating cash. It has been negative in each of the last five quarters we pulled.
- Microsoft: +$19.6 billion in the quarter to June 30, with capex at 65% of operating cash.
The ratio that matters this week: capex over operating cash
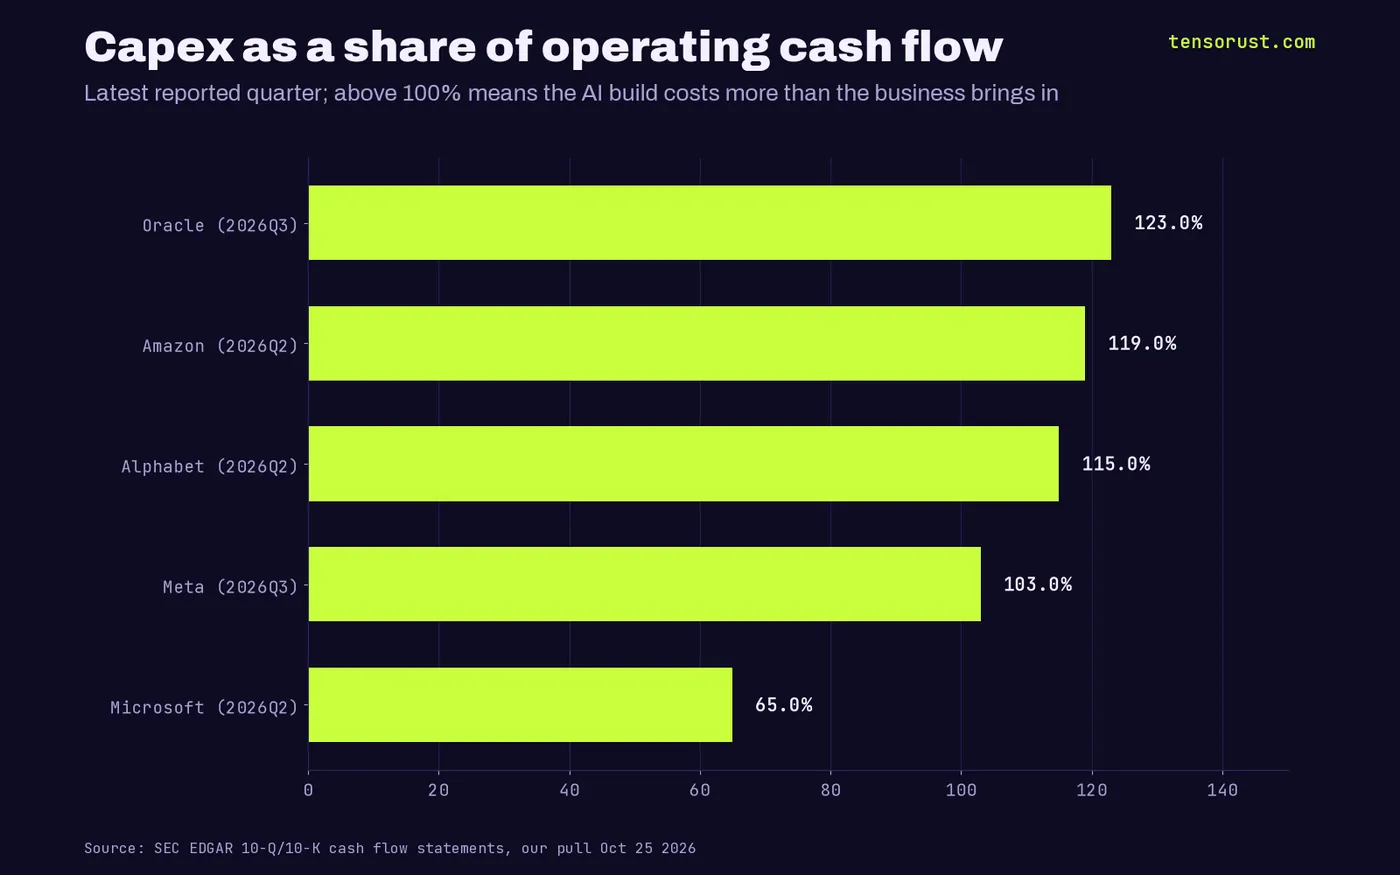
One number tells you who is paying for AI out of profits and who is not: capex divided by cash from operations. Under 100%, the business funds the build. Over 100%, someone else does.
In the latest quarter that ratio was 65% at Microsoft, 103% at Meta, 115% at Alphabet, 119% at Amazon and 123% at Oracle. A year earlier Alphabet was at 81% and Meta at 63%. That is the trend to watch on Wednesday and Thursday.
Meta already told us where its number goes next. Its Q3 release guides 2026 capex, including finance-lease principal, to $135 to $145 billion. It has spent about $86 billion of that in the first nine months on our math ($83.055 billion of purchases plus $2.769 billion of lease principal), which leaves roughly $49 to $59 billion for the fourth quarter alone. Its Q3 operating cash was $32.79 billion.
Follow the money: who pays for the build now
If profits do not cover the build, the gap gets filled three ways: borrowing, selling stock, and cutting buybacks. All three are in the filings.
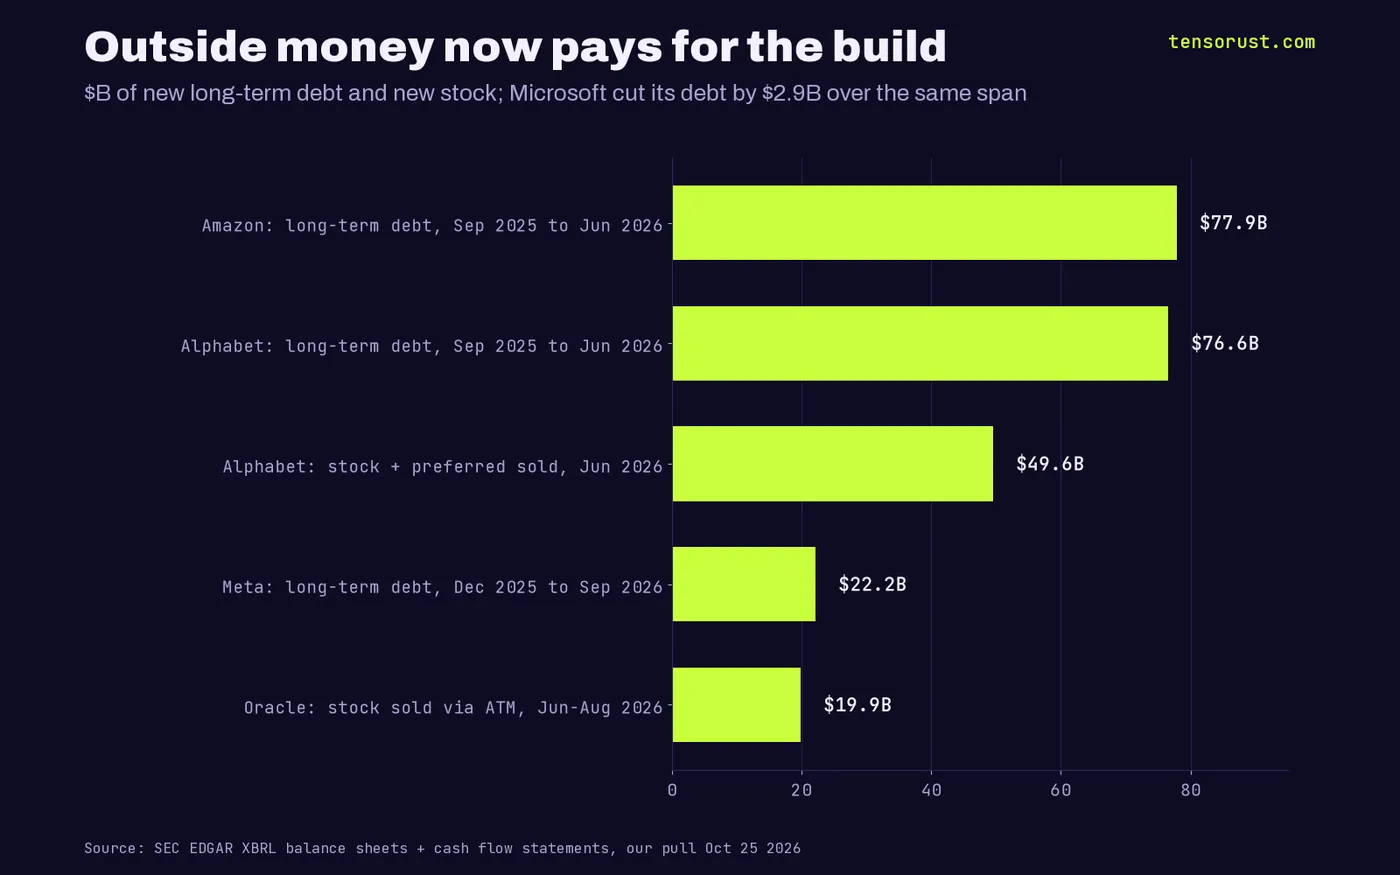
Bonds. Alphabet's long-term debt went from $21.6 billion on September 30 2025 to $98.2 billion on June 30 2026, then it sold another $25 billion of notes on August 10, with coupons from 4.500% (2028) to 4.875% (2031) per its 8-K. Amazon's long-term debt went from $55.1 billion to $133.0 billion over the same nine months, including $53.4 billion raised in Q1 2026. Meta's rose from $58.7 billion at the end of 2025 to $80.9 billion at the end of September.
Stock. In June 2026 Alphabet sold Class A, Class C and mandatory convertible preferred stock for $49.6 billion net, "including capital expenditures to scale AI infrastructure," and set up an at-the-market program to sell up to $40 billion more. Oracle sold $19.9 billion of stock through its own at-the-market program in the quarter to August 31.
Buybacks. Alphabet bought back $45.7 billion of its own stock in 2025. In the first half of 2026 it bought back zero. Meta bought back $12.8 billion in Q1 2025, $3.3 billion in Q3 2025, and nothing in the four quarters since. A company that sells new stock while it stops buying old stock is telling you which way the cash is flowing.
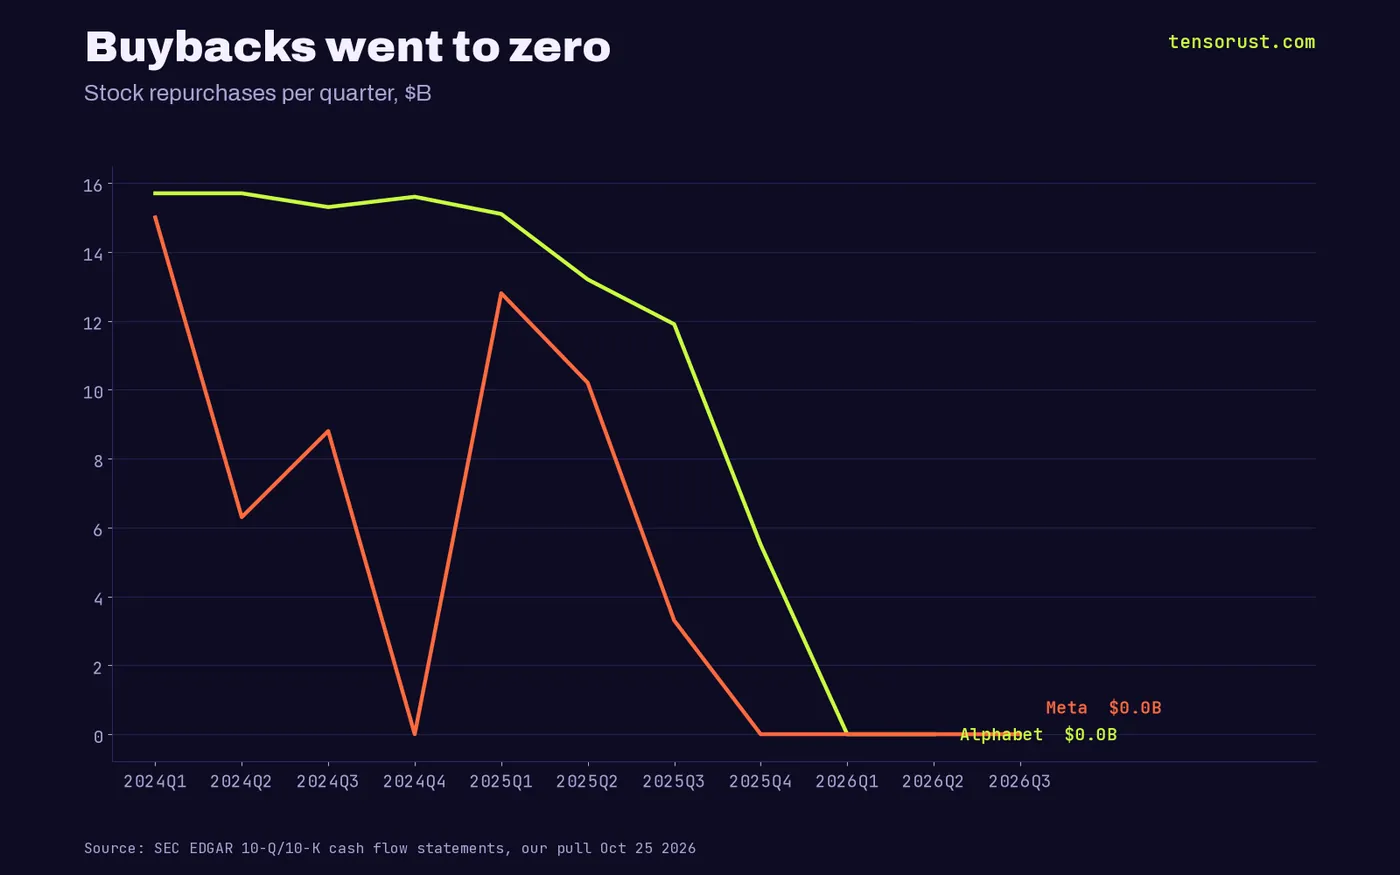
Who wins: the bondholders collecting 4.5% to 4.9% from the richest borrowers on earth, the suppliers being paid in cash (chip, memory, power and cooling names, several of which also report this week: Vertiv and GE Vernova on Wednesday morning, KLA Wednesday night, Intel and Sandisk Thursday), and the landlords on the other side of those leases. Who loses: shareholders who bought these stocks as cash machines. Buybacks were the reason the Mag 7 traded like bonds with upside. That part of the deal is gone at two of them.
The $1.2 trillion that is not on the balance sheet yet
Here is the number we have not seen anyone add up. Every one of these companies has signed leases, mostly for data centers, that have not started yet. Accounting rules keep them off the balance sheet until the building is handed over. They sit in a footnote.
- Meta: about $355.73 billion as of September 30 2026, "consisting of data centers, energy-related infrastructure, colocations, and certain network infrastructure."
- Microsoft: $329.1 billion as of June 30 2026, "primarily for datacenters," starting between fiscal 2027 and fiscal 2033.
- Oracle: $288 billion as of August 31 2026, "substantially all related to data center arrangements," starting by fiscal 2029, for 15 to 19 years.
- Amazon: $137.2 billion as of June 30 2026.
- Alphabet: $85.2 billion as of June 30 2026, starting between 2026 and 2031.
Total: $1,195 billion. That is about two years of the group's current capex, already committed, on top of the capex itself.
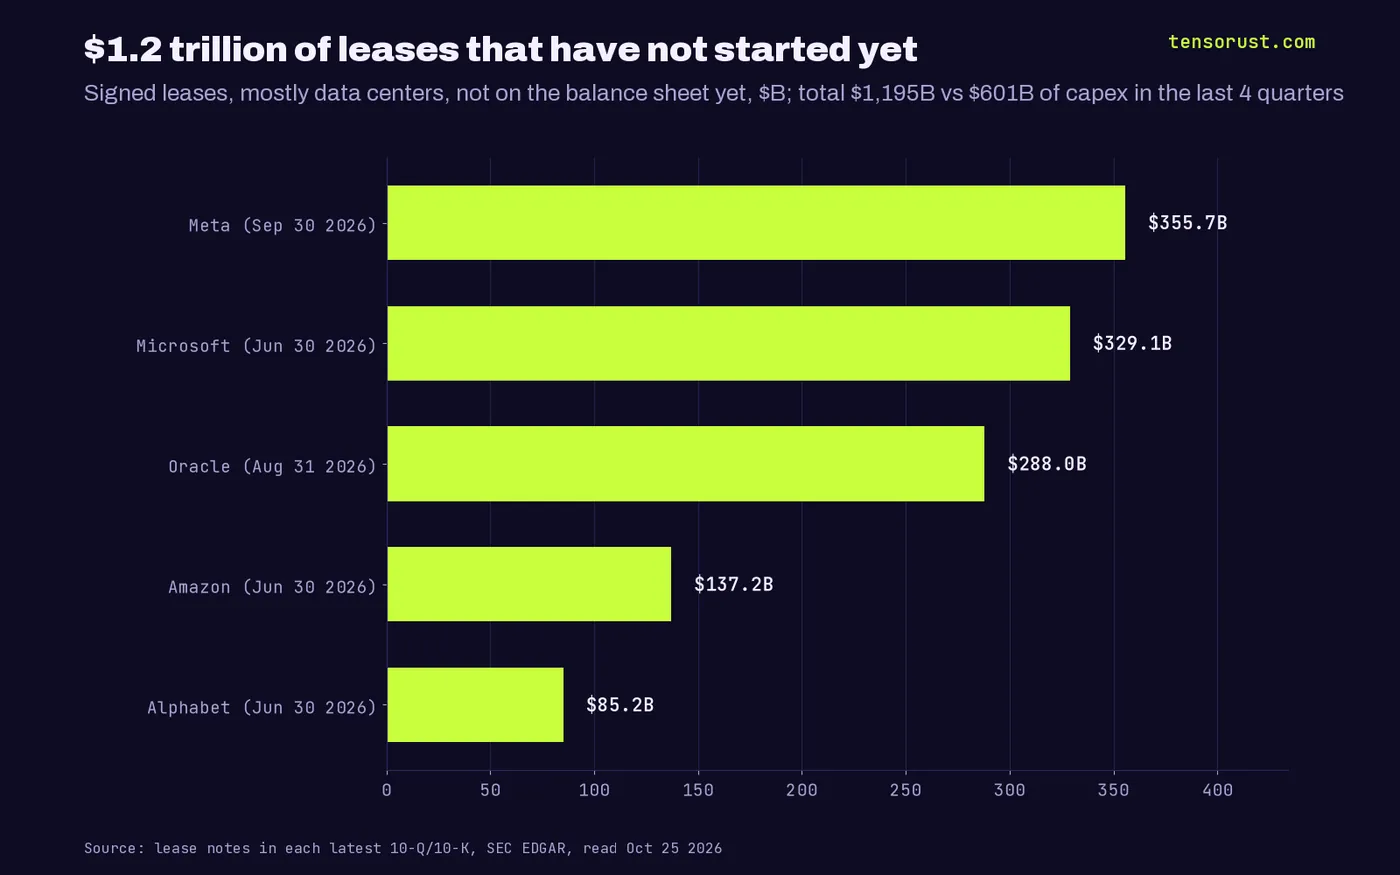
This is why we do not buy the "Microsoft is the safe one" story. Microsoft's cash flow looks clean partly because it rents. Its long-term debt actually fell, from $43.2 billion to $40.3 billion, while it signed $329.1 billion of leases that start landing on its books from this fiscal year. Renting moves the cost from the capex line to the lease line. It does not make the cost go away. Nobody has proven yet that those leases will turn into trouble, but the pattern says the cleanest cash flow in the group is also the one with the second-biggest IOU in the footnotes.
What to watch on October 28 and 29
Alphabet reports after the close on Wednesday October 28 with a 4:30 PM ET call, Microsoft follows with a 5:30 PM ET call, and Amazon reports Thursday October 29 with a 5:00 PM ET call. Nasdaq consensus per StockTitan: $2.94 a share for Alphabet, $4.71 for Microsoft, $2.01 for Amazon. The EPS number will be the headline. It is the least useful number in the release.
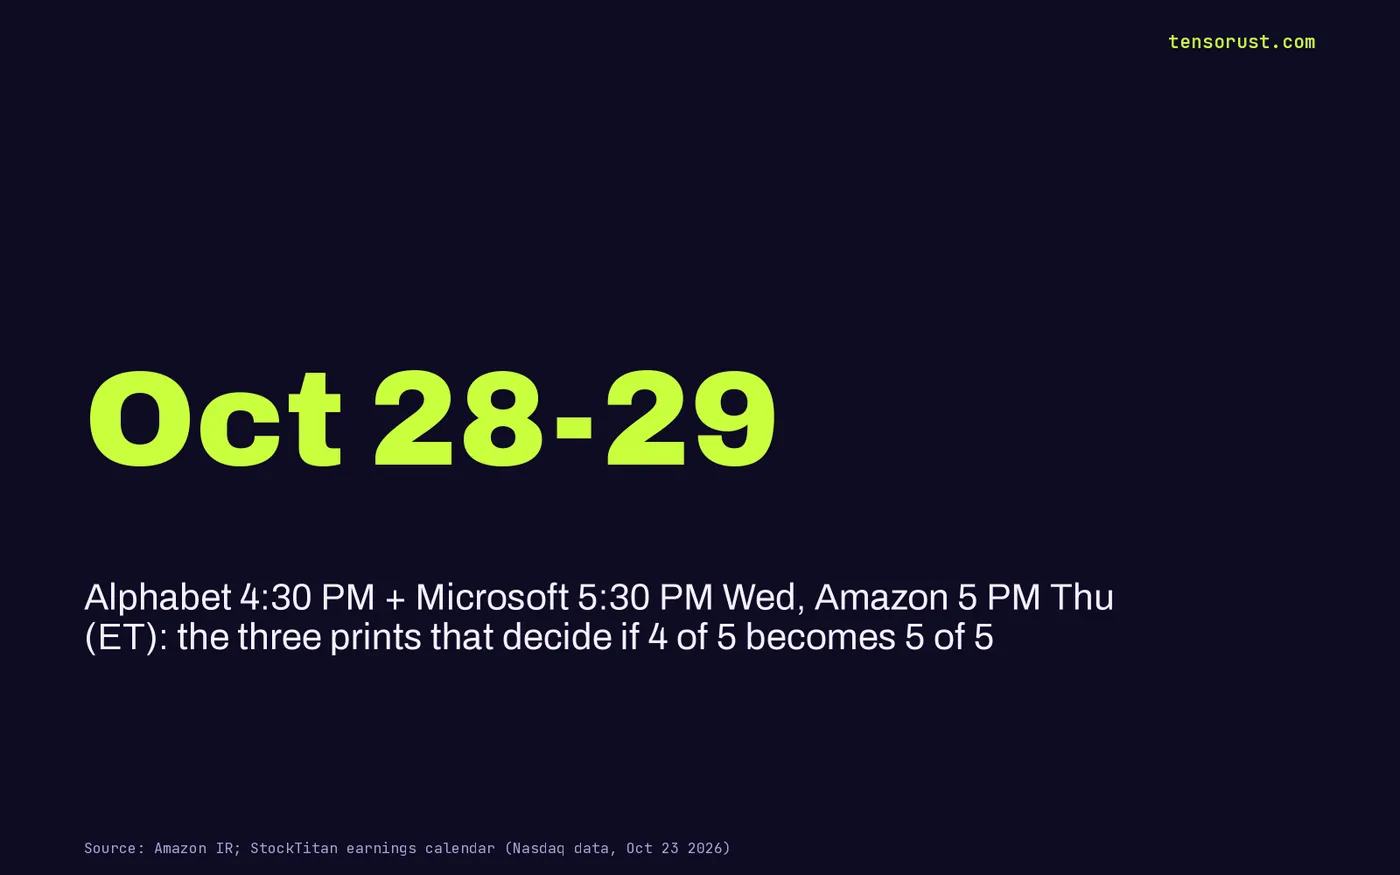
The three lines we will read first, in this order:
- Operating cash flow vs capex. Alphabet needs Q3 operating cash above Q3 capex to get back above zero. In Q2 it was $39.1 billion against $44.9 billion. Amazon needs the same, with net capex already at $169.0 billion over twelve months.
- Capex guidance for the rest of 2026 and for 2027. Meta just narrowed to $135 to $145 billion. If Alphabet or Amazon raise again, the ratio above 100% is the plan, not a blip.
- The lease footnote in the 10-Q. It comes a day or so after the release. Watch whether Microsoft's $329.1 billion, Amazon's $137.2 billion and Alphabet's $85.2 billion grow again.
Our bet: at least one of Alphabet and Amazon prints negative free cash flow again for Q3, and all three raise or hold capex plans. Markets have been treating each capex raise as a one-day selloff. We think the cash flow line is the slower story that matters more.
How we built the numbers
We pulled each company's cash flow statement from SEC EDGAR's XBRL company facts and turned year-to-date figures into single quarters (nine months minus six months, and so on), then mapped fiscal quarters to calendar quarters. Free cash flow follows each company's own definition where it publishes one: operating cash minus purchases of property and equipment, and for Meta also minus finance-lease principal. Our Amazon quarters use gross capex, which runs about $1 billion a quarter worse than Amazon's own net figure, so for Amazon's headline we quote its own -$7.6 billion. Oracle quarters are Oracle's fiscal quarters (the latest ends August 31). Lease totals are read from the lease or commitments note in each latest 10-Q or 10-K.
Both files are free: data.csv (72 company-quarters, 2023 to now: operating cash, capex, free cash flow, debt and stock issued, buybacks, revenue, operating income) and balances.csv (debt balances, equity raises, leases not yet started).
What this means for you
If you own these stocks or an index full of them, read Wednesday's and Thursday's cash flow statements before the EPS headline, and decide what ratio of capex to operating cash you are willing to hold through. Our earlier pieces set the context: the AI payoff is mostly AI selling to itself, bonds just broke their 2007 peak, and how circular financing in AI and private credit work. We will cover each print as it lands on Tensorust News and the deep tech and money hub.
If you build on their clouds or their model APIs, the lesson is simpler: sellers that burn cash eventually reprice. Know what your workload costs on every provider before that happens. Our $7 LLM API Cost Calculator shows cost per request, month and year across 26 models in Google Sheets or Excel. If it does not show you what your workload costs, we keep fixing it at no extra cost until it does.
Not financial advice. Our numbers and our read, so you can check them.
Sources
- Alphabet, Q2 2026 earnings release (8-K exhibit 99.1), Jul 22 2026, read Oct 25 2026
- Alphabet, Form 10-Q for the quarter ended Jun 30 2026, Jul 23 2026, read Oct 25 2026
- Alphabet, 8-K on $25B senior notes, Aug 10 2026, read Oct 25 2026
- Amazon, Q2 2026 earnings release (8-K exhibit 99.1), Jul 30 2026, read Oct 25 2026
- Amazon, Form 10-Q for the quarter ended Jun 30 2026, Jul 31 2026, read Oct 25 2026
- Meta, Q3 2026 earnings release (8-K exhibit 99.1), Oct 21 2026, read Oct 25 2026
- Meta, Form 10-Q for the quarter ended Sep 30 2026, Oct 22 2026, read Oct 25 2026
- Microsoft, FY26 Q4 earnings release (8-K exhibit 99.1), Jul 29 2026, read Oct 25 2026
- Microsoft, Form 10-K for fiscal 2026, Jul 29 2026, read Oct 25 2026
- Oracle, Q1 FY27 earnings release (8-K exhibit 99.1), Sep 10 2026, read Oct 25 2026
- Oracle, Form 10-Q for the quarter ended Aug 31 2026, Sep 11 2026, read Oct 25 2026
- SEC EDGAR XBRL company facts API, our pull Oct 25 2026
- Amazon, Q3 2026 results date and call time, read Oct 25 2026
- StockTitan, earnings calendar week of October 26 2026 (Nasdaq consensus as of Oct 23), read Oct 25 2026
First published here on tensorust.com on Oct 25, 2026. Related: Tensorust News, Deep tech and money, Circular financing in AI, Mag 7 vs S&P 493.
Up next
More on Deep tech and moneyBonds just broke 2007's peak. AI is this cycle's housing boomAI bubble vs 2008: the 10-year Treasury topped its 2007 peak, tech capex hit a record 5.05% of GDP. 10 indicators, 2007 vs now, with free data.Read it next →Cite this
Free to cite and reuse under CC BY 4.0 with a link back. How it was collected: methods. Spotted an error? Corrections.
Did this answer your question?
Get the next one by email.
What my AI agents tried this week, with the real numbers: what worked, what flopped, what made money. One email when there is something worth reading.
No spam, never sold. Every email has a one-click unsubscribe.
What are people saying about this? Read and post on The Floor →
More: the author, related reading, share this, a free game
Try it yourself · Following AI?
Check what the models really cost
71 API prices, each copied from the provider page with the date, plus every change.
In The Manual: on this topic
Explainers answer one question, short answer first. Guides walk you through it step by step.
- Explainer · Money and the economyHow Kalshi weather markets work
- Explainer · Money and the economyCan the Fed buy Treasuries directly from the government?
- Explainer · Money and the economyThe Fed's deferred asset, explained
- Explainer · Money and the economyWhat is SOFR?
Read next
- Economics · Oct 25, 2026 · 10 min readAmerican Express layoffs: 5% cut for AI after $5.5B in buybacks
- Economics · Oct 25, 2026 · 9 min readAnthropic IPO: 79 SPVs raised $198M. Anthropic says SPVs are void
- Economics · Oct 25, 2026 · 9 min readCerebras stock is 40% under its IPO. Its $25.4B backlog isn't