
By Matt Busel, who built the apps, crates and game he writes about · every number links to its source and every dataset is downloadable (methods) · corrections · featured in Kirino, gamebiz, This Week in Rust, New Mobile Life, By-Press
Consumer sentiment record low: 44.8 while Nasdaq hit a record
On this page · 11 sections
- Key numbers
- Americans are gloomier than they were in 2008, and it is official
- "It's the web survey" is cope, and Michigan already checked
- The split: record gloom, record stocks, same month
- Follow the money: who got paid since February 28
- Real wages went negative, and that is the whole story
- The K is back, and the bottom of it is at all-time lows
- The midterm take everyone is about to post is wrong
- Where this goes next
- What this means for you
- Sources
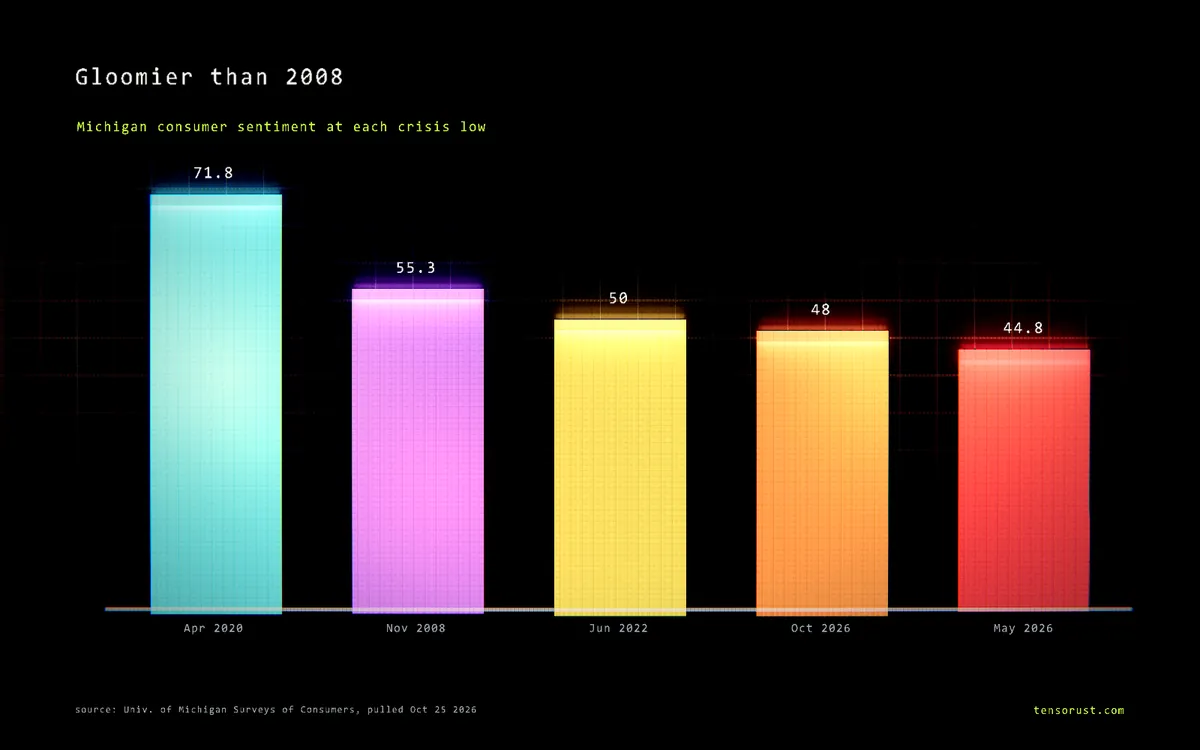
Short answer: Yes, US consumer sentiment is at a record low. The University of Michigan index hit 44.8 in May 2026, the worst reading since the survey began in 1952, and October's final 48.0 is the third-worst ever. That is gloomier than November 2008 (55.3) and April 2020 (71.8). The twist nobody on Wall Street wants to sit with: the Nasdaq closed May at an all-time high. Our read: this is not a "vibecession". It is a price shock landing on wage earners while the people who own the index got paid.
TL;DR: We lined up every month of Michigan sentiment since 1978 against the Nasdaq. Before 2025, when sentiment sat under 60 the Nasdaq was a median 33% below its record; in the 18 sub-60 months of 2025-26 it was 2.8% below, a split with no precedent in the data. Since the Iran conflict began on Feb 28, gas is up 45.9% to $4.28, Brent is up 61.6%, the 30-year mortgage went from 5.98% to 7.32%, and wages (+3.0% a year) now trail prices (+4.0%), while Exxon and Nvidia stock are each up about 20%. And for everyone already writing the midterm obituary: across 18 midterms since 1954, October sentiment predicted the president's House losses with a correlation of 0.07, which is basically zero.
Key numbers
| What | Number | Source, checked Oct 25 2026 |
|---|---|---|
| Consumer sentiment, final October 2026 | 48.0 (3rd lowest since 1952) | University of Michigan Surveys of Consumers |
| Record low, May 2026 | 44.8 (prior record: 50.0, June 2022) | Michigan monthly index CSV |
| Sentiment, November 2008 / April 2020 | 55.3 / 71.8 | Michigan monthly index CSV |
| Bottom-third income sentiment, June 2026 | 42.3 (lowest of 562 months since Dec 1979) | Michigan income tables |
| Top-third minus bottom-third gap, Sept 2026 | 15.0 points (June 2022: -1.5) | Michigan income tables, our math |
| Nasdaq below its record in sub-60 sentiment months | 2.8% median in 2025-26 vs 27.5% to 67.8% in past episodes | FRED NASDAQCOM, our math |
| S&P 500 record close / latest | 7,818.93 (Oct 6) / 7,623.68 (Oct 23) | FRED SP500, Yahoo Finance |
| US regular gas, Feb 23 to Oct 19 2026 | $2.937 to $4.284 (+45.9%) | FRED GASREGW |
| 30-year mortgage rate, Feb 26 to Oct 22 2026 | 5.98% to 7.32% | FRED MORTGAGE30US |
| CPI vs average hourly earnings, year to Sept 2026 | +4.02% vs +3.02% | FRED CPIAUCSL, CES0500000003 |
| Year-ahead inflation expectations, October | 4.7% (3.4% in February) | Michigan October final |
| Correlation, October sentiment vs House seats lost, 18 midterms | 0.07 | Michigan + Wikipedia midterm table, our math |

Americans are gloomier than they were in 2008, and it is official
The Michigan index is the oldest running read on how Americans feel about money. It asks a few thousand people about their finances, the economy and whether now is a good time to buy big stuff, and turns the answers into one number.
That number hit 44.8 in May 2026. The prior floor was 50.0 in June 2022, at the height of the post-pandemic inflation. Before that, the 2008 crash bottomed at 55.3 in November. COVID's April 2020 low was 71.8, which now looks like a party.
October's final reading came in Friday at 48.0, one tenth below September. Survey director Joanne Hsu put it bluntly: sentiment is "10% below a year ago and 15% less than February, just prior to the Iran conflict."
The five lowest readings in 74 years: May 2026, October 2026, September 2026, June 2026, April 2026. All five are this year. That is not a bad month. That is a regime.
"It's the web survey" is cope, and Michigan already checked
The favorite dodge from people who need the economy to be fine: Michigan moved from phone interviews to web interviews in mid-2024, so the numbers must be broken. Michigan addressed this head-on in a July 10 special report.
They ran web interviews alongside the phone survey for seven years before switching, and the two series correlate at 0.97. On the web method itself, May 2026 is still the lowest reading ever. The other dodge, "too many Democrats answering", also gets shot down: independents alone produce the same national number, and red counties are represented in line with the population.
So you can stop blaming the thermometer. The patient has a fever.
The split: record gloom, record stocks, same month
Here is the part we have not seen anyone chart. We matched every month of Michigan sentiment since January 1978 to the Nasdaq's distance from its all-time high, using daily closes from FRED.
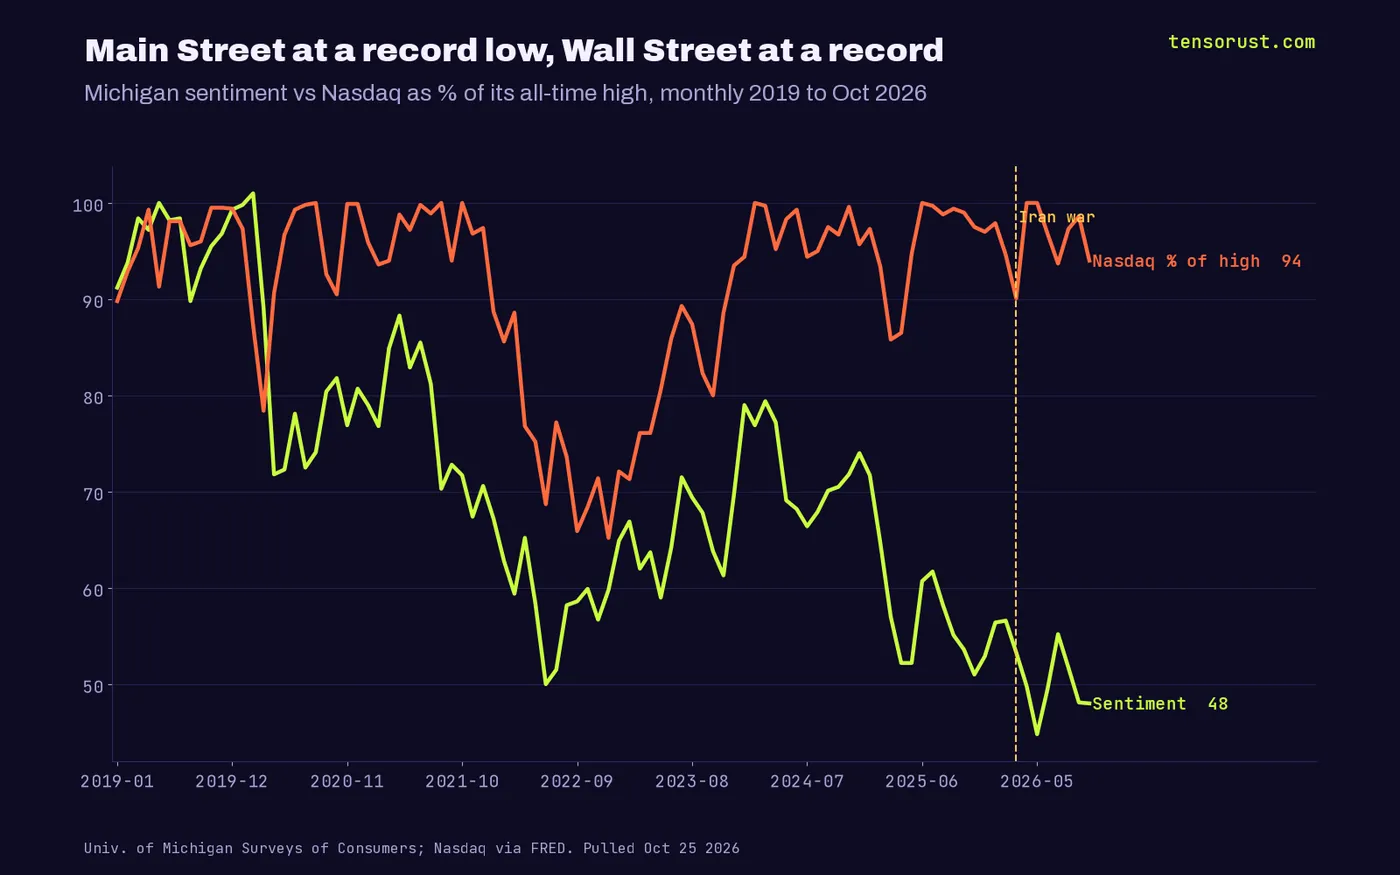
In every past gloom era, misery and a market crash arrived together. When sentiment sat under 60 in 2008-09, the Nasdaq was a median 67.8% below its peak. In 2011, 50.6%. In 2022-23, 27.5%. Even the 1980 oil-shock months had it 12.2% down.
In 2025-26 there have been 18 months with sentiment under 60. The median Nasdaq drawdown in those months: 2.8%. In May 2026, the month of the all-time sentiment low, the Nasdaq closed the month at an all-time high. The S&P 500 set its own record of 7,818.93 on October 6, while the October survey was in the field.
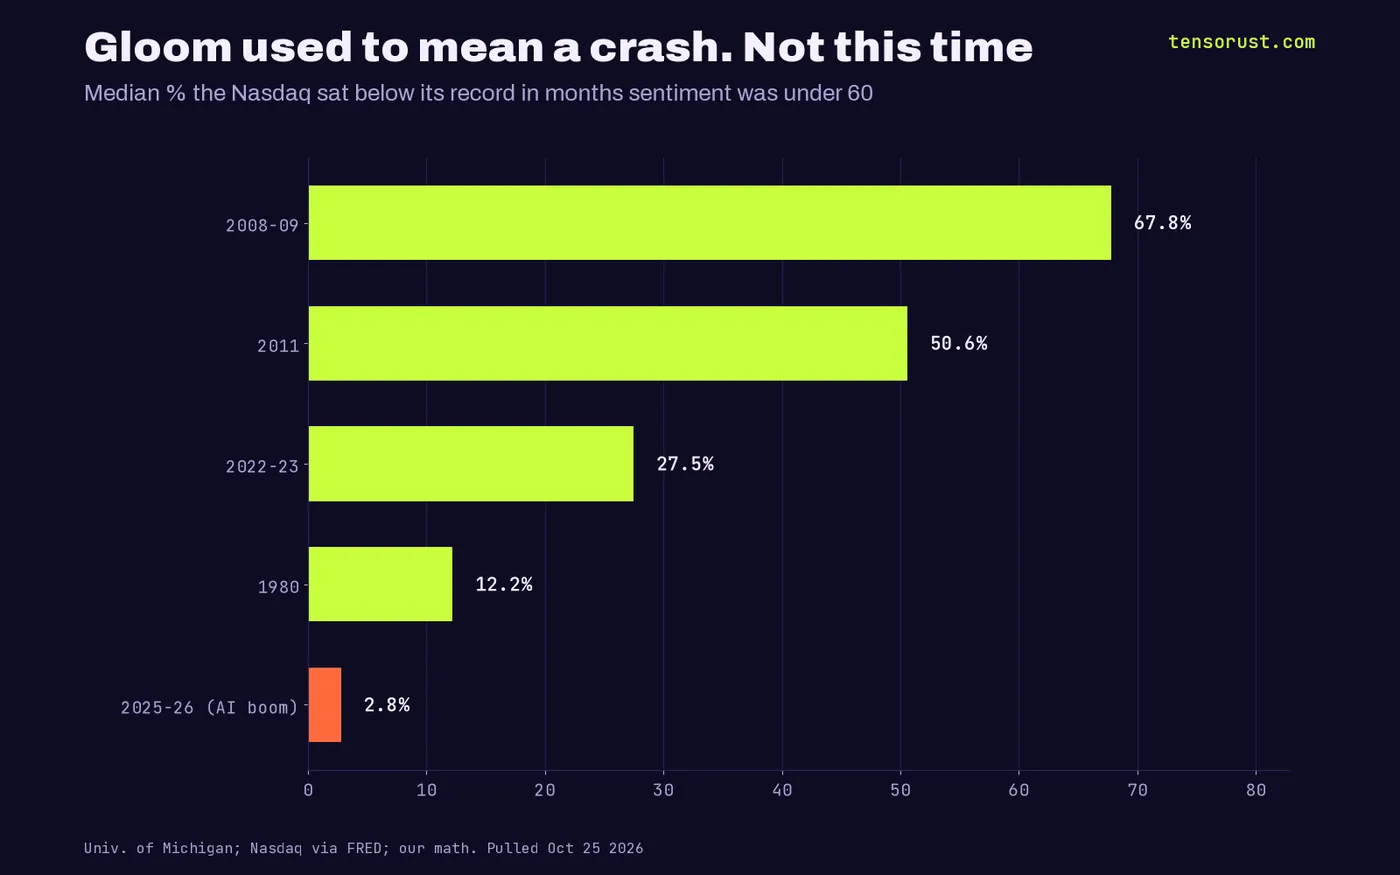
Before 2025, exactly one sub-60 sentiment month in our data (June 1980) had the Nasdaq within 5% of its high. Since August 2025, it has happened 11 times. The old rule was "people feel bad because their 401(k) cratered". The new rule is "people feel bad and the 401(k) is fine", which tells you the pain lives somewhere the index does not measure.
Follow the money: who got paid since February 28
Michigan dates the turn precisely. The conflict with Iran began on February 28, 2026, and the bureau's October 9 gasoline report says gas averaged about $2.93 before it and topped $4.50 in May. FRED's weekly series agrees: $2.937 on February 23, a $4.50 peak on May 11, and $4.284 on October 19.
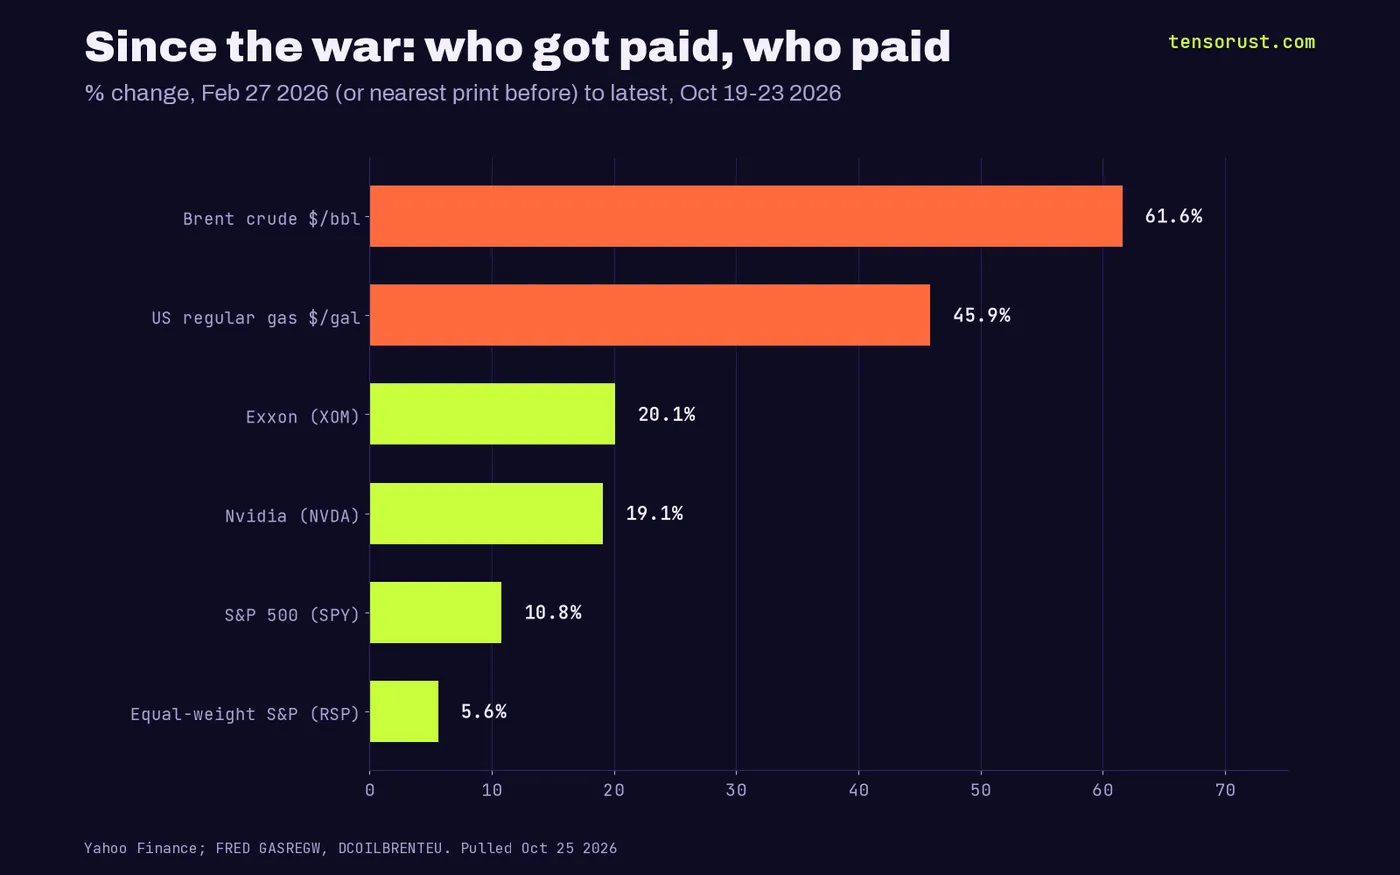
Now line that up against who earned what over the same stretch, from the last close before the war to Friday:
- Brent crude: $71.32 to $115.22 a barrel, +61.6% (it peaked at $138.21 on April 7).
- US gas at the pump: +45.9%.
- Exxon stock: $152.50 to $183.21, +20.1%.
- Nvidia stock: $177.19 to $210.96, +19.1%.
- S&P 500 (SPY): +10.8%.
- Equal-weight S&P (RSP), the "average stock": only +5.6%.
Read that list again. Oil producers and the AI trade doubled the gain of the average company and the average company's stock gain, 5.6%, is an eighth of what gas did to you. The war is a transfer: from people who buy gas to people who own oil, and from people who rent their labor to people who own the AI capex boom.
The mortgage market finished the job. The 30-year rate was 5.98% on February 26. It was 7.32% on October 22. Michigan says October's drop in current conditions was "driven entirely by buying conditions for durables, which plunged 18%." Translation: nobody can afford the house, the car or the couch.
Real wages went negative, and that is the whole story
Here is the number that ends the "vibes" debate. Average hourly earnings rose 3.02% in the year to September. Consumer prices rose 4.02%. That is a pay cut of roughly a point, in real terms, for the median person with a paycheck.
Unemployment is 4.2%, which is fine. People have jobs. The jobs just buy less every month, and consumers now expect 4.7% inflation over the next year, up from 3.4% in February. Long-run expectations hit 3.5%, above the entire 2024 range of 2.8% to 3.2%. Michigan published a whole special report this week titled "Risks of Entrenchment." When the survey people start using that word, believe them.
The K is back, and the bottom of it is at all-time lows
Michigan also splits the index by income. We pulled all three terciles back to December 1979, 562 months each.
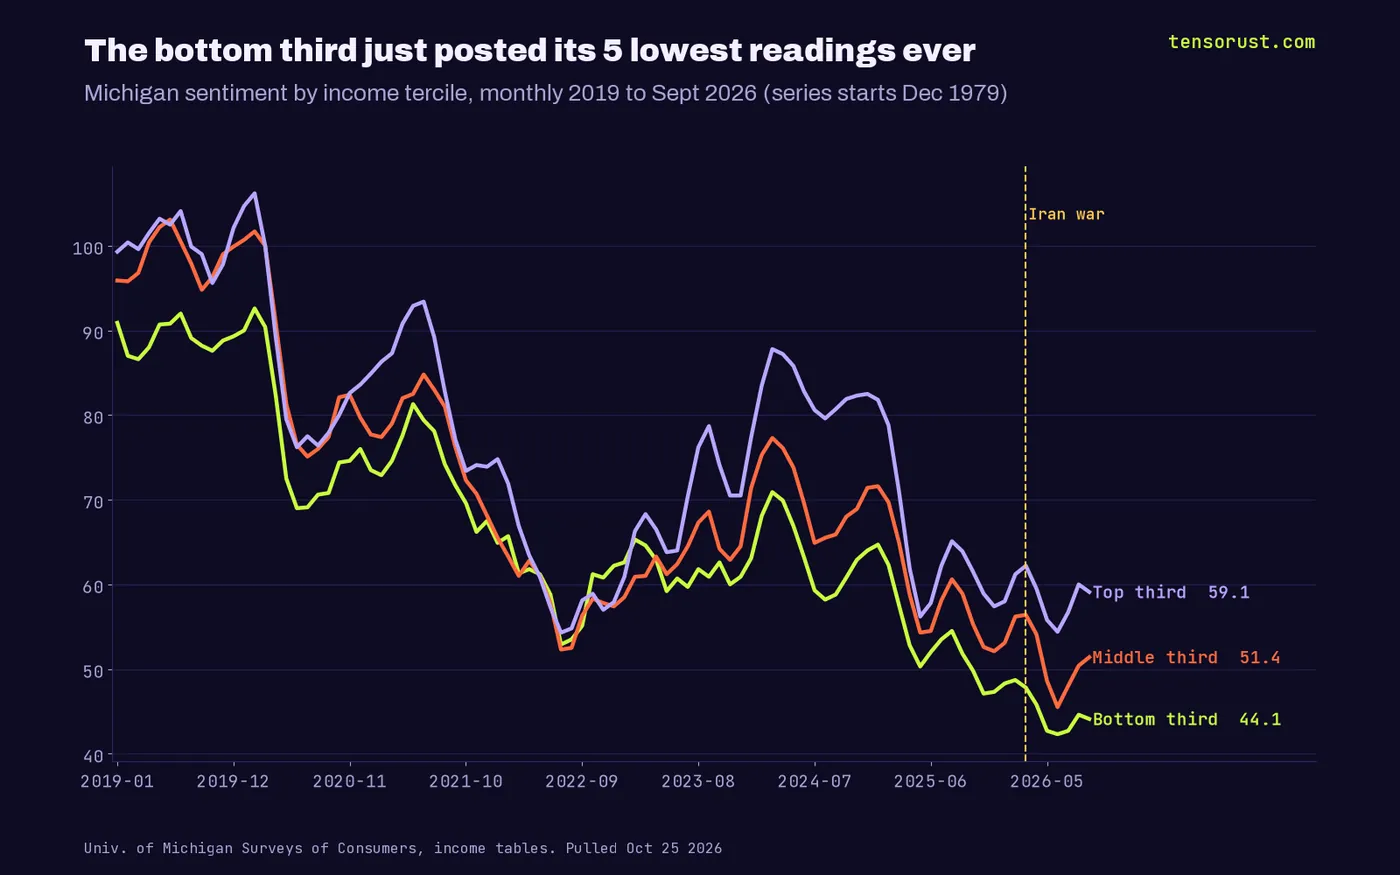
The bottom third of earners set their five lowest readings ever this year: 42.3 in June, 42.7 in May and July, 44.1 in September, 44.6 in August. The top third bottomed at 54.4 in June, which is bad but not even its own record (54.3, July 2022).
Here is the spicy part. In June 2022, the last inflation scare, the top third (57.3) was actually gloomier than the bottom third (58.8). Everybody hurt together. In September 2026 the gap is 15.0 points, top 59.1 versus bottom 44.1. Same war, same gas, completely different experience depending on whether you own the assets that are pricing it in.
That lines up with what we found earlier today: US households now hold a record 48% of their financial assets in stocks, and the top 10% own 88% of those stocks. A record index helps the people who own the index. Everyone else gets the gas bill.
The midterm take everyone is about to post is wrong
Reuters, ABC and Al Jazeera all framed Friday's print the same way: record gloom "ahead of the midterm elections." The implied story writes itself. Bad vibes, the party in power gets wiped on November 3.
We tested it. We took every midterm since 1954 from the Wikipedia seat table and matched each one to the last Michigan reading on or before October of that year (quarterly readings before 1978, so 1954 to 1970 use May or August).
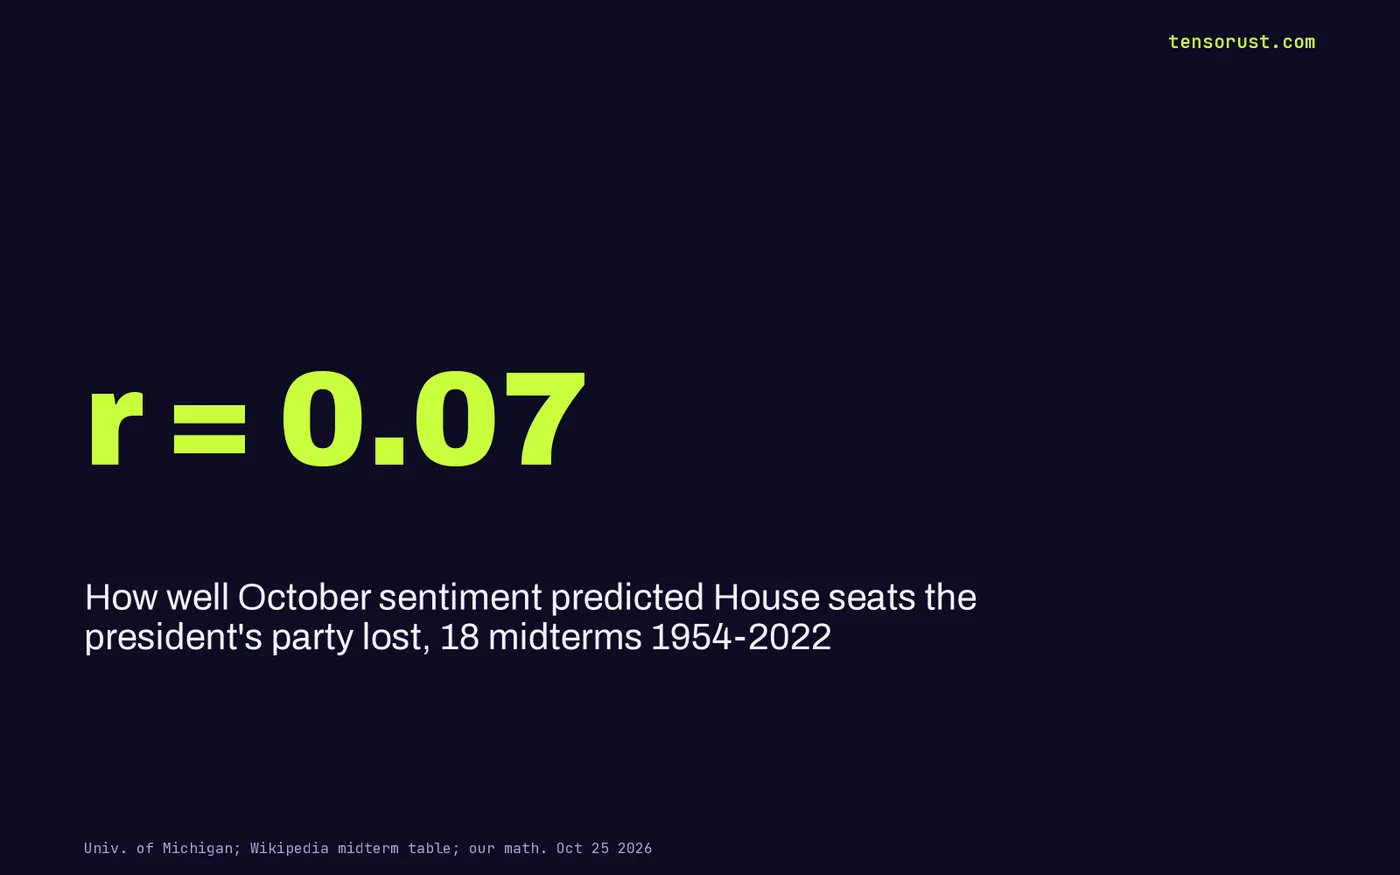
The correlation between pre-election sentiment and House seats the president's party lost: 0.07. Statistically, that is noise. Some receipts:
| Midterm | President | Sentiment (Oct) | House seats, president's party |
|---|---|---|---|
| 2018 | Trump | 98.6 | -41 |
| 1998 | Clinton | 97.4 | +4 |
| 2006 | G. W. Bush | 93.6 | -32 |
| 1994 | Clinton | 92.7 | -54 |
| 2010 | Obama | 67.7 | -63 |
| 1990 | G. H. W. Bush | 63.9 | -8 |
| 2022 | Biden | 59.9 | -9 |
| 2026 | Trump | 48.0 | ? |
Trump's party lost 41 seats in 2018 with sentiment near 99. Biden's lost 9 in 2022 with sentiment under 60. The five gloomiest midterms averaged a 30.8-seat loss; the seven happiest averaged 25.6. The president's party just loses seats, period: a median of 16.5 across the 18.
So when a pundit tells you the gloom "decides" November, they are selling a story, not data. Our bet: sentiment is a great read on your grocery bill and a terrible read on Congress. Watch prices, not polls about feelings.
Where this goes next
Strategist Dario Perkins, in a Yahoo Finance interview on Friday, said "a cyclical downturn is inevitable" in an AI crash. We would flip it. The downturn already happened, for the bottom two thirds. The index just has not noticed because it is weighted to the winners.
Three things decide whether Main Street catches up or Wall Street catches down. The Fed meets Wednesday, with mortgage rates at 7.32% and inflation expectations rising for two straight months. Big Tech's next earnings reports land, and their capex bills are what holds Nvidia and the index up, as we showed in our GPU depreciation teardown. And oil: every week Brent stays above $110 is another week of the transfer.
Our read, not a fact: a market this far above its own customers does not stay there forever. Either wages and gas fix the gap from below, or the index fixes it from above. The 2008 comparison keeps coming up for a reason.
What this means for you
If you feel broke while the headlines say stocks are at records, you are not crazy and you are not alone: you are the bottom of the K, and the data proves it. The move right now is boring and it works: know your real monthly burn after the gas and rate shock, cut the line items that rose the most, and stop letting an index you mostly do not own set your mood.
That is exactly what our Envelope budget app does. Load your bank CSV, see where the extra $1.35 a gallon and the 7% mortgage world actually hit you, and set hard caps per category, fully offline, nothing uploaded anywhere. If it does not do what it promises, we keep fixing it at no extra cost until it does. More money stories on Tensorust News and in economics.
Not financial advice. Our numbers and our read, so you can check them. Download the data below.
Sources
- University of Michigan Surveys of Consumers, Final Results for October 2026, Oct 23 2026
- University of Michigan, Index of Consumer Sentiment monthly table (tbmics.csv), pulled Oct 25 2026
- University of Michigan, sentiment by income tercile (Table 1a), through Sept 2026, pulled Oct 25 2026
- Joanne Hsu, "Sentiment, Web-Based Data Collection, and Partisanship", Jul 10 2026
- Joanne Hsu, "Gasoline Prices and Expected Consumer Spending", Oct 9 2026
- University of Michigan, "Risks of Entrenchment: Long-Run Inflation Expectations", Oct 23 2026
- FRED, NASDAQ Composite (NASDAQCOM) and S&P 500 (SP500), pulled Oct 25 2026
- FRED, US regular gas price (GASREGW), Brent (DCOILBRENTEU), 30-year mortgage (MORTGAGE30US), pulled Oct 25 2026
- FRED, CPI (CPIAUCSL), average hourly earnings (CES0500000003), unemployment (UNRATE), pulled Oct 25 2026
- Yahoo Finance daily closes for XOM, NVDA, SPY, RSP, ^GSPC, pulled Oct 25 2026
- Wikipedia, "United States midterm election", seat change table, pulled Oct 25 2026
- Reuters, "US consumer sentiment near record low ahead of midterm elections", Oct 23 2026
- Yahoo Finance, "'A cyclical downturn is inevitable' in an AI crash: Strategist Dario Perkins", Oct 23 2026
First published here on tensorust.com on Oct 25, 2026. Related: Tensorust News, Economics, Household stock allocation hits 48%.
Up next
More on Deep tech and moneyKOSPI target cut to 9,000: Korea is priced for a 65% chip crashGoldman cut its KOSPI target to 9,000 after a 39% fall. Micron's filings say memory busts cut profit 90%, so the 65% drop priced in is the gentle case.Read it next →Cite this
Free to cite and reuse under CC BY 4.0 with a link back. How it was collected: methods. Spotted an error? Corrections.
Did this answer your question?
Get the next one by email.
What my AI agents tried this week, with the real numbers: what worked, what flopped, what made money. One email when there is something worth reading.
No spam, never sold. Every email has a one-click unsubscribe.
What are people saying about this? Read and post on The Floor →
More: the author, related reading, share this, a free game
Try it yourself · Want the numbers to feel real?
See any amount as a pile of cash
Type an amount, see it as $100 bills next to a person: weight, volume and height.
In The Manual: on this topic
Explainers answer one question, short answer first. Guides walk you through it step by step.
- Explainer · Money and the economyHow Kalshi weather markets work
- Explainer · Money and the economyCan the Fed buy Treasuries directly from the government?
- Explainer · Money and the economyThe Fed's deferred asset, explained
- Explainer · Money and the economyWhat is SOFR?
Read next
- Economics · Oct 25, 2026 · 7 min readDeepSeek's $15B round: 5% of OpenAI's price, 22% of its API bill
- Economics · Oct 25, 2026 · 9 min readSpaceX's $40B Nvidia chip debt costs 8.3%. Apollo is the lender
- Economics · Oct 25, 2026 · 8 min readKOSPI target cut to 9,000: Korea is priced for a 65% chip crash