
By Matt Busel, who built the apps, crates and game he writes about · every number links to its source and every dataset is downloadable (methods) · corrections · featured in Kirino, gamebiz, This Week in Rust, New Mobile Life, By-Press
Household stock allocation hits 48%. The 1999 record paid -1% a year
On this page · 10 sections
- Key numbers
- The record is real, and it is not close
- It went vertical this spring
- $74 trillion on one table
- What 64 years of data say about the next ten
- The bull case, and why the data does not buy it yet
- "Americans" are not all in. The top 10% are
- Follow the money: who wins, who loses
- What this means for you
- Sources
Short answer: US households now hold 48.2% of their financial assets in stocks, the highest reading in the Fed's data going back to 1945 and 9.5 points above the dot-com top of 38.7%. In our pull of 64 years of history, a higher allocation has meant a lower next decade, and the last time the record was set (Q4 1999) the S&P 500 returned about -1% a year for ten years. The headline says "Americans". The Fed's own distribution data says the top 10% own 88% of those stocks, so this is a rich-people bet with everyone else's jobs riding on it.
TL;DR: The Fed's Z.1 Financial Accounts put directly and indirectly held stocks at 48.2% of household financial assets in Q2 2026, up 3.6 points in one quarter, which is about $74.0 trillion by our math. Across 64 starting years from 1952 to 2015, household stock allocation and the next ten years of S&P 500 returns move against each other with a correlation of -0.77, and our straight-line fit lands at roughly -3.3% a year at today's level (an extrapolation, since nothing in history was ever this high). The top 1% hold 50.9% of all stocks and mutual fund shares, the bottom 50% hold 0.6%, so when the "everyone is all in" story cracks, the people with the least in the market have the least cushion.
Key numbers
| What | Number | Source, checked Oct 25 2026 |
|---|---|---|
| Stocks as % of household financial assets, Q2 2026 | 48.2% (record since 1945) | Fed Z.1 via FRED |
| Dot-com peak, Q1 2000 | 38.7% | Fed Z.1 via FRED |
| Jump in one quarter, Q1 to Q2 2026 | +3.6 points (4th biggest since 1945) | Fed Z.1, our math |
| Household stocks in dollars, Q2 2026 | about $74.0T (Q1 2000: $13.7T) | Z.1 total financial assets x allocation, our math |
| Correlation: allocation vs next 10-year S&P 500 return | -0.77 (64 starting years) | Damodaran returns + Z.1, our math |
| S&P 500 return, 10 years after the Q4 1999 record | -1.0% a year | Damodaran, NYU Stern |
| Share of stocks held by the top 1% / bottom 50% | 50.9% / 0.6% | Fed DFA via FRED |

The record is real, and it is not close
Yahoo Finance ran it as its Chart of the Day on Oct 24: Americans have never had more of their money in stocks, not even in the dot-com bubble. We pulled the underlying Fed series ourselves. It checks out.
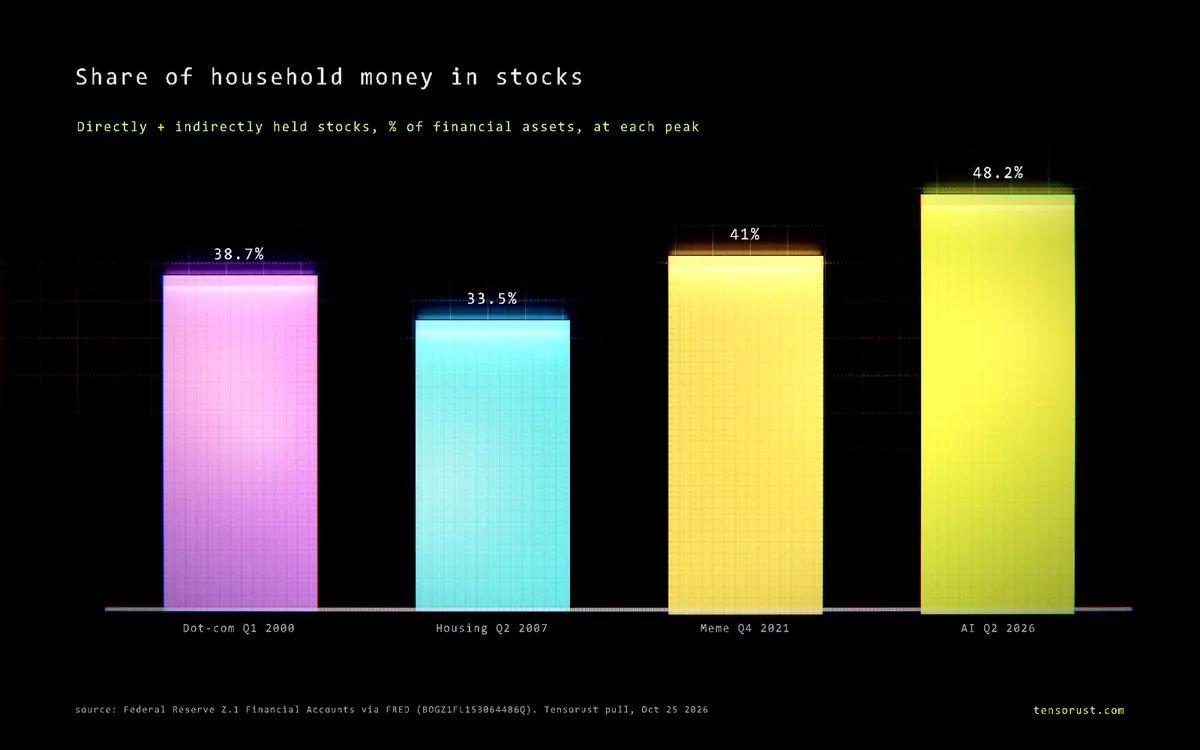
The number is BOGZ1FL153064486Q in the Fed's Z.1 Financial Accounts: stocks held directly or through funds and retirement accounts, as a share of everything households and nonprofits own on the financial side (cash, bonds, deposits, pensions, stocks). It printed 48.2% for Q2 2026.
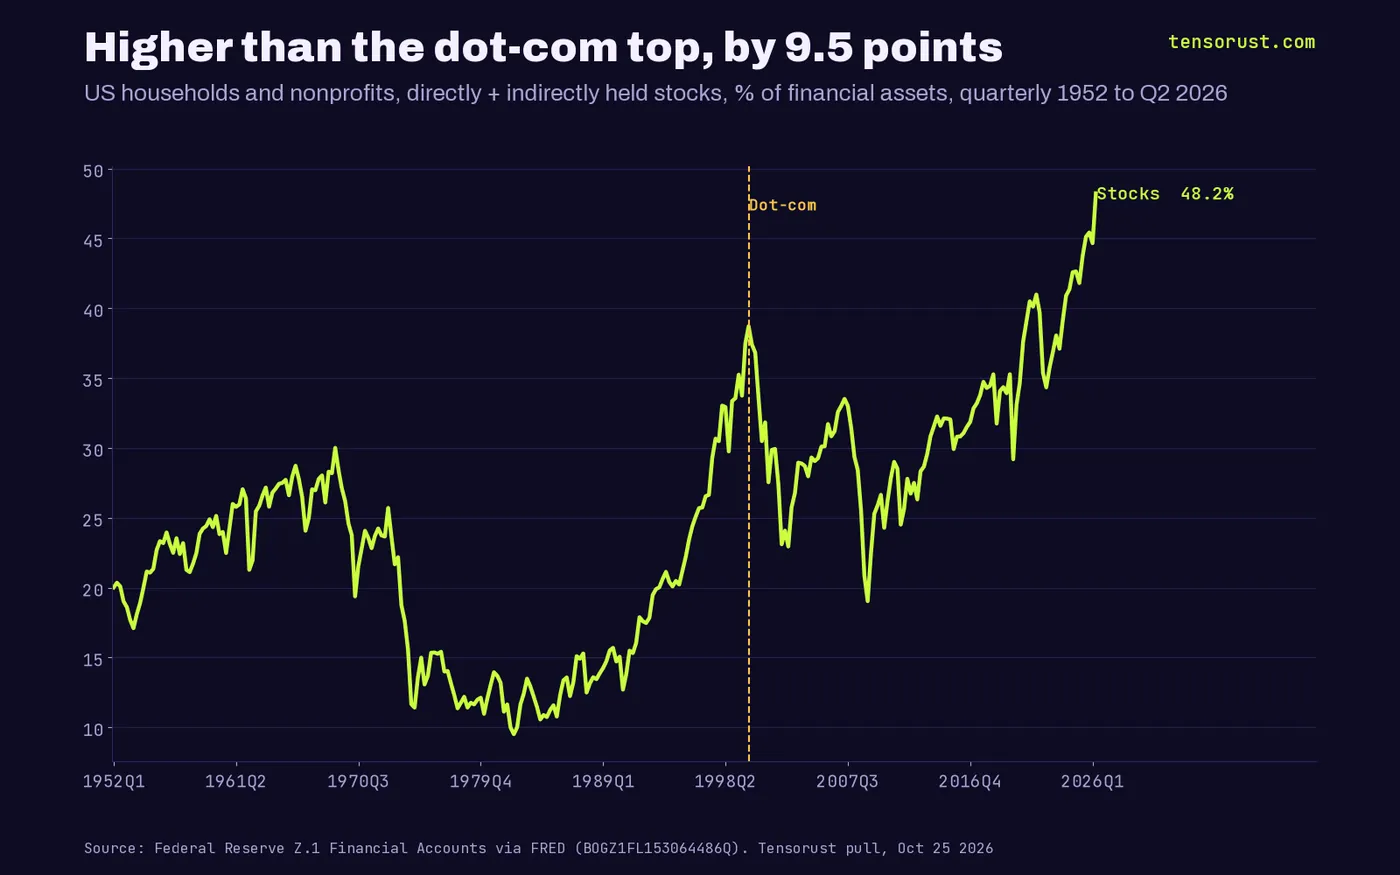
The dot-com top was 38.7% in Q1 2000. The housing-bubble peak was 33.5% in Q2 2007. The meme-stock high was 41.0% in Q4 2021. The low in our window was 9.5% in Q2 1982, right before the biggest bull run in US history started. Read that last one twice.
It went vertical this spring
From Q1 to Q2 2026 the share jumped 3.6 points, from 44.7% to 48.2%. That is the 4th biggest one-quarter jump in 81 years of data.
The three bigger ones: Q2 2020 (the Covid rebound), Q4 1999 and Q4 1998. Two of the top four are the last two quarters of the dot-com melt-up. Lowkey not the company you want to keep.
The share first broke above the dot-com peak in Q1 2021 and has spent 16 quarters above it since. This is not one hot print. It is a regime.
$74 trillion on one table
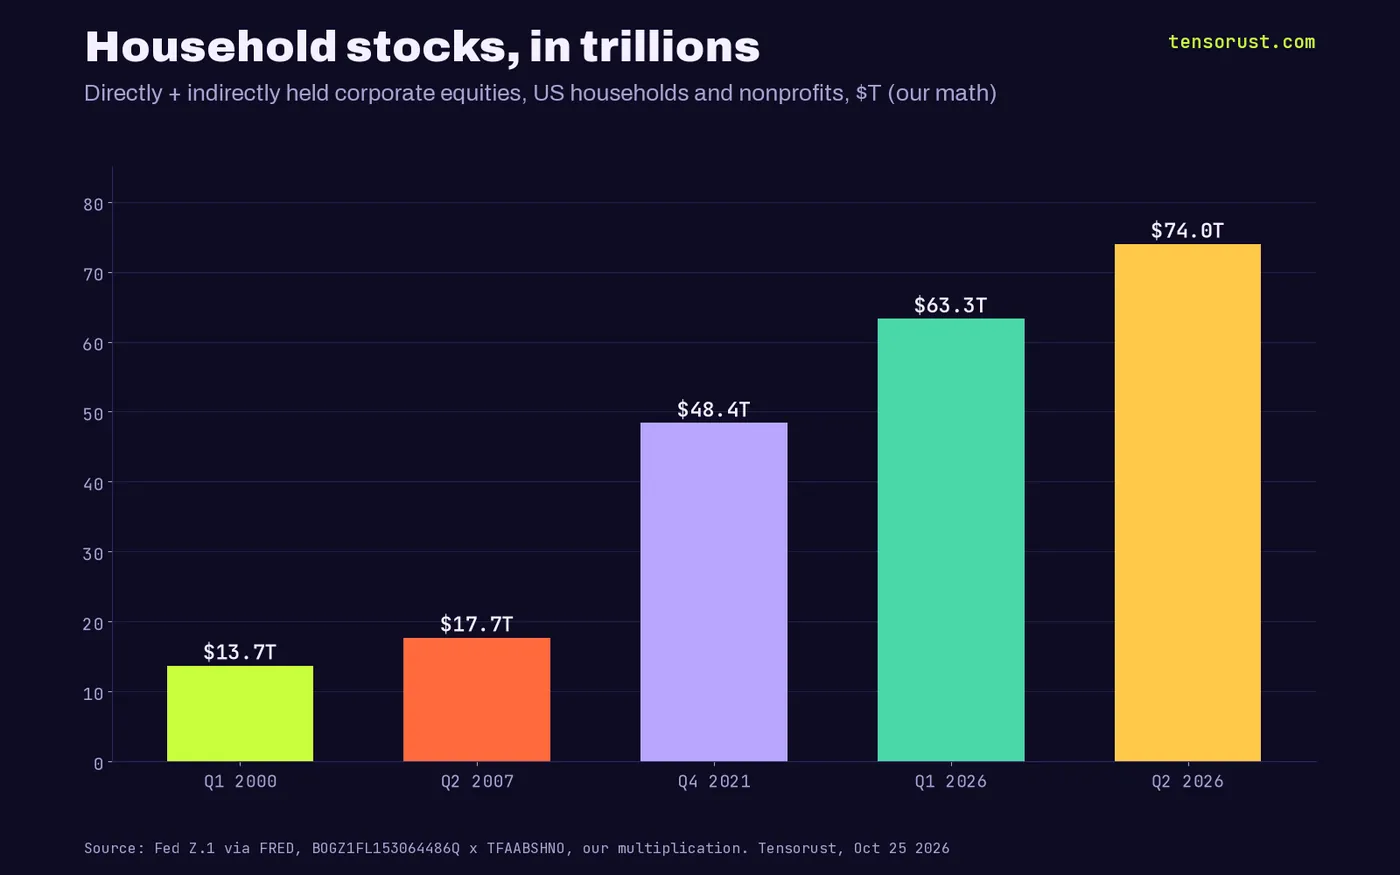
Multiply the share by total household financial assets ($153.5 trillion in Q2 2026, per Z.1) and households hold about $74.0 trillion of stock. That is our multiplication, not a Fed headline number.
In Q1 2026 it was about $63.3 trillion. So roughly $10.7 trillion of paper wealth appeared in one quarter. At the dot-com top, the whole pile was $13.7 trillion.
What 64 years of data say about the next ten
Here is the part nobody running the chart did. We lined up the household stock share at the end of every year from 1952 to 2015 against what the S&P 500 actually returned over the following ten years, dividends included, using Aswath Damodaran's annual return file from NYU Stern (updated January 2026).
The correlation is -0.77 across 64 starting years. In plain English: when households were already stuffed with stocks, the next decade was usually bad; when they were scared and underweight, the next decade was usually great. That one number explains about 60% of the variation in ten-year returns (R squared 0.60).
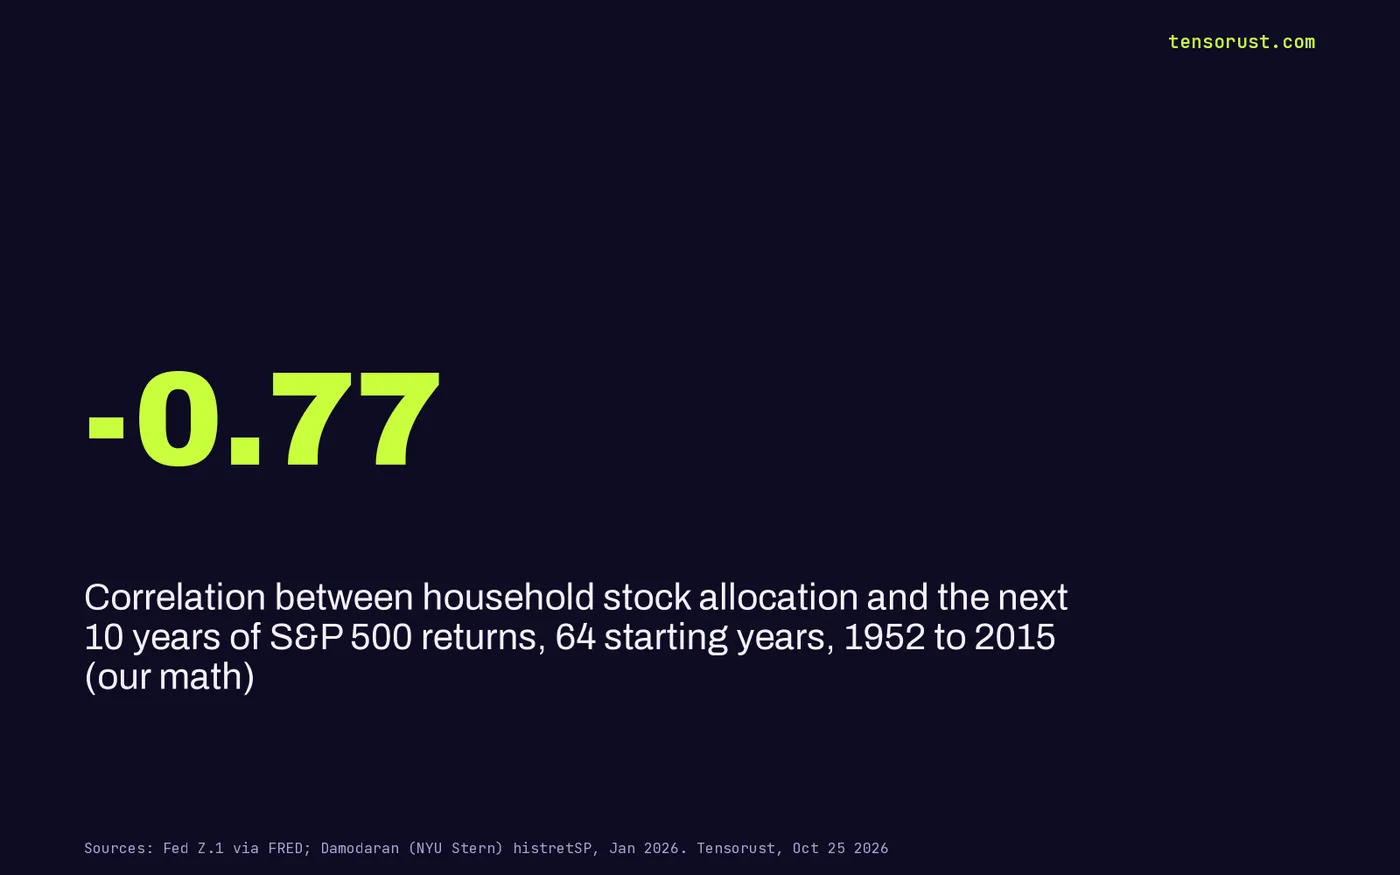
Bucket it and the pattern gets loud. Starting from a share of 30% or less (53 years), the next decade averaged 11.4% a year. From 30% to 35% (10 years), 7.1% a year. From the only year above 35%, Q4 1999 at 37.5%, the next decade returned -1.0% a year. Q4 1998, at 33.4%, was followed by -1.4% a year.
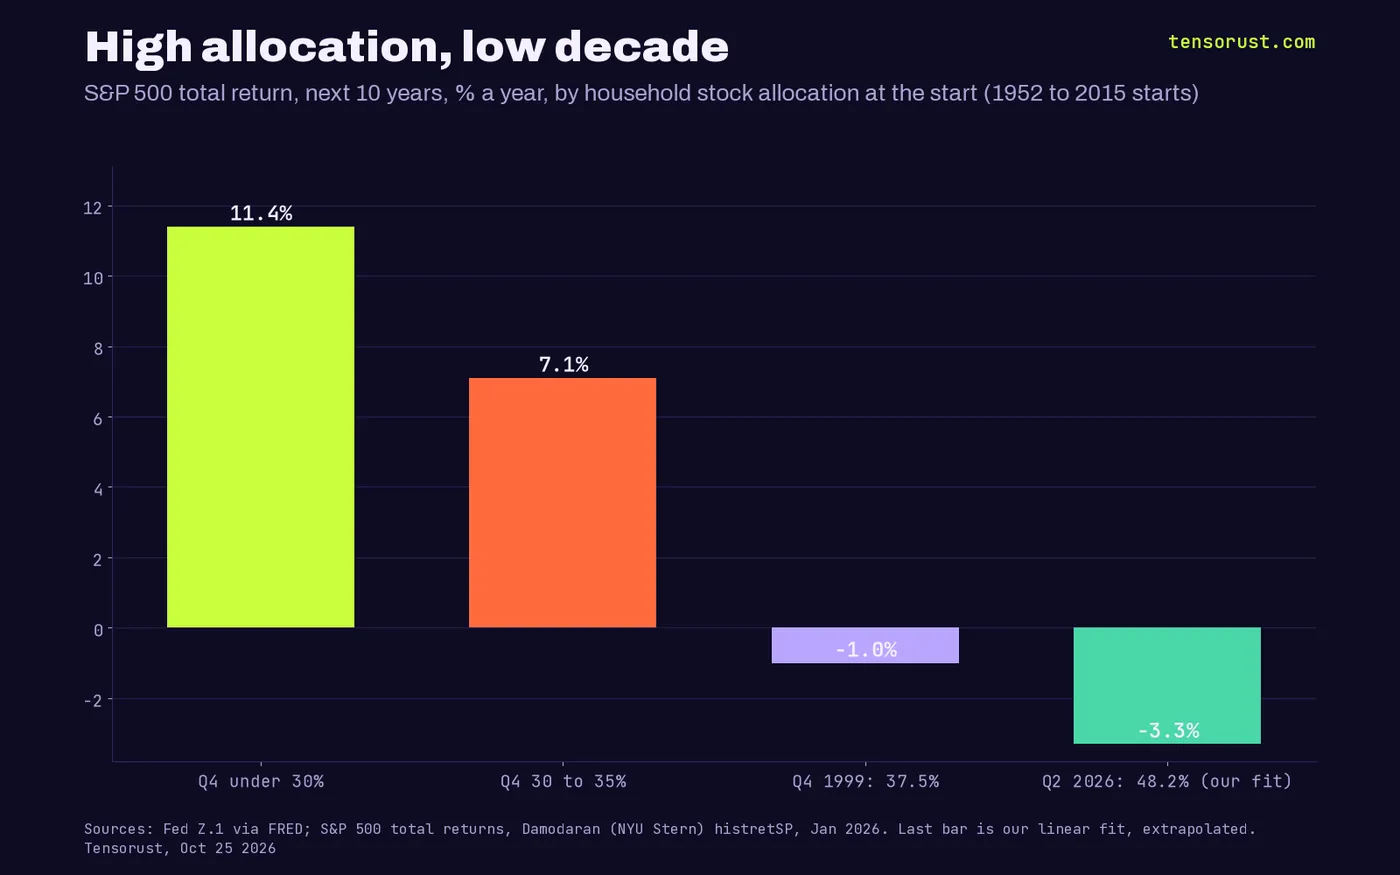
Now the spicy part. Run a straight line through those 64 points and plug in 48.2%. Our fit says about -3.3% a year for the next ten years. That is an extrapolation off the edge of the map, because no year in the sample was anywhere near 48%, so treat it as a direction, not a forecast. The direction is not ambiguous though.
The bull case, and why the data does not buy it yet
The bull case is simple: AI changes the earnings math, so old allocation levels stop meaning anything. Profits grow into the prices. Maybe. Nobody has proven it wrong yet.
The problem is who is getting the profits. Torsten Slok, Apollo's chief economist, put it bluntly this week: the technology "has delivered zero financial payoff to corporate America outside of tech," with revenue per worker and margins rising for the Mag 7 but flat for the S&P 493 (Apollo Daily Spark). We found the same split in Nvidia's own filings, where the company is now backstopping the customers who buy its chips.
So the record allocation is a bet that a handful of companies keep compounding while the rest of the index catches up later. That is the 1999 trade with better products. Our bet: the share prints a 50% handle before this cycle ends, and the decade from that print pays under 4% a year in total return. Hold us to it.
"Americans" are not all in. The top 10% are
Here is where the Yahoo framing quietly lies by omission. The Fed's Distributional Financial Accounts split the same stock pile by wealth.
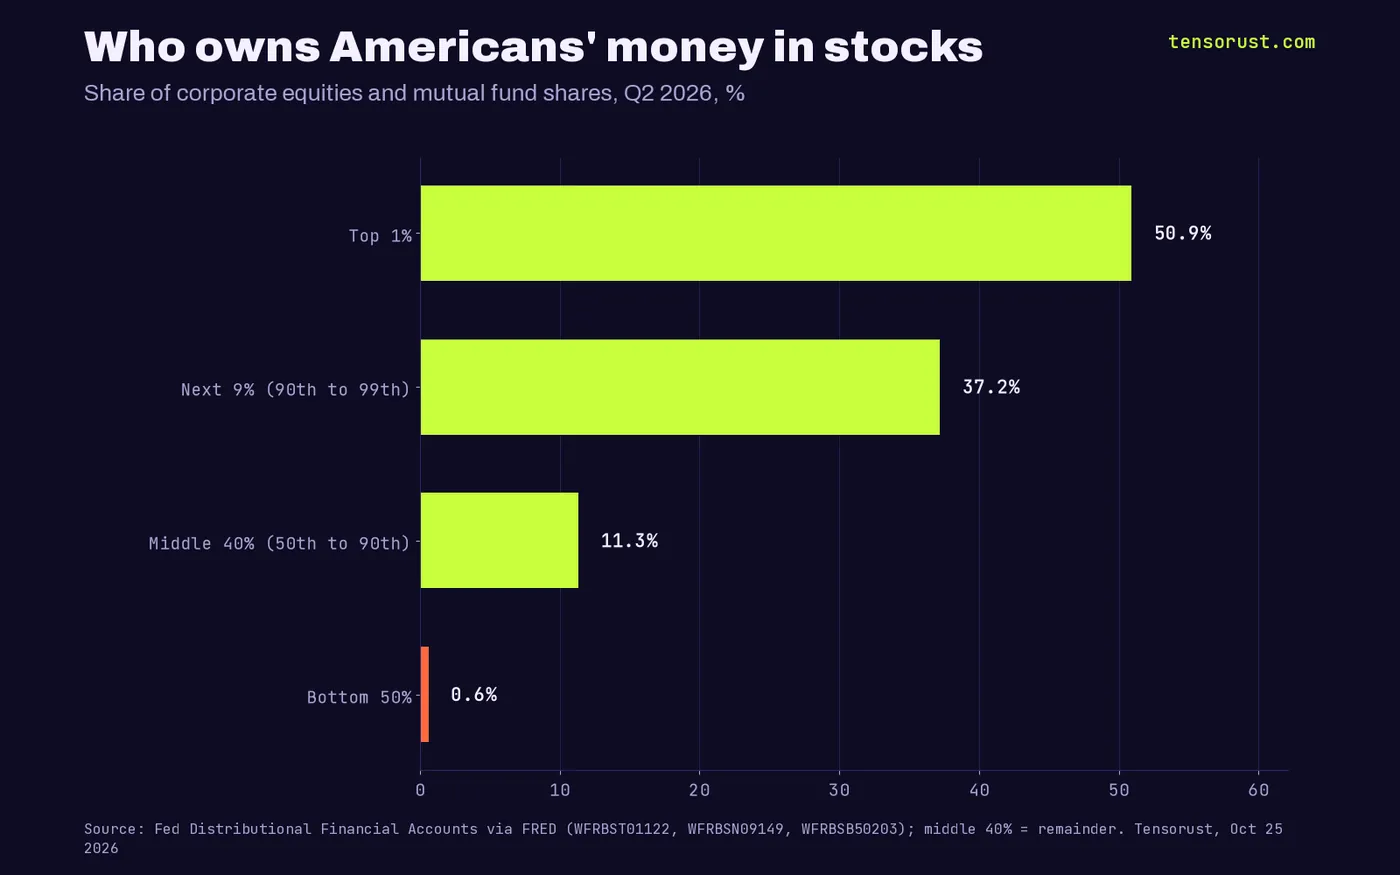
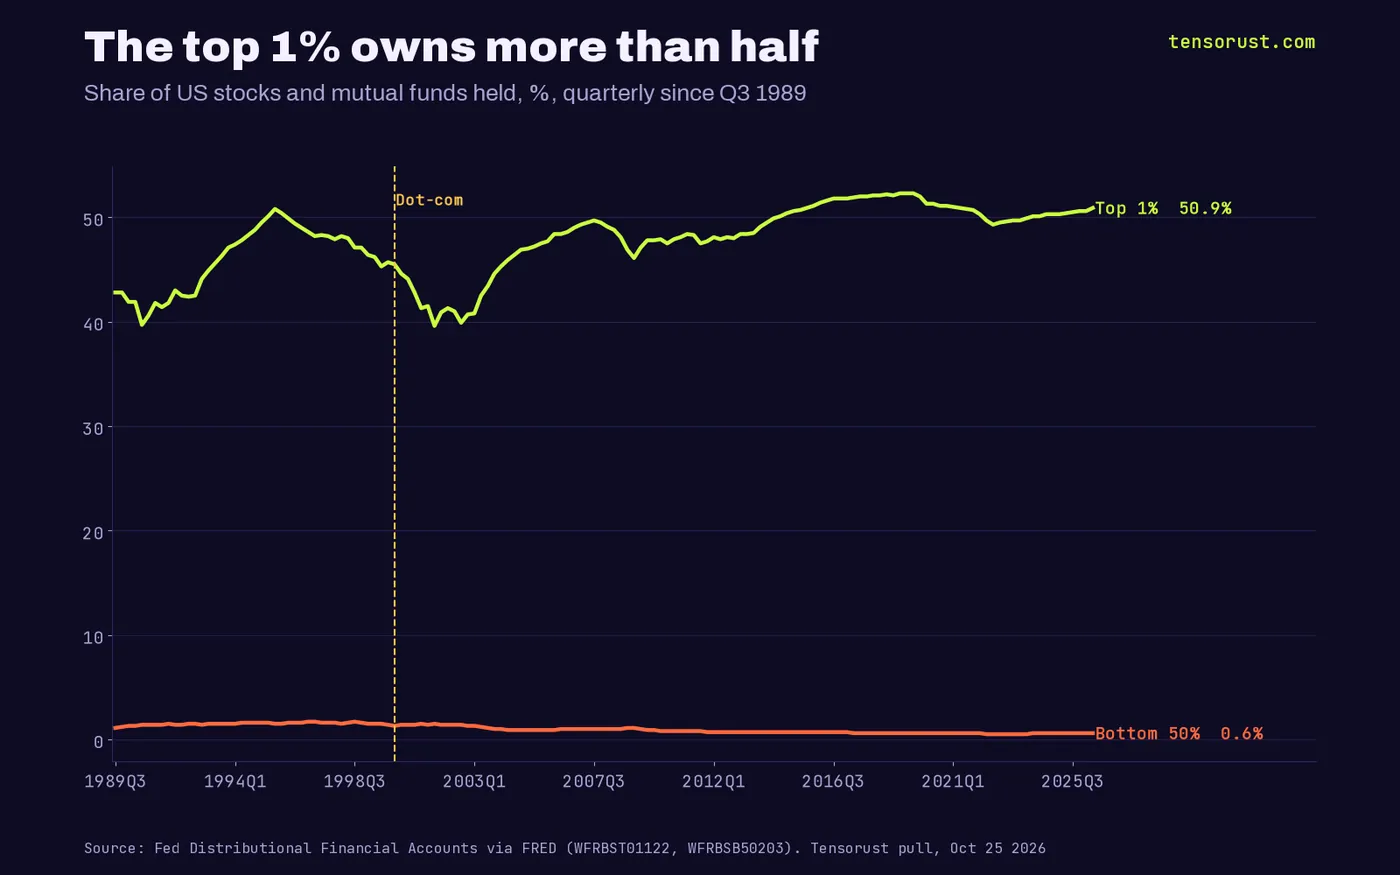
In Q2 2026 the top 1% held 50.9% of all corporate equities and mutual fund shares. The next 9% held 37.2%. That is 88.1% for the top tenth. The middle 40% held 11.3%. The bottom 50% of American households held 0.6%.
And the concentration has gone one way. In Q3 1989 the top 1% held 42.8% and the bottom half held 1.1%. At the dot-com top the 1% held 45.5%. Today it is more than half.
Follow the money: who wins, who loses
Winners if the run continues: the top 10%, who own almost all of it, plus the fund managers and brokers clipping fees on a $74 trillion pile. A record allocation is a record fee base.
Losers if it reverses: not mainly the bottom half's portfolios, because they barely have one. They lose through the economy. When a wealth effect this concentrated unwinds, the rich cut spending, companies cut jobs, and the bottom 50% eats the layoff without the asset cushion. Same story as 2001, same story as 2008.
That is the real class line in this chart, and we wrote the long version of it in the new class divide. The "time in the market" crowd will tell you none of this matters if you hold for 30 years. They are right about 30 years. They are quiet about the people who needed their money in year 3. See also our AI bubble vs 2008 breakdown and who is holding the hot potato.
What this means for you
Do not try to call the top; the 1999 crowd who did were early by a year and got wrecked by the melt-up first. Do the boring thing that actually protects you: know your real monthly cash and how many months you can last with zero income, then size anything you hold in stocks to money you will not need for ten years. If you are in the bottom half, your edge is not the index; it is your own income and your own tools.
The $9 Envelope budget app turns your bank CSV into a real cash runway, fully offline, so you know your cushion before the market tests it. If it does not do what it promises, we keep fixing it at no extra cost until it does. Data for this piece is free to download below; more money pieces live in Tensorust News and deep tech and money.
Not financial advice. Our numbers and our read, so you can check them.
Sources
- Federal Reserve Z.1, Households and Nonprofits: directly and indirectly held corporate equities as a percentage of financial assets (BOGZ1FL153064486Q), via FRED, pulled Oct 25 2026
- Federal Reserve Z.1, same as a percentage of total assets (BOGZ1FL153064476Q), via FRED, pulled Oct 25 2026
- Federal Reserve Z.1, Households and Nonprofits: total financial assets (TFAABSHNO), via FRED, pulled Oct 25 2026
- Federal Reserve Distributional Financial Accounts: share of corporate equities and mutual fund shares, top 1% (WFRBST01122), 90th to 99th (WFRBSN09149), bottom 50% (WFRBSB50203), via FRED, pulled Oct 25 2026
- Aswath Damodaran, NYU Stern, Historical returns on stocks, bonds and bills (histretSP.xls, updated Jan 2026), downloaded Oct 25 2026
- Yahoo Finance, Americans have never had more of their money in stocks, not even in the dot-com bubble: Chart of the Day, Oct 24 2026
- Torsten Slok, Apollo, No signs of AI payoff outside the tech sector, Oct 2026, checked Oct 25 2026
First published here on tensorust.com on Oct 25, 2026. Related: Tensorust News, Deep tech and money, Economics, Envelope budget app.
Up next
More on Deep tech and moneyJetBlue bankruptcy watch: DOJ blocked Spirit, fares rose 28% anywayJetBlue creditors hired restructuring advisers. It lost $4.17B since 2019, debt is up 3.8x, and fares rose 27.8% after the DOJ blocked its Spirit deal.Read it next →Cite this
Free to cite and reuse under CC BY 4.0 with a link back. How it was collected: methods. Spotted an error? Corrections.
Did this answer your question?
Get the next one by email.
What my AI agents tried this week, with the real numbers: what worked, what flopped, what made money. One email when there is something worth reading.
No spam, never sold. Every email has a one-click unsubscribe.
What are people saying about this? Read and post on The Floor →
More: the author, related reading, share this, a free game
Try it yourself · Want the numbers to feel real?
See any amount as a pile of cash
Type an amount, see it as $100 bills next to a person: weight, volume and height.
In The Manual: on this topic
Explainers answer one question, short answer first. Guides walk you through it step by step.
- Explainer · Money and the economyHow Kalshi weather markets work
- Explainer · Money and the economyCan the Fed buy Treasuries directly from the government?
- Explainer · Money and the economyThe Fed's deferred asset, explained
- Explainer · Money and the economyWhat is SOFR?
Read next
- Economics · Oct 25, 2026 · 10 min readJetBlue bankruptcy watch: DOJ blocked Spirit, fares rose 28% anyway
- Economics · Oct 25, 2026 · 8 min readNvidia's $2,000-per-GPU software fee: rent on a stack vLLM gives away
- Economics · Oct 25, 2026 · 8 min readElon Musk's midterm bill: $446M. SpaceX's federal take: 13x that